How to Export D3 Charts as PNGs with html2canvas and Custom Fonts
Export a D3 SVG chart to a sharp PNG with html2canvas, loaded custom fonts, correct dimensions, and reliable cross-origin asset handling.
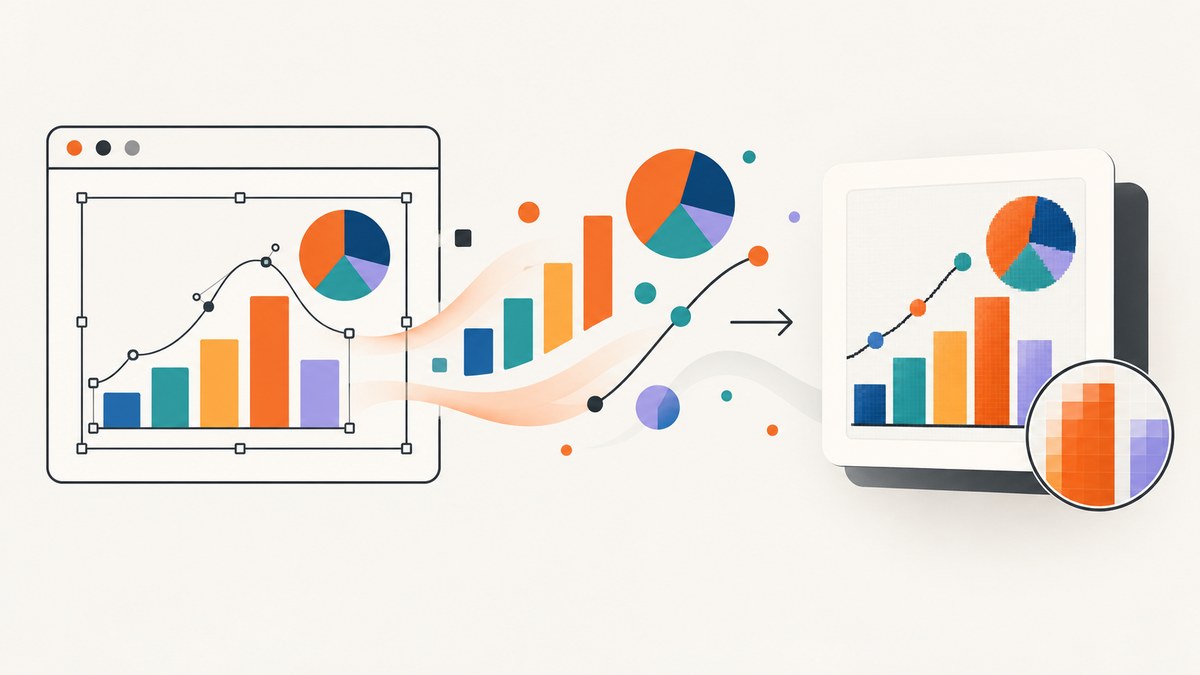
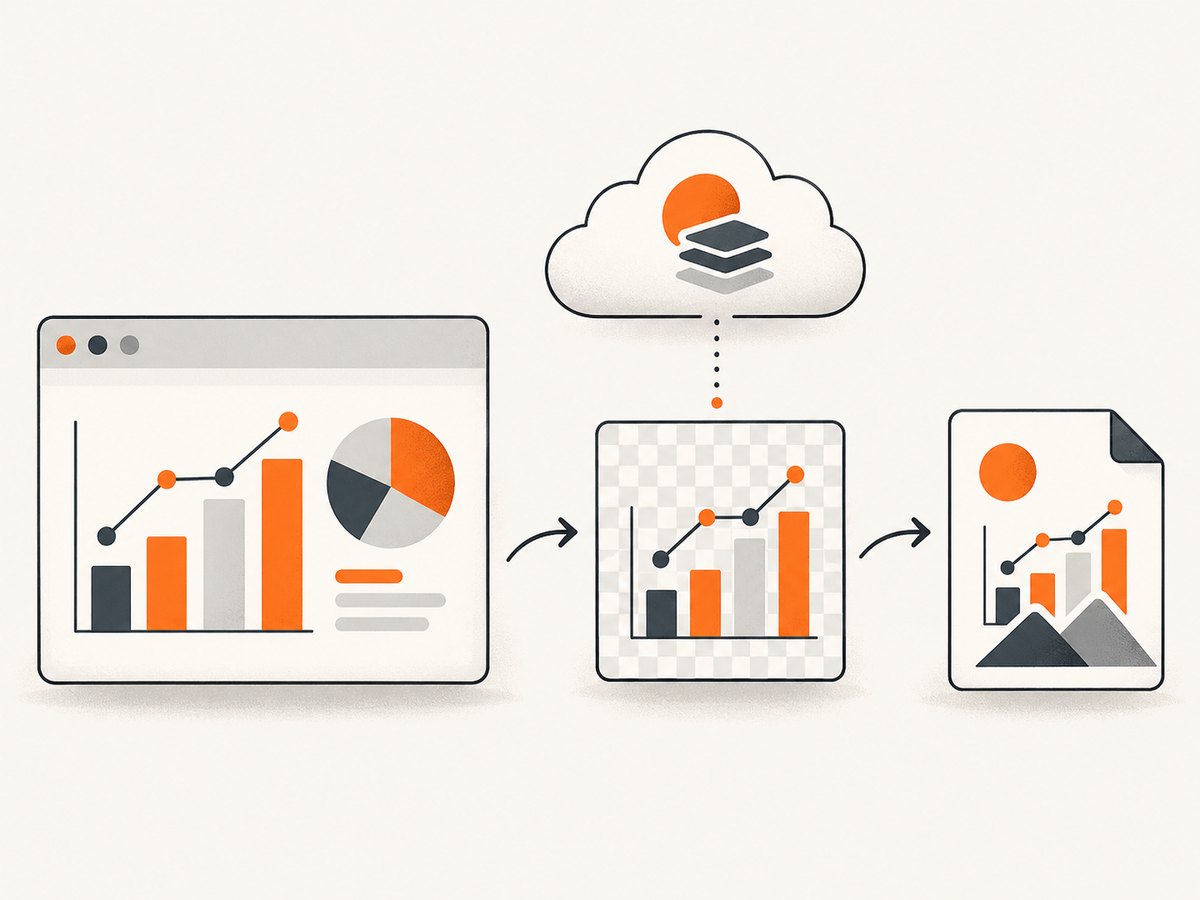
Direct answer: build the D3 chart as an SVG inside a wrapper element, wait until custom fonts have finished loading, then call html2canvas(wrapper, options). Set an explicit scale, capture dimensions, background color, and cross-origin settings. Serialize the returned canvas with toBlob() or toDataURL() and download the PNG.
html2canvas reconstructs a DOM representation rather than taking a literal operating-system screenshot. It renders the CSS and elements it understands, so the result can differ from the browser’s exact pixels. D3 creates the SVG; html2canvas captures the wrapper containing that SVG.
1. Complete working example
This example creates a D3 bar chart, loads a Google-hosted font, waits for the font promise, captures the chart at two-times resolution, and downloads a PNG. Save it as index.html and serve it from a local HTTP server (for example, python -m http.server) so browser font and asset rules behave consistently.
<!doctype html>
<html lang="en">
<head>
  <meta charset="utf-8">
  <meta name="viewport" content="width=device-width, initial-scale=1">
  <title>D3 chart export</title>
  <link rel="preconnect" href="https://fonts.googleapis.com">
  <link rel="preconnect" href="https://fonts.gstatic.com" crossorigin>
  <link href="https://fonts.googleapis.com/css2?family=Inter:wght@400;600&display=swap" rel="stylesheet">
  <style>
    :root { font-family: Inter, sans-serif; }
    body { margin: 2rem; background: #f3f6fb; color: #172033; }
    #chart-card { width: 760px; padding: 24px; background: white; border-radius: 12px; }
    #chart { display: block; width: 100%; height: auto; }
    .axis path, .axis line { stroke: #cbd5e1; }
    .axis text { fill: #475569; font-size: 12px; }
    .bar { fill: #2563eb; }
    .value { fill: #172033; font-size: 12px; font-weight: 600; text-anchor: middle; }
    button { margin-top: 1rem; padding: .65rem 1rem; cursor: pointer; }
  </style>
</head>
<body>
  <div id="chart-card">
    <h1>Quarterly revenue</h1>
    <svg id="chart" role="img" aria-label="Quarterly revenue bar chart"></svg>
    <button id="download">Download PNG</button>
  </div>

  <script src="https://cdn.jsdelivr.net/npm/d3@7"></script>
  <script src="https://cdn.jsdelivr.net/npm/html2canvas@1.4.1/dist/html2canvas.min.js"></script>
  <script>
    const data = [
      { quarter: "Q1", value: 42 },
      { quarter: "Q2", value: 68 },
      { quarter: "Q3", value: 57 },
      { quarter: "Q4", value: 91 }
    ];

    const width = 712;
    const height = 360;
    const margin = { top: 20, right: 20, bottom: 48, left: 56 };
    const innerWidth = width - margin.left - margin.right;
    const innerHeight = height - margin.top - margin.bottom;

    const svg = d3.select("#chart")
      .attr("width", width)
      .attr("height", height)
      .attr("viewBox", `0 0 ${width} ${height}`);

    const x = d3.scaleBand()
      .domain(data.map(d => d.quarter))
      .range([0, innerWidth])
      .padding(0.25);

    const y = d3.scaleLinear()
      .domain([0, d3.max(data, d => d.value)])
      .nice()
      .range([innerHeight, 0]);

    const plot = svg.append("g")
      .attr("transform", `translate(${margin.left},${margin.top})`);

    plot.append("g")
      .attr("class", "axis")
      .attr("transform", `translate(0,${innerHeight})`)
      .call(d3.axisBottom(x));

    plot.append("g")
      .attr("class", "axis")
      .call(d3.axisLeft(y));

    plot.selectAll("rect")
      .data(data)
      .join("rect")
      .attr("class", "bar")
      .attr("x", d => x(d.quarter))
      .attr("y", d => y(d.value))
      .attr("width", x.bandwidth())
      .attr("height", d => innerHeight - y(d.value));

    plot.selectAll(".value")
      .data(data)
      .join("text")
      .attr("class", "value")
      .attr("x", d => x(d.quarter) + x.bandwidth() / 2)
      .attr("y", d => y(d.value) - 8)
      .text(d => d.value);

    async function downloadChart() {
      const target = document.querySelector("#chart-card");

      // Wait for every document font to finish loading before measuring text.
      if (document.fonts && document.fonts.ready) {
        await document.fonts.ready;
      }

      const canvas = await html2canvas(target, {
        scale: 2,
        backgroundColor: "#ffffff",
        useCORS: true,
        width: target.scrollWidth,
        height: target.scrollHeight,
        windowWidth: target.scrollWidth,
        windowHeight: target.scrollHeight,
        onclone: (clonedDocument) => {
          // Make the cloned copy use the intended family if another stylesheet
          // or a responsive rule changes it during cloning.
          const clonedTarget = clonedDocument.querySelector("#chart-card");
          if (clonedTarget) clonedTarget.style.fontFamily = "Inter, sans-serif";
        }
      });

      canvas.toBlob((blob) => {
        if (!blob) throw new Error("The browser could not create a PNG blob.");
        const url = URL.createObjectURL(blob);
        const link = document.createElement("a");
        link.href = url;
        link.download = "quarterly-revenue.png";
        link.click();
        URL.revokeObjectURL(url);
      }, "image/png");
    }

    document.querySelector("#download").addEventListener("click", downloadChart);
  </script>
</body>
</html>
2. How the export pipeline works
- D3 appends an SVG element and draws axes, marks, and labels in the DOM. The official D3 getting-started guide follows this same SVG-in-a-container model.
- The code waits for
document.fonts.ready. This prevents a fallback font from being measured and then replaced after the capture. html2canvas()clones the relevant DOM, computes supported styles, and resolves a Promise with a canvas. See the html2canvas documentation.- The canvas is encoded as a PNG.
toBlob()is preferable for larger charts because it avoids keeping a large base64 string in memory.
3. Control resolution, size, and crop
scale controls output pixels per CSS pixel. html2canvas defaults to window.devicePixelRatio; set it explicitly when exports must be reproducible across monitors.
| Goal | Suggested setting | Trade-off |
|---|---|---|
| Small web preview | scale: 1 |
Small file and fast rendering |
| Retina PNG | scale: 2 |
Four times as many pixels as scale 1 |
| Print-oriented export | scale: 3 or higher |
More memory and longer capture time |
Use the element’s rendered dimensions when a chart extends beyond the viewport:
const rect = target.getBoundingClientRect();
const canvas = await html2canvas(target, {
  scale: 2,
  width: Math.ceil(target.scrollWidth || rect.width),
  height: Math.ceil(target.scrollHeight || rect.height),
  windowWidth: Math.ceil(target.scrollWidth || rect.width),
  windowHeight: Math.ceil(target.scrollHeight || rect.height)
});
For a responsive SVG, give the SVG a viewBox and make its CSS width predictable before capture. If an ancestor has overflow: hidden, the clipped result is expected; remove that rule or capture a larger wrapper.
4. Keep custom fonts in the PNG
Font problems usually happen because capture starts before the web font has loaded, the cloned document selects a different family, or the requested weight is not available. Use this checklist:
- Declare the exact family and weights used by SVG text and surrounding HTML.
- Wait for
document.fonts.readyimmediately before capture. - Check the browser’s Network and Fonts panels for failed font requests.
- Use
oncloneto apply a stable family or weight in html2canvas’s cloned document. - Do not rely on a font that is installed only on the developer’s machine.
await document.fonts.load('600 14px "Inter"');
await document.fonts.ready;

const canvas = await html2canvas(document.querySelector('#chart-card'), {
  onclone: (doc) => {
    doc.querySelectorAll('text, .value, #chart-card').forEach((node) => {
      node.style.fontFamily = 'Inter, sans-serif';
    });
  }
});
When exporting the SVG itself rather than the surrounding DOM, portability is different. svg-exportJS supports SVG-to-PNG/JPEG/PDF conversion and font options, but its documentation warns that embedded custom fonts display correctly only when the system opening the SVG has that font installed. A raster PNG produced in the browser avoids requiring the recipient to install that font, provided the font was loaded before capture.
5. External images, CORS, and security boundaries
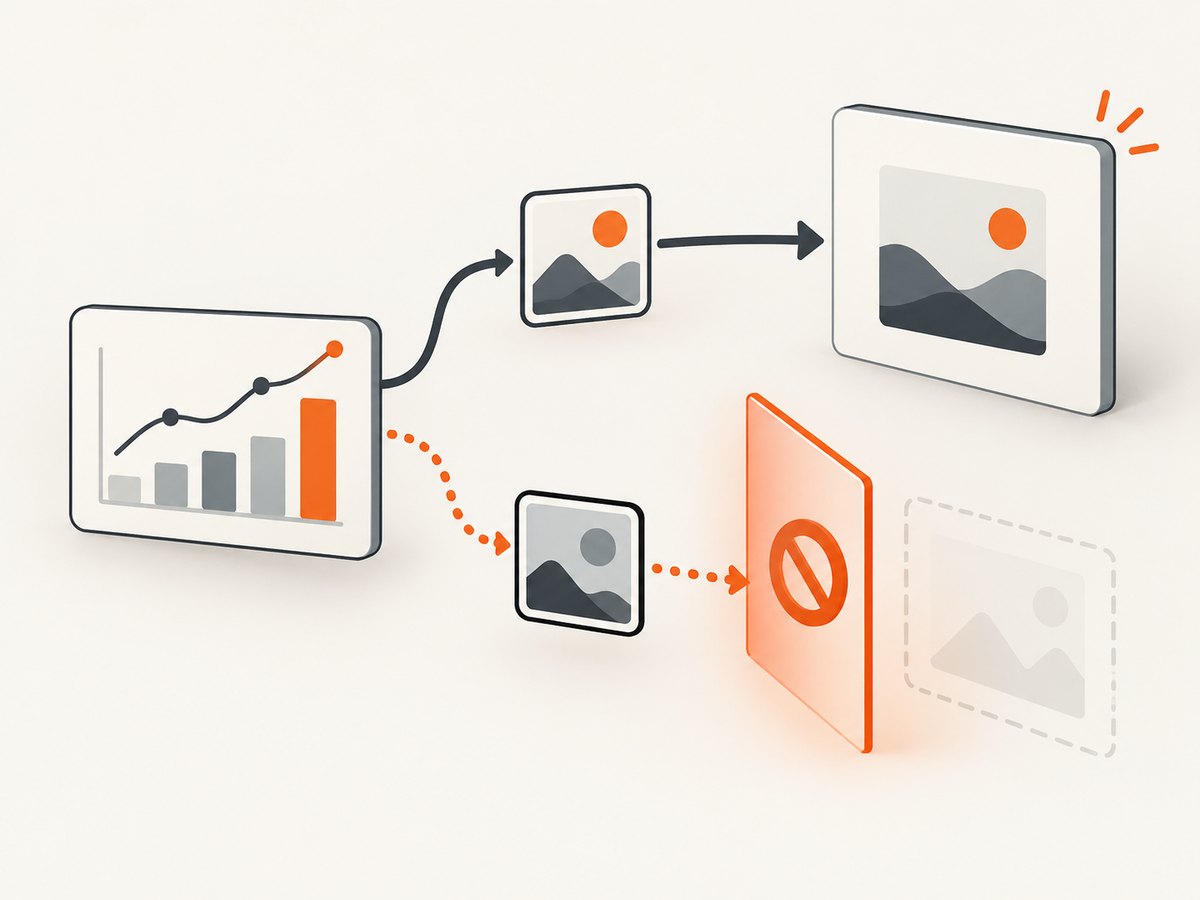
html2canvas cannot bypass browser content-policy restrictions. An image used inside the chart or wrapper must be same-origin, served with an appropriate CORS response and captured with useCORS: true, or fetched through a proxy configured for this purpose.
const canvas = await html2canvas(target, {
  useCORS: true,
  allowTaint: false,
  proxy: '/html2canvas-proxy',
  backgroundColor: '#fff'
});
useCORS only helps when the remote server sends the required CORS headers. It does not grant permission to read arbitrary images. If a cross-origin image taints the canvas, calls such as toDataURL() or toBlob() can fail. For a chart that does not need an image, remove the image node before capture or set its source to a same-origin asset.
6. Useful html2canvas options
| Option | Use it for | Notes |
|---|---|---|
scale |
Output resolution | Set explicitly for repeatable PNGs. |
backgroundColor |
Solid background | Use null for transparency where supported by the target browser and design. |
useCORS |
CORS-enabled images | Requires response headers from the asset server. |
width, height |
Capture dimensions | Useful for charts wider or taller than the viewport. |
windowWidth, windowHeight |
Layout viewport used during cloning | Set them with large or responsive charts to avoid breakpoint changes. |
x, y |
Crop origin | Capture a subsection of a larger target. |
ignoreElements |
Exclude controls | Return true for download buttons, tooltips, or debug overlays. |
onclone |
Adjust cloned DOM | Apply font, visibility, or layout fixes without changing the live page. |
foreignObjectRendering |
Try browser foreign-object rendering | It is experimental; verify behavior in every target browser before depending on it. |
7. Export only the chart, not the page
Capture the smallest stable wrapper around the SVG. This avoids navigation, buttons, and unrelated layout affecting the image.
const chartOnly = document.querySelector('#chart');
const canvas = await html2canvas(chartOnly, {
  scale: 2,
  backgroundColor: '#ffffff',
  width: chartOnly.clientWidth,
  height: chartOnly.clientHeight
});
If the chart’s title, legend, or notes must appear in the PNG, put them in one wrapper such as #chart-card. To remove a tooltip or animation cursor in the clone:
const canvas = await html2canvas(target, {
  ignoreElements: (element) => element.matches('.tooltip, .export-controls'),
  onclone: (doc) => {
    doc.querySelectorAll('.animated-mark').forEach((node) => {
      node.style.animation = 'none';
      node.style.transition = 'none';
    });
  }
});
8. Troubleshooting
| Symptom | Likely cause | Fix |
|---|---|---|
| Blank PNG | The target has zero width or height, or capture ran before D3 rendered. | Run capture after the D3 join completes; log getBoundingClientRect(); wait for fonts and images. |
| Text uses the wrong font | The web font was still loading or the cloned DOM selected a fallback. | Await document.fonts.ready, verify the requested weight, and set the family in onclone. |
| Labels are clipped | The SVG or wrapper is smaller than its content. | Set explicit SVG dimensions, use a correct viewBox, and pass width/height based on scroll dimensions. |
| Remote image is missing | Cross-origin response lacks CORS headers. | Serve the image from the same origin, configure CORS, or use a proxy. Keep useCORS: true. |
SecurityError during serialization |
The canvas was tainted by an unreadable cross-origin resource. | Remove the resource or fix its CORS delivery; html2canvas cannot circumvent browser policy. |
| Chart looks different from the page | Unsupported CSS, pseudo-elements, filters, or layout differences in DOM reconstruction. | Inspect supported styles, simplify export-only CSS, or use direct SVG serialization. |
| Animation captured halfway | Capture occurred during a D3 transition. | Disable transitions for export or await the transition’s end before calling html2canvas. |
| PNG is too large | High scale multiplied both dimensions. |
Use the lowest scale that meets the delivery requirement, crop to the chart, and prefer toBlob(). |
9. Performance and reliability
- Capture after layout settles: wait for D3 rendering, fonts, image decoding, and any data-dependent transitions.
- Limit pixel area: memory use grows with width × height × scale². A full dashboard at scale 3 can exceed mobile canvas limits.
- Reuse one export path: centralize options and font waits so every chart has the same output rules.
- Handle failure: wrap the Promise and blob callback in error handling, and show a retry action instead of silently downloading nothing.
- Test target browsers: CSS support and experimental foreign-object rendering vary by browser.
- Consider direct SVG export: when preserving vector semantics, CSS fidelity, or very large dimensions matters more than capturing surrounding HTML.
async function exportPng(target) {
  if (!target || target.offsetWidth === 0 || target.offsetHeight === 0) {
    throw new Error('The chart is not laid out yet.');
  }
  if (document.fonts?.ready) await document.fonts.ready;

  const canvas = await html2canvas(target, {
    scale: 2,
    backgroundColor: '#fff',
    width: target.scrollWidth,
    height: target.scrollHeight,
    windowWidth: target.scrollWidth,
    windowHeight: target.scrollHeight,
    useCORS: true
  });

  return new Promise((resolve, reject) => {
    canvas.toBlob(blob => blob ? resolve(blob) : reject(new Error('PNG encoding failed')), 'image/png');
  });
}
10. Or skip the browser setup
If the chart is available at a public URL, ScreenshotNeo can capture it with one GET request. Cookie banners, newsletter popups, and chat widgets are removed before the shot. Bot checks, blank pages, failed loads, and cache hits are not billed, and the response identifies the result with X-Page-Verdict and X-Billed headers. Its MCP server lets Claude, Cursor, and other MCP clients use take_screenshot, get_page_info, and capture_pdf.
See the ScreenshotNeo API documentation for all options.
cURL
curl -G "https://api.screenshotneo.com/v1/shot" \
  -d access_key=YOUR_API_KEY \
  --data-urlencode url=https://your-site.example/d3-chart \
  -o d3-chart.webp
Python
import requests

r = requests.get(
    "https://api.screenshotneo.com/v1/shot",
    params={
        "access_key": "YOUR_API_KEY",
        "url": "https://your-site.example/d3-chart",
    },
    timeout=90,
)
r.raise_for_status()
open("d3-chart.webp", "wb").write(r.content)
Node.js
const q = new URLSearchParams({
  access_key: 'YOUR_API_KEY',
  url: 'https://your-site.example/d3-chart'
});
const res = await fetch(`https://api.screenshotneo.com/v1/shot?${q}`);
if (!res.ok) throw new Error(`Screenshot failed: ${res.status}`);
const buffer = Buffer.from(await res.arrayBuffer());
await import('node:fs/promises').then(fs => fs.writeFile('d3-chart.webp', buffer));
ScreenshotNeo supports PNG, JPEG, WebP, and PDF output plus custom CSS and JavaScript, device presets or any viewport, retina scale, selector capture, waits for selectors or network idle, custom fonts and headers, caching, async jobs, bulk capture, and signed links. The Free plan includes 1,000 shots per month with no card; paid plans start at $5 for 3,000 shots. Create a free ScreenshotNeo account.
11. Cost and tool choice
html2canvas is a client-side library, so there is no screenshot API request cost, but the browser pays in CPU time and memory. It is a good fit when the chart already exists in the user’s page and the export should happen locally. A hosted capture service is useful for server-side jobs, scheduled reports, many URLs, or environments where installing and maintaining a browser is undesirable.
Choose direct SVG export when the output must remain vector-like or when DOM reconstruction cannot reproduce the required CSS. Choose html2canvas when the PNG should include HTML around the SVG, such as a title, legend, annotations, or card styling. Choose a hosted API when repeatable remote capture, automation, or AI-agent workflows matter.
12. FAQ
Can html2canvas export an SVG as a PNG?
Yes. Pass the SVG or a wrapper containing it to html2canvas(). The SVG must be present in the DOM and its styles and assets must be readable by the browser.
Why does waiting for window.onload sometimes fail?
load does not guarantee that web fonts have finished applying or that D3 transitions and asynchronous image decoding are complete. Wait for the application data, document.fonts.ready, and required image decodes.
Should I use toDataURL() or toBlob()?
Use toBlob() for normal downloads and larger exports. Use toDataURL() when an inline data URL is specifically required.
Can I make the PNG transparent?
Pass backgroundColor: null and ensure the chart and its wrapper do not paint an opaque background. Verify the result in the browsers you support.
Will html2canvas reproduce every CSS effect?
No. It renders the properties it supports from the DOM representation. Filters, pseudo-elements, complex compositing, and browser-specific layout can differ from the live page.


