How to Export an HTML Page and AMCharts Chart to PDF
Export an amCharts chart or an entire HTML report to PDF with runnable JavaScript, print CSS, troubleshooting, and a hosted API option.

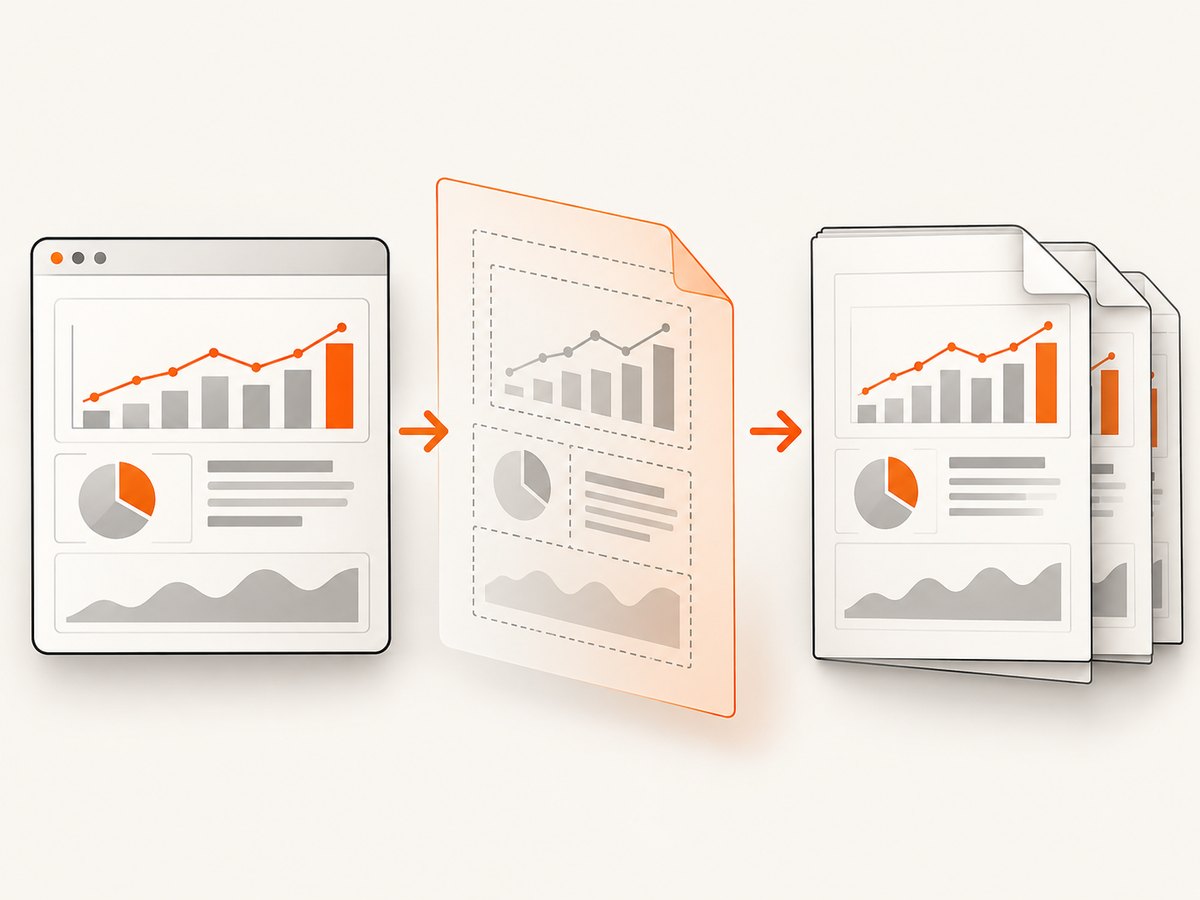
Short answer: use the amCharts Exporting plugin when you need a PDF of the chart (and optionally its data table). Use the browser print workflow when the PDF must include the complete HTML page: headings, explanatory text, tables, navigation choices, and multiple charts. These are different export scopes, so choose the one that matches the document you need.
Choose chart export or whole-page printing
| Requirement | Best approach | Why |
|---|---|---|
| Chart image and/or data table | amCharts Exporting plugin | Produces a PDF document from the chart and supports PDF-specific options. |
| Complete HTML report | Browser print / print-to-PDF | Preserves surrounding HTML and print CSS layout. |
| Server-side, repeatable screenshots or PDFs | ScreenshotNeo | One API request handles browser rendering without maintaining your own automation stack. |
Export an amCharts 5 chart as a PDF
Install or load amCharts 5 and its exporting plugin, create the chart, then configure pdfOptions. The plugin can add the chart image, a data table, a title, and source information to the generated PDF.
Complete browser example
<!doctype html>
<html lang="en">
<head>
  <meta charset="utf-8">
  <title>amCharts 5 PDF export</title>
  <style>
    #chartdiv { width: 100%; height: 500px; }
  </style>
</head>
<body>
  <div id="chartdiv"></div>
  <script src="https://cdn.amcharts.com/lib/5/index.js"></script>
  <script src="https://cdn.amcharts.com/lib/5/xy.js"></script>
  <script src="https://cdn.amcharts.com/lib/5/themes/Animated.js"></script>
  <script src="https://cdn.amcharts.com/lib/5/plugins/exporting.js"></script>
  <script>
    am5.ready(function () {
      const root = am5.Root.new("chartdiv");
      root.setThemes([am5themes_Animated.new(root)]);

      const chart = root.container.children.push(
        am5xy.XYChart.new(root, { panX: true, panY: false, wheelX: "panX" })
      );

      const xAxis = chart.xAxes.push(am5xy.CategoryAxis.new(root, {
        categoryField: "month",
        renderer: am5xy.AxisRendererX.new(root, {})
      }));
      const yAxis = chart.yAxes.push(am5xy.ValueAxis.new(root, {
        renderer: am5xy.AxisRendererY.new(root, {})
      }));

      const data = [
        { month: "Jan", value: 42 },
        { month: "Feb", value: 58 },
        { month: "Mar", value: 71 },
        { month: "Apr", value: 64 }
      ];
      xAxis.data.setAll(data);

      const series = chart.series.push(am5xy.ColumnSeries.new(root, {
        name: "Revenue",
        xAxis,
        yAxis,
        valueYField: "value",
        categoryXField: "month",
        tooltip: am5.Tooltip.new(root, { labelText: "{categoryX}: {valueY}" })
      }));
      series.data.setAll(data);

      am5plugins_exporting.Exporting.new(root, {
        menu: am5plugins_exporting.ExportingMenu.new(root, {}),
        pdfOptions: {
          pageSize: "LETTER",
          pageOrientation: "landscape",
          pageMargins: [20, 20, 20, 40]
        }
      });
    });
  </script>
</body>
</html>
The export menu adds a PDF action. The amCharts 5 PDF defaults are A4, portrait orientation, and 30-point margins; set them explicitly when your output needs a stable layout. Supported page sizes include values such as LETTER and TABLOID.
Useful amCharts 5 API methods
exportPDF()generates a PDF export.exportPDFData()exports chart data for PDF workflows.exportHTML()returns exported HTML that you can insert into a page and style with CSS.getCanvas()gives access to the rendered chart canvas for custom pipelines.
Use the documented download methods for a browser download. Use methods that return raw or encoded output when your application needs to send the result elsewhere.
Export an amCharts 4 chart as a PDF
amCharts 4 uses the chart.exporting API and an ExportMenu. The built-in formats include PDF, JPEG, PNG, XLSX, CSV, JSON, and print.
am4core.ready(function () {
  const chart = am4core.create("chartdiv", am4charts.XYChart);
  chart.data = [
    { month: "Jan", value: 42 },
    { month: "Feb", value: 58 },
    { month: "Mar", value: 71 }
  ];

  const categoryAxis = chart.xAxes.push(new am4charts.CategoryAxis());
  categoryAxis.dataFields.category = "month";
  const valueAxis = chart.yAxes.push(new am4charts.ValueAxis());
  const series = chart.series.push(new am4charts.ColumnSeries());
  series.dataFields.categoryX = "month";
  series.dataFields.valueY = "value";

  chart.exporting.menu = new am4core.ExportMenu();
  // Programmatic export:
  // chart.exporting.export("pdf", { title: "Monthly values" });
});
Print the complete HTML page to PDF
A chart PDF is not automatically a faithful copy of the page around the chart. For a report containing headings, explanatory text, tables, and several chart sections, print the page and control the layout with print CSS.
1. Add print-specific CSS
@page {
  size: A4 portrait;
  margin: 12mm;
}

@media print {
  nav,
  .export-controls,
  button,
  .no-print {
    display: none !important;
  }

  .chart-section {
    break-inside: avoid;
  }

  .chart-section h2 {
    break-after: avoid;
  }

  .page-break-before {
    break-before: page;
  }

  #chartdiv,
  .chart-container {
    height: 140mm !important;
    min-height: 140mm;
  }

  body {
    color: #000;
    background: #fff;
  }
}
2. Trigger the browser print dialog
<button class="export-controls" type="button" onclick="window.print()">
  Save page as PDF
</button>
In the print dialog, select “Save as PDF”. Browser support for @page margins, backgrounds, and page-break behavior varies, so verify the result in the browser used by your readers or automation job.
3. Keep charts from collapsing
Chart libraries often measure their container during layout. A container with no explicit height can become nearly empty in print output. Give every chart a fixed or minimum height under @media print, wait until the chart has rendered, and avoid removing the chart element before printing.
Use the amCharts print patterns
The amCharts print guide describes two patterns. The iframe method creates a chart snapshot in an iframe and prints that isolated document; it is the default pattern. The CSS method hides everything except the chart and prints the current page. If iframe security restrictions prevent the first method, use CSS printing.
Iframe printing considerations
- Ensure the iframe content is same-origin when your security policy requires DOM access.
- Wait for chart rendering and fonts before calling
print(). - Remove temporary iframe nodes after the print operation.
- Provide a CSS fallback for deployments with restrictive iframe or cross-origin policies.
PDF options and layout controls
| Control | Chart PDF | Whole-page print |
|---|---|---|
| Page size | pdfOptions.pageSize |
@page { size: ... } |
| Orientation | pageOrientation |
@page size or print dialog |
| Margins | pageMargins |
@page { margin: ... } |
| Chart image | Included by the exporting plugin | Rendered by the browser |
| Data table | Can be included by export configuration | Must exist in the HTML |
| Headers and explanatory text | Must be added to the PDF document configuration | Printed naturally from the page |
Cross-origin images, fonts, and canvas failures
External images can taint a canvas. When that happens, browser security rules can prevent the canvas from being read for export. Host images with appropriate CORS headers, use same-origin assets where possible, and test fonts and images in the target browser. A chart that looks correct on screen can still fail during PDF or image extraction if a third-party resource is not readable.
Or skip the browser setup
For a hosted render of a complete HTML page, ScreenshotNeo provides a website screenshot API and PDF output. See the ScreenshotNeo API documentation for request options.
curl -G "https://api.screenshotneo.com/v1/shot" -d access_key=YOUR_API_KEY --data-urlencode url=https://your-site.example/report -o report.pdfimport requests
r = requests.get(
"https://api.screenshotneo.com/v1/shot",
params={"access_key": "YOUR_API_KEY", "url": "https://your-site.example/report"},
timeout=90,
)
r.raise_for_status()
open("report.pdf", "wb").write(r.content)const q = new URLSearchParams({
access_key: 'YOUR_API_KEY',
url: 'https://your-site.example/report'
});
const res = await fetch(`https://api.screenshotneo.com/v1/shot?${q}`);
if (!res.ok) throw new Error(`HTTP ${res.status}`);
const pdf = Buffer.from(await res.arrayBuffer());
await import('node:fs/promises').then(fs => fs.writeFile('report.pdf', pdf));ScreenshotNeo accepts options for full-page capture, custom CSS and JavaScript, waiting for a selector or network idle, custom headers and cookies, viewport and device settings, PDF paper size, margins, landscape mode, and page ranges. It can also capture one element by CSS selector, block ads or resource types, and use signed links, asynchronous jobs, webhooks, bulk capture, caching, and a usage API.
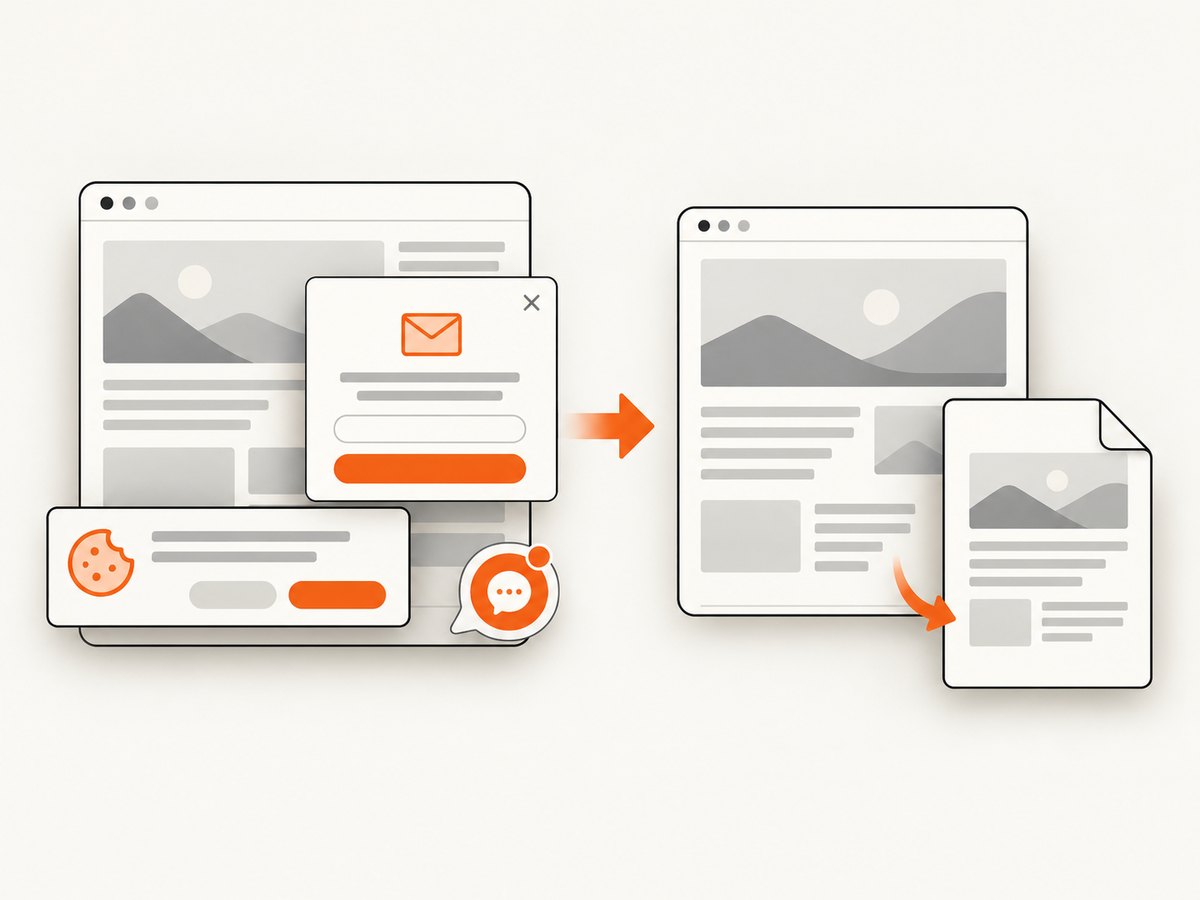
Before capture, it accepts cookie or consent banners and removes more than 60 known consent platforms, newsletter popups, and chat widgets; each step can be turned off. Bot checks or CAPTCHAs, blank pages, timeouts, failed loads, and cache hits cost nothing, and the response reports the result with X-Page-Verdict and X-Billed headers. Its MCP server provides take_screenshot, get_page_info, and capture_pdf tools for Claude, Cursor, and other MCP clients.
The Free plan includes 1,000 screenshots per month with no card. Paid plans start at $5 for 3,000 shots; yearly billing gives two months free, and every feature is available on every plan. Create a free ScreenshotNeo account.
Troubleshooting
The PDF contains only the chart, not the page
Cause: you used the amCharts exporting plugin, whose document is built around the chart image and optional data table.
Fix: call window.print() and add a page-level print stylesheet, or use ScreenshotNeo against the report URL.
The chart is blank or very short in print output
Cause: the chart container has no height during print layout, or printing starts before rendering finishes.
Fix: set an explicit print height, wait for chart data and fonts, then invoke printing.
Export fails with a security or canvas error
Cause: a cross-origin image or font is not available with suitable CORS headers.
Fix: serve the resource from the same origin or configure CORS, then retry the export.
Iframe printing is blocked
Cause: iframe sandboxing, origin differences, or security policy restrictions.
Fix: use the CSS print method, which hides non-chart elements and prints the current page.
Some content appears on the wrong page
Cause: browser pagination does not know which elements belong together.
Fix: apply break-inside: avoid to chart sections, break-after: avoid to headings, and explicit page breaks where a new section must start.
The API response is not a usable PDF
Cause: the target page failed to load, returned a bot challenge, or the response is an error rather than a document.
Fix: check the HTTP status and ScreenshotNeo’s X-Page-Verdict and X-Billed headers; verify the URL is reachable and wait for the report selector or network idle when needed.
Performance, reliability, and cost
- Rendering time: wait for chart data, fonts, and images before export. A selector wait or network-idle wait is more reliable than a fixed short delay when page load time varies.
- Large reports: split very long reports with deliberate page breaks. For many URLs, use asynchronous jobs or bulk capture rather than holding a browser request open.
- Repeatability: set page size, orientation, margins, chart heights, and font loading behavior explicitly. Keep the amCharts version fixed for production documents.
- Cost: self-hosted browser automation consumes your own compute and maintenance time. ScreenshotNeo bills only clean shots; failed loads, blank pages, bot checks, timeouts, and cache hits are not billed.
- Caching: choose a cache TTL when identical pages can be reused. Disable or shorten caching when the report must always reflect fresh data.
Practical checklist
- Decide whether the PDF scope is the chart or the complete HTML page.
- For amCharts 5, load
exporting.jsand configurepdfOptions. - For amCharts 4, configure
chart.exportingand usechart.exporting.export("pdf", options)when needed. - For page printing, hide controls and navigation under
@media print. - Give every chart container an explicit print height.
- Use page-break rules to keep headings and charts together.
- Check cross-origin images and fonts for CORS compatibility.
- Wait for chart data and external assets before printing or capturing.
- Inspect API status and verdict headers when using a hosted capture service.
FAQ
Can amCharts export the surrounding HTML automatically?
No. The exporting plugin focuses on the chart and its exportable data. Use browser printing or a page renderer for surrounding HTML.
Should I use portrait or landscape?
Use landscape for wide XY charts and tables; use portrait for narrow charts and text-heavy reports. Set the choice explicitly so output does not depend on a user’s print dialog.
Can I export only one chart from a page?
Yes. Use the amCharts exporting API for that chart, or target its container with an element capture option in a hosted renderer.
Is a PDF chart still editable?
The chart export can include a data table, but the visual chart is generally a rendered document element rather than an editable chart model. Keep the source data if recipients need to edit it.