Top 12 Financial Charting Libraries for Finance Apps
Compare the strongest financial charting libraries, datafeed requirements, licensing, indicators, streaming, and how to choose for your finance app.
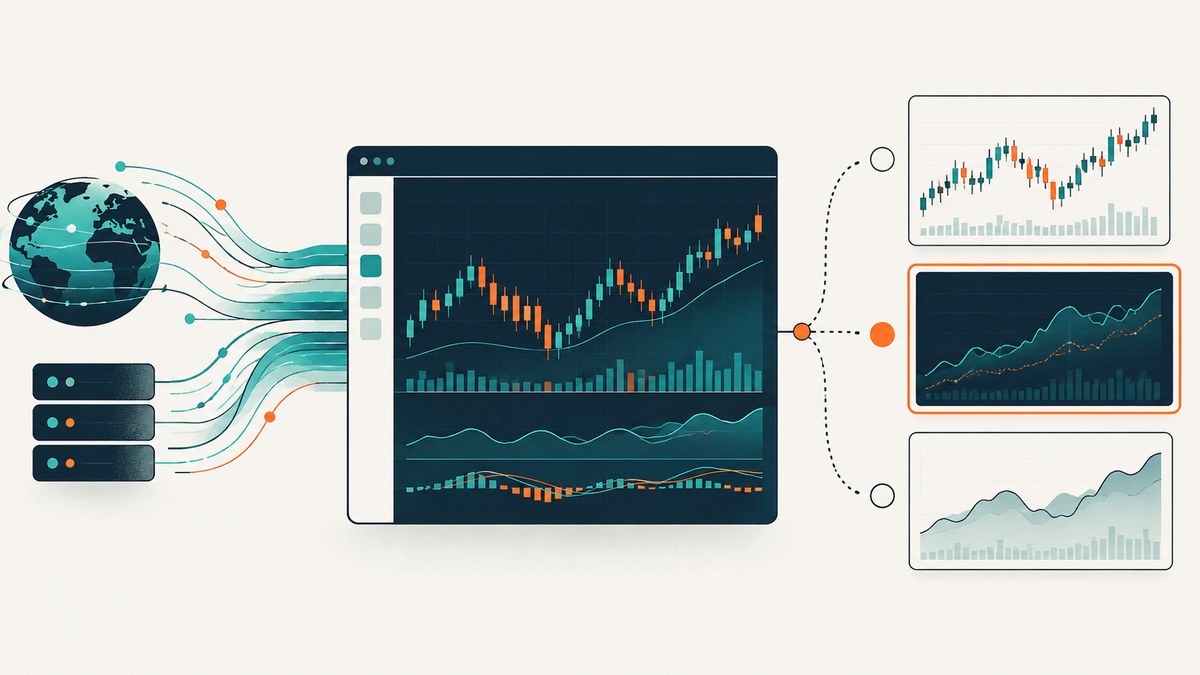
Choosing a financial charting library starts with a distinction that affects every architecture decision: a chart renderer is not a market-data provider. TradingView states that Advanced Charts and Lightweight Charts do not include market data; your application must connect its own feed or a third-party provider and verify data rights for the markets you display. TradingView’s product comparison explains this separation.
This guide is an evidence-based shortlist rather than a definitive market ranking. The supplied primary research supports seven named candidates in detail. The title says “12,” but filling five remaining positions with unverified products would mislead a technical buyer. Use the requirements matrix and validation checklist below to research additional candidates before committing.
Quick answer: which library should you choose?
- Small, customizable, open-source chart: TradingView Lightweight Charts, when your team owns the datafeed, indicators, and surrounding UI.
- Technical-analysis experience: TradingView Advanced Charts, subject to eligibility, attribution, deployment terms, and integration work.
- Chart-based trading: TradingView Trading Platform, when broker connectivity, order management, and routing are part of the product.
- Commercial stock-chart suite: Highcharts Stock, especially when exporting, accessibility, and framework integrations matter.
- AG Grid or AG Charts stack: AG Charts Enterprise Financial Charts, which includes financial controls and annotations.
- General analytical dashboards: Plotly.js, when candlesticks, OHLC, and indicators fit a broader plotting workflow.
- Basic interactive candlesticks: Google Charts, when its documented data format and limited scope meet the requirement.
There is no universal “best” library. Select against the datafeed, interaction, indicator, licensing, and trading requirements you can demonstrate with representative data.
What to evaluate before selecting a library
1. Financial feature depth
List the exact primitives your product needs: line, area, OHLC, candlestick, Heikin-Ashi, volume, multiple panes, crosshairs, drawing tools, alerts, annotations, and technical indicators. A library that renders candlesticks may still require you to implement moving averages, RSI, MACD, studies, or drawing persistence. Lightweight Charts, for example, is documented as not including built-in indicators.
2. Datafeed and rights
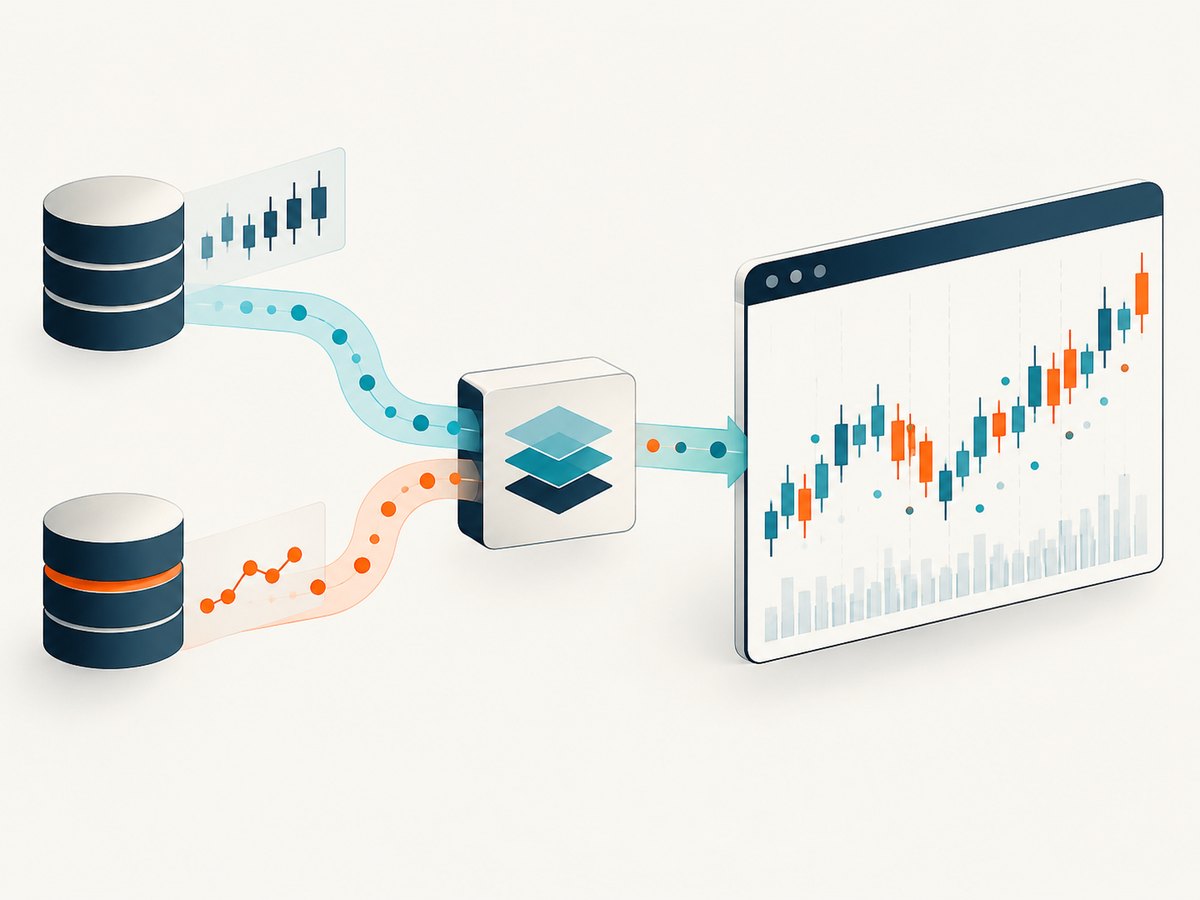
Decide how historical backfill, live updates, symbol changes, and timeframe changes reach the chart. Your adapter may call a REST endpoint for history and a WebSocket for updates, or receive normalized bars from your own service. Confirm redistribution rights, exchange agreements, delayed-versus-real-time rules, and entitlements for every market. The renderer does not remove those obligations.
3. Trading integration
Displaying a price is different from placing an order. If users can trade, map chart symbols to broker instruments, maintain positions and buying power, validate orders server-side, and reconcile fills. TradingView describes Trading Platform as adding trading functionality, but a broker backend, data stream, and order-management integration remain application responsibilities.
4. Interaction and platform support
Test zoom, pan, range selection, touch gestures, keyboard access, responsive layouts, multiple synchronized charts, and your supported browsers. Measure on the phones and low-powered laptops your customers actually use.
5. Customization and maintenance
Check themes, plugins, custom series, event APIs, framework wrappers, TypeScript types, and release cadence. Estimate the work to implement custom indicators and persist drawings. A smaller library can reduce bundle and UI complexity while increasing the amount of product code your team owns.
6. Commercial terms
Licenses, attribution, public-deployment eligibility, enterprise gates, support, and redistribution rights vary and can change. Obtain current terms from each vendor before launch. Do not treat a community package as automatically suitable for a paid or white-label application.
Shortlist: seven candidates supported by primary documentation
1. TradingView Lightweight Charts
Lightweight Charts is an Apache 2.0 open-source library aimed at compact, customizable financial charts. TradingView documents canvas rendering, streaming updates, mobile usability, and extensive customization on its official page. You supply the data and build the surrounding interface. Built-in indicators are not included, so calculate them yourself or add a compatible analytics layer.
It fits a team that wants control over branding and application behavior. Start with a proof of concept that loads the longest historical range you need, then stream updates at the expected rate. Confirm memory usage when several symbols are visible at once.
<div id="chart" style="height:420px"></div>
<script type="module">
  import { createChart } from 'https://unpkg.com/lightweight-charts@latest/dist/lightweight-charts.standalone.production.mjs';

  const chart = createChart(document.getElementById('chart'), {
    layout: { background: { color: '#0b1220' }, textColor: '#d5d9e2' },
    rightPriceScale: { borderColor: '#334155' },
    timeScale: { borderColor: '#334155' }
  });
  const candles = chart.addCandlestickSeries({
    upColor: '#22c55e', downColor: '#ef4444',
    borderVisible: false, wickUpColor: '#22c55e', wickDownColor: '#ef4444'
  });
  candles.setData([
    { time: '2026-01-02', open: 100, high: 108, low: 98, close: 106 },
    { time: '2026-01-03', open: 106, high: 110, low: 103, close: 104 }
  ]);
  window.addEventListener('resize', () => chart.applyOptions({
    width: document.getElementById('chart').clientWidth
  }));
</script>
Pin a tested version in production instead of loading a moving “latest” URL. Normalize timestamps and numeric fields before calling setData; reject malformed bars at your API boundary.
2. TradingView Advanced Charts
Advanced Charts is oriented toward technical analysis and provides a fuller charting experience than a minimal component. TradingView’s introduction describes its positioning and stated access conditions. It is proprietary, hosted by the adopting company, and connected to your datafeed. Verify eligibility, attribution, and deployment terms before designing around it.
3. TradingView Trading Platform
Trading Platform extends the charting workflow with trading-focused capabilities. It is appropriate when users need order entry and position management from the chart. Budget engineering time for broker APIs, order routing, account state, permissions, retries, and reconciliation. The library does not replace those backend systems.
4. Highcharts Stock
Highcharts Stock documents stock and timeline charts, framework integrations, exporting, and accessibility capabilities. It is a commercial option for teams that want a broad charting ecosystem and vendor support. Confirm the license required for your deployment, especially if the application is commercial, embedded, or redistributed.
5. AG Charts Enterprise Financial Charts
AG Charts documents candlestick, OHLC, and line charts along with toolbar controls, zoom and range controls, and annotations in its Financial Charts overview. Financial Charts are an Enterprise feature; review the installation and licensing documentation. This is a natural candidate when your application already uses AG Charts or AG Grid.
6. Plotly.js
Plotly’s financial chart examples cover candlestick, OHLC, and indicators. Plotly works well for exploratory dashboards where financial series sit beside many other visualization types. The reviewed documentation does not establish parity with a specialist trading workstation, so test interaction density, streaming behavior, and drawing requirements directly.
7. Google Charts
Google’s Candlestick Charts documentation defines an interactive candlestick format using low, open, close, and high values. It can suit a straightforward display with limited technical-analysis scope. The documented page does not describe a complete indicator, drawing, or order-entry environment.
How to build a reliable charting architecture
- Define a canonical bar schema. Use an unambiguous timestamp, open, high, low, close, and volume fields. State whether timestamps are UTC and whether bars are adjusted for splits or dividends.
- Separate history from streaming. Fetch history in pages, render it, then subscribe to live updates. Ensure an update replaces the current interval instead of duplicating it.
- Normalize at the boundary. Convert provider-specific symbols, decimals, session calendars, and error formats into your internal schema.
- Handle gaps explicitly. Do not connect lines across market closures unless that is intentional. Mark halts and missing intervals in the UI or metadata.
- Keep calculations deterministic. Run indicators from the same normalized series on the server or client, and define warm-up periods and rounding rules.
- Persist user state. Save symbol, timeframe, studies, colors, drawings, and layout separately from market data so a feed refresh cannot erase user work.
- Instrument the feed. Track request latency, WebSocket reconnects, dropped messages, stale timestamps, parse failures, and chart render time.
Testing checklist for a finance app
| Area | Test cases |
|---|---|
| History | One day, several years, empty result, split-adjusted and unadjusted data |
| Live updates | Reconnect, duplicate tick, out-of-order tick, market halt, provider outage |
| Interaction | Pinch zoom, drag pan, range selection, keyboard navigation, screen reader labels |
| Rendering | One chart, many charts, long symbols, extreme prices, null volume, high-DPI display |
| Trading | Rejected order, partial fill, stale quote, session close, permission change |
| Licensing | Public deployment, paid access, white-label embedding, attribution, export and redistribution |
Performance, reliability, and cost notes
Do not compare vendor size or speed claims as if they were independent benchmarks. The supplied research notes conflicting official size figures for TradingView products, so they should not be used as headline comparisons. Build a reproducible test with your history length, update rate, number of concurrent charts, browsers, and target devices.
For performance, decimate data for wide time ranges, load detailed bars only after zooming, cap simultaneous subscriptions, and move expensive indicator calculations off the main thread when profiling shows UI jank. Batch state changes and avoid rebuilding the entire series for each tick.
For reliability, design around provider errors: exponential reconnect backoff, a visible stale-data state, cached history, idempotent subscriptions, and server-side validation. Record the provider timestamp and your receipt timestamp so operators can distinguish market delay from rendering delay.
Cost includes the library license, market-data entitlements, servers, observability, and engineering time. A free renderer can still be expensive if it requires custom indicators, drawing tools, mobile behavior, or accessibility work. Conversely, an enterprise license may reduce maintenance if its controls match your requirements. Request current quotes and terms before procurement.
Common problems and fixes
Blank chart
Cause: the container has zero height, the data array is empty, or timestamps are invalid. Fix: assign an explicit height, log the normalized payload, validate timestamps, and call the library’s resize method after layout changes.
Bars appear in the wrong order
Cause: mixed time zones, milliseconds passed where seconds are expected, or unsorted data. Fix: normalize to UTC, use the documented unit, sort before rendering, and reject duplicate intervals.
Live candles flicker or duplicate
Cause: every tick is appended as a new bar. Fix: aggregate ticks by interval and replace the current bar until its interval closes.
Indicators disagree with another platform
Cause: different adjustment rules, sessions, warm-up lengths, or rounding. Fix: document the formula and input policy, then compare intermediate values rather than only the final line.
Touch interaction is unusable
Cause: desktop-oriented controls, oversized overlays, or page-level touch handlers stealing gestures. Fix: test on real devices, reserve touch targets, configure passive handlers carefully, and provide alternate range controls.
License uncertainty blocks launch
Cause: community and enterprise terms differ by deployment. Fix: describe your exact app, audience, hosting model, attribution, and redistribution needs to the vendor and retain written confirmation.
Or skip the browser setup
If your immediate need is a screenshot of a chart, dashboard, or finance page for a report, regression test, documentation page, or social preview, ScreenshotNeo provides a single HTTP request instead of maintaining browser automation. Cookie and consent banners, newsletter popups, and chat widgets are removed before the shot. Bot checks, blank pages, failed loads, timeouts, and cache hits are not billed, and response headers identify the page verdict and billing result. Its MCP server gives AI agents tools named take_screenshot, get_page_info, and capture_pdf.
Read the ScreenshotNeo API documentation for all options. This request returns a WebP image:
curl -G "https://api.screenshotneo.com/v1/shot" \
  -d access_key=YOUR_API_KEY \
  --data-urlencode url=https://stripe.com \
  -o shot.webp
import requests
r = requests.get(
"https://api.screenshotneo.com/v1/shot",
params={"access_key": "YOUR_API_KEY", "url": "https://stripe.com"},
timeout=90,
)
r.raise_for_status()
open("shot.webp", "wb").write(r.content)const q = new URLSearchParams({
access_key: 'YOUR_API_KEY',
url: 'https://stripe.com'
});
const res = await fetch(`https://api.screenshotneo.com/v1/shot?${q}`);
if (!res.ok) throw new Error(`Screenshot failed: ${res.status}`);
const image = Buffer.from(await res.arrayBuffer());
require('fs').writeFileSync('shot.webp', image);ScreenshotNeo supports full-page and element captures, dark mode, device presets, retina scale, custom CSS and JavaScript, selector waits, delays, network-idle waits, request blocking, headers, cookies, user agents, authorization, timezone, geolocation, resizing, caching with a chosen TTL, signed links, asynchronous jobs, webhooks, bulk capture for up to 100 URLs, PDF output, HTML/CSS rendering, and a usage API. Every feature is on every plan. The free plan includes 1,000 shots each month with no card; paid plans start at $5 for 3,000 shots.
Create a free ScreenshotNeo account and get 1,000 screenshots a month with no card.
FAQ
Does a charting library include stock prices?
Usually no. TradingView explicitly says its chart products do not include market data. Connect an authorized provider and check distribution rights.
Which library is open source?
TradingView Lightweight Charts is documented as Apache 2.0 licensed. Verify the current license and obligations for your release.
Can I add trading to any candlestick chart?
You can build order-entry around many renderers, but broker connectivity, risk checks, order routing, account state, and reconciliation are separate systems.
Should I choose a library by bundle size?
Use bundle size as one input. Measure history length, update rate, interaction, memory, and startup time on representative devices.
Why are only seven products listed when the title says twelve?
The supplied primary research supports seven candidates at publication quality. Research five additional products and verify their current financial features, licensing, and deployment model before presenting them as comparable entries.


