How to Fix Blurry Chart.js Canvas Screenshots in PhantomJS
Blurry Chart.js screenshots usually come from a low-resolution canvas backing store. Set the chart’s pixel ratio, size its container, and capture after redraw.

A blurry Chart.js screenshot in PhantomJS usually means the canvas was drawn with too few pixels for the size at which it is displayed or captured. The fix is to give the chart a container with stable CSS dimensions, set Chart.js’s devicePixelRatio to the output scale you need, let Chart.js size the canvas, and capture after it has redrawn. PhantomJS’s PNG quality setting changes compression; it cannot restore detail that was never drawn.
For a chart displayed at 800 × 450 CSS pixels and exported at twice that resolution, use a 2× pixel ratio. The canvas backing store should then be about 1600 × 900 pixels. Keep the PhantomJS viewport large enough for the CSS layout, and set a matching clip rectangle if you want a precise output region.
1. Understand why the screenshot is soft
A canvas has two sizes. Its CSS size controls how large it appears in the page. Its backing-store size, set by the canvas’s width and height attributes, controls how many pixels are available to draw. If a chart is drawn into a small backing store and then enlarged for display or capture, the browser interpolates the missing pixels and edges look soft. Chart.js documents that CSS-only sizing can cause a blurry canvas and that the rendered and displayed dimensions are independent. Chart.js responsive chart sizing.
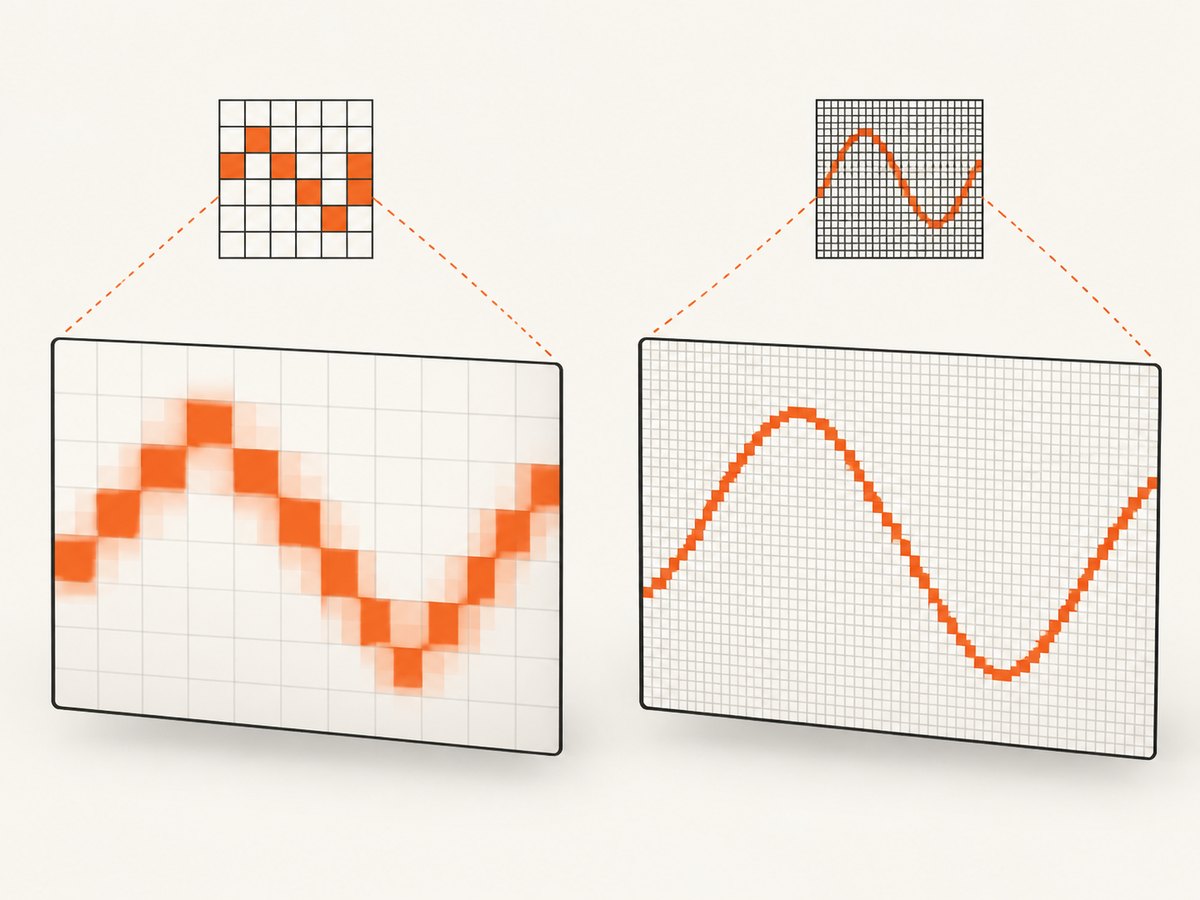
window.devicePixelRatio is the ratio of physical pixels to CSS pixels. Chart.js uses it by default, but a headless environment may not expose the pixel ratio you expect from a desktop Retina display. Check the value inside the page rather than assuming it. MDN’s devicePixelRatio reference.
There are therefore two separate resolutions to check: the chart’s backing store and the screenshot’s capture geometry. Increasing the PhantomJS viewport or clip rectangle alone does not make Chart.js draw more pixels. Increasing the chart’s pixel ratio alone does not correct a clipped or incorrectly sized capture.
2. Give Chart.js a stable container and export pixel ratio
Make the parent element responsible for the chart’s CSS size. Chart.js recommends a dedicated, relatively positioned container for responsive charts. Avoid assigning only CSS width and height directly to the canvas: Chart.js needs to manage its render size as the container changes.
<!doctype html>
<html>
<head>
  <meta charset="utf-8">
  <style>
    #chart-container {
      position: relative;
      width: 800px;
      height: 450px;
    }
  </style>
</head>
<body>
  <div id="chart-container">
    <canvas id="chart"></canvas>
  </div>
  <script src="https://cdn.jsdelivr.net/npm/chart.js"></script>
  <script>
    const ctx = document.getElementById('chart').getContext('2d');
    const chart = new Chart(ctx, {
      type: 'line',
      data: {
        labels: ['Mon', 'Tue', 'Wed', 'Thu', 'Fri'],
        datasets: [{
          label: 'Visits',
          data: [12, 19, 14, 23, 18],
          borderColor: '#2563eb',
          backgroundColor: 'rgba(37, 99, 235, 0.15)',
          fill: true
        }]
      },
      options: {
        responsive: true,
        maintainAspectRatio: false,
        devicePixelRatio: 2,
        animation: false
      }
    });
    window.chartReady = true;
  </script>
</body>
</html>
Chart.js documents that a devicePixelRatio other than 1 scales the canvas relative to the container. The option defaults to the window’s pixel ratio; setting it explicitly makes the export target predictable. Chart.js device pixel ratio options.
In this example, a container of 800 × 450 CSS pixels and ratio 2 should yield a backing store around 1600 × 900 pixels. Confirm the actual dimensions because layout, rounding, and the installed Chart.js version can affect the exact result. A ratio of 2 is an example, not a universal setting. Choose the ratio based on the final image size or print requirements.
Choosing the ratio
| Use case | Starting point | Trade-off |
|---|---|---|
| Screenshot at CSS size | 1 | Smallest output and lower rendering cost; may look soft when enlarged. |
| Sharper image at roughly 2× CSS dimensions | 2 | Four times as many backing pixels as ratio 1. |
| Large print or further zooming | Choose a ratio from the required output pixels | Memory and rendering work rise with pixel area. |
Pixel count grows with the square of the ratio: doubling both dimensions means about four times the pixels. Do not choose an unnecessarily high value, especially for large charts or pages containing several canvases.
3. Capture the chart with PhantomJS
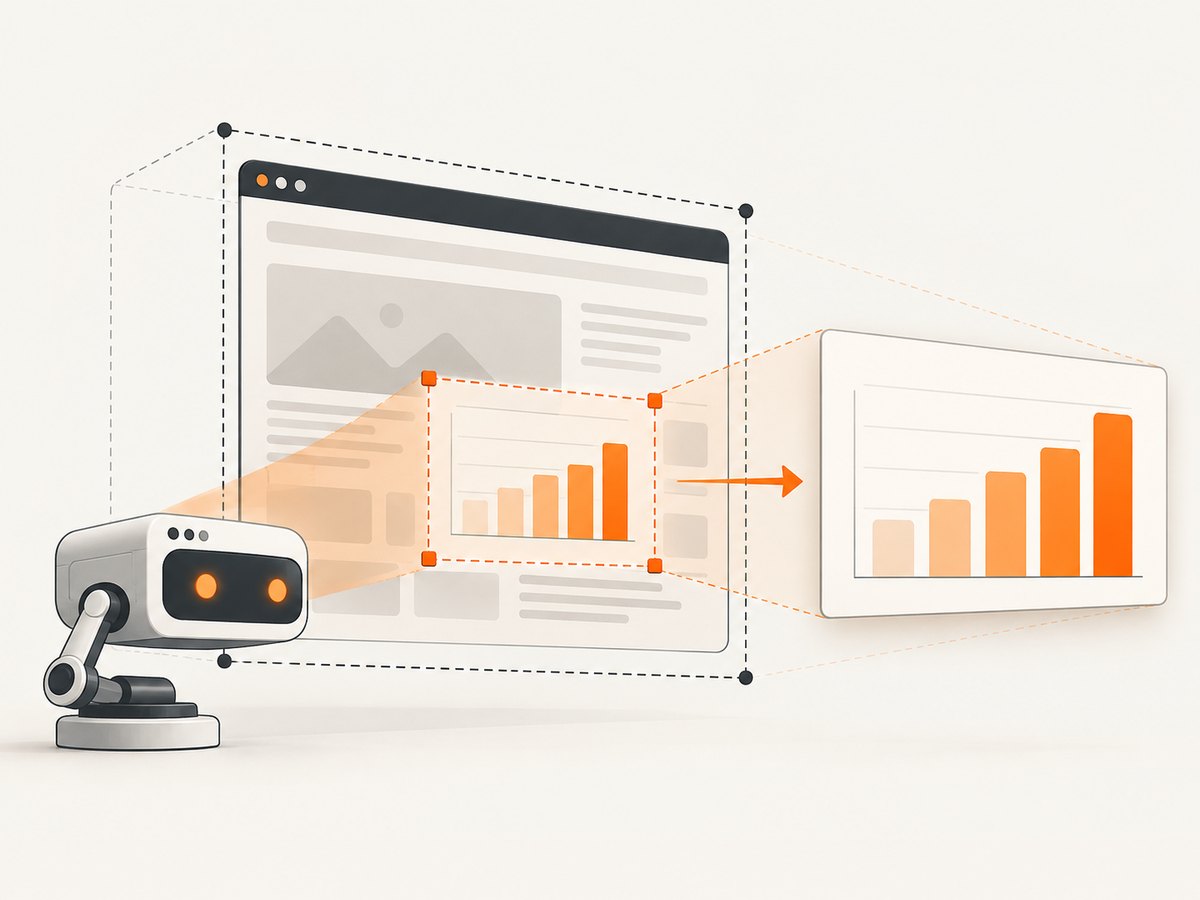
Set the viewport to at least the chart’s intended CSS layout size. Use clipRect to select the output region when the image should be exactly the chart area. PhantomJS documents these properties as page capture controls and supports rendering canvas elements. PhantomJS viewportSize, clipRect, and render().
var page = require('webpage').create();
page.viewportSize = { width: 800, height: 450 };
page.clipRect = { top: 0, left: 0, width: 800, height: 450 };

page.open('http://localhost/chart.html', function (status) {
  if (status !== 'success') {
    console.log('Could not load chart page');
    phantom.exit(1);
    return;
  }

  // For a static chart, disable animation in Chart.js and expose chartReady
  // after creating the chart. The poll avoids capturing before initialization.
  var poll = setInterval(function () {
    page.evaluate(function () {
      return window.chartReady === true;
    });
    var ready = page.evaluate(function () {
      return window.chartReady === true;
    });
    if (!ready) return;

    clearInterval(poll);
    page.render('chart.png', { format: 'png' });
    phantom.exit();
  }, 50);
});
The example polls an application-level readiness flag. Depending on the PhantomJS version, timer behavior and page lifecycle details can vary; for a simple static page, an explicit delay after successful load may be sufficient, but a page-owned ready signal makes the intended condition clear. Avoid rendering while Chart.js is still constructing, resizing, loading data, or animating.
The capture viewport and clip rectangle above are both 800 × 450 CSS pixels, while the canvas’s backing store is expected to be about 1600 × 900 at ratio 2. PhantomJS renders the page at its viewport geometry; do not assume that increasing the canvas backing dimensions automatically changes the page’s CSS layout. If you need a different final bitmap dimension, inspect the generated PNG and adjust the page capture setup to suit the PhantomJS output behavior and desired crop.
4. Verify the canvas before tuning the capture
Inspect CSS dimensions and backing dimensions from inside the page. For the example, clientWidth and clientHeight should be close to 800 and 450, while width and height should be close to 1600 and 900.
var info = page.evaluate(function () {
  var canvas = document.getElementById('chart');
  return {
    dpr: window.devicePixelRatio,
    width: canvas.width,
    height: canvas.height,
    clientWidth: canvas.clientWidth,
    clientHeight: canvas.clientHeight,
    rect: (function () {
      var r = canvas.getBoundingClientRect();
      return { x: r.x, y: r.y, width: r.width, height: r.height };
    })()
  };
});
console.log(JSON.stringify(info));- If the CSS dimensions are zero, the parent had no usable size when Chart.js laid out the chart.
- If the CSS dimensions are right but backing dimensions are not scaled, confirm the chart option was applied and the chart resized after the container was ready.
- If both dimensions are correct but output is cropped, inspect the viewport, the canvas position, and
clipRect. - If output dimensions and chart dimensions are right but lines still appear soft, inspect the original PNG at 100% zoom. A viewer that scales the image can make a sharp file appear blurry.
5. Resize after changing dimensions or pixel ratio
Chart.js reads its configuration and container when it builds and resizes the chart. If your application changes the container size or pixel ratio after construction, trigger a redraw after the new values are in place. The Chart.js API documents chart.resize(width, height) for explicit render dimensions. Chart.js Chart API.
// Update the container first, then request a chart resize.
var container = document.getElementById('chart-container');
container.style.width = '1000px';
container.style.height = '560px';
chart.options.devicePixelRatio = 2;
chart.resize(1000, 560);

// When your application knows the update has completed:
window.chartReady = true;
A maintainer discussion describes calling resize after changing device pixel ratio for a high-resolution image. Treat the sequence as a practical redraw step, not a guarantee that every Chart.js and PhantomJS combination handles dynamic changes identically. If the output remains wrong, log the canvas dimensions after resize, and recreate the chart with the desired final options as a controlled fallback. Chart.js project discussions.
Call resize() only after the target container has its final dimensions. A resize issued while the page is hidden, detached, or still at zero width can preserve an unintended size. If chart data changes asynchronously, signal readiness only after both data and layout have settled.
6. PNG quality does not add canvas detail
PNG is a lossless choice for chart output, particularly for thin lines, labels, and solid-color regions. PhantomJS’s quality option does not sharpen a PNG: the documentation says PNG quality controls Deflate compression and images remain visually identical. If the output looks soft, diagnose the backing-store resolution and capture geometry before changing encoding options. PhantomJS render() options.
JPEG quality affects compression artifacts, not the number of pixels Chart.js drew. For chart lines and text, JPEG can introduce ringing or blockiness around edges. Start with PNG when fidelity matters. Use JPEG only when its smaller file is more useful than those artifacts.
7. Troubleshooting
| Symptom or error | Likely cause | Fix |
|---|---|---|
| Chart is blurry at every zoom level | Backing store is close to CSS size but the result is viewed or used at a larger size. | Set Chart.js devicePixelRatio for the target output, then check canvas.width and canvas.height. |
| Canvas is zero-sized or chart is missing | Container has no dimensions when the chart initializes, or layout has not completed. | Give the parent explicit dimensions, wait for layout, then create or resize the chart. |
| Only part of the chart appears | clipRect is smaller than the chart or positioned incorrectly. |
Log the canvas bounding rectangle and set clip coordinates and dimensions to cover the intended region. |
| Text or lines are cut off | Chart layout, padding, legend, or axis labels extend beyond the chosen crop. | Increase the container or clip rectangle, or tune chart layout and margins before capture. |
| Ratio setting appears ignored | Wrong config nesting, older Chart.js version behavior, or chart was not redrawn after a change. | Put devicePixelRatio inside options; log backing dimensions; call chart.resize() after the final layout. |
| Screenshot catches partial animation | Capture begins before Chart.js finishes drawing. | Set animation: false for export, or make the application signal readiness after its final update. |
| Chart is sharp but full page is clipped | Viewport or clip rectangle covers only the chart’s initial region. | Set viewport dimensions for the page layout and use a deliberate crop for the output region. |
| PNG file is large | High pixel ratio increases pixel count, and PNG preserves detail. | Use the lowest ratio that meets the output need; consider JPEG only when its compression artifacts are acceptable. |
| PhantomJS exits without an image | Navigation failed, or the script exits before render completes. | Check the page.open status, report failures with a nonzero exit code, and exit only after calling render. |
PhantomJS is a legacy headless browser project. Existing environments may depend on it, but differences between its browser engine and current browsers can affect modern page code. If a page fails to load or Chart.js behaves differently there, first isolate whether the failure is a page compatibility issue or a canvas sizing issue; changing the pixel ratio cannot fix unsupported JavaScript or failed network resources.
8. Reliability, performance, and cost considerations
For repeatable captures, make the page deterministic: use fixed container dimensions, disable chart animation, control data readiness, and wait for required fonts and assets if they affect layout. Keep the viewport and crop explicit. Log the chart dimensions alongside capture failures so that a bad screenshot can be diagnosed without guessing.
Higher pixel ratios increase memory use and drawing work approximately with pixel area. A 2× ratio needs around four times as many canvas pixels as 1×; a 3× ratio needs around nine times as many. Huge full-page viewports combined with high-density charts can consume substantial memory. Keep chart dimensions and pixel ratio tied to the actual delivery requirement, and avoid recreating or resizing repeatedly in a capture loop.
PNG encoding can also take longer and produce a larger file as the bitmap grows, although the dossier contains no published timing or benchmark figures for PhantomJS or Chart.js. Measure your own workload and do not infer a performance gain from changing PNG compression quality. For batch jobs, cap concurrency to the memory budget of the rendering process and handle page-load failures as failed captures instead of saving blank output.
The DIY method has no per-capture service charge, but it requires maintaining the page, PhantomJS runtime, and capture code. If a hosted API better fits the job, compare the total engineering and operating cost with the required resolution, output type, and workflow. ScreenshotNeo offers a GET screenshot API and an MCP server; it supports PNG, JPEG, WebP, and PDF. Its clean-shot billing rules and plan prices are described below using the publisher’s product information.
9. Or skip the browser setup
If you want a hosted capture instead of maintaining the PhantomJS script, make one GET request. See the ScreenshotNeo API documentation for usage details.
curl -G "https://api.screenshotneo.com/v1/shot" -d access_key=YOUR_API_KEY --data-urlencode url=https://stripe.com -o shot.webpScreenshotNeo removes cookie banners, newsletter popups, and chat widgets before the shot. Bot checks, blank pages, timeouts, failed loads, and cache hits cost nothing, and response headers say which result occurred. Its MCP server provides take_screenshot, get_page_info, and capture_pdf for Claude, Cursor, and other MCP clients. One thousand screenshots per month are free with no card; paid plans start at $5 for 3,000. Every feature is on every plan. See ScreenshotNeo for product details and sign up for 1,000 free screenshots a month, with no card.
10. Frequently asked questions
Should I set PhantomJS’s device pixel ratio to 2?
Set Chart.js’s options.devicePixelRatio to 2 when you need approximately twice the pixels in each dimension relative to the CSS container. Verify the resulting canvas dimensions in PhantomJS. A ratio of 2 is not required for every output.
Can I set the canvas width and height attributes directly?
You can control a canvas backing store directly in general canvas code, but for a responsive Chart.js chart, let Chart.js manage those dimensions from a sized parent container and its pixel-ratio option. Directly styling only the canvas is the pattern that can leave the render and display sizes mismatched.
Will a larger PhantomJS viewport make the chart sharper?
Not by itself. The viewport controls page layout and capture area. Set a higher chart backing-store resolution as well, then verify both the canvas dimensions and the rendered file.
Does a 2× backing store mean the saved PNG must be exactly twice the CSS size?
The backing dimensions should scale with the ratio, but the saved image dimensions are also governed by the page render and crop setup. Inspect the file’s pixel dimensions rather than assuming viewport, backing store, and output dimensions are interchangeable.


