How to Fix chrome-aws-lambda Lighthouse Runs That Return NO_SCREENSHOTS
Fix Lighthouse NO_SCREENSHOTS errors in AWS Lambda: diagnose tracing, versions, sandbox permissions, memory, variance, and when to move off Lambda.
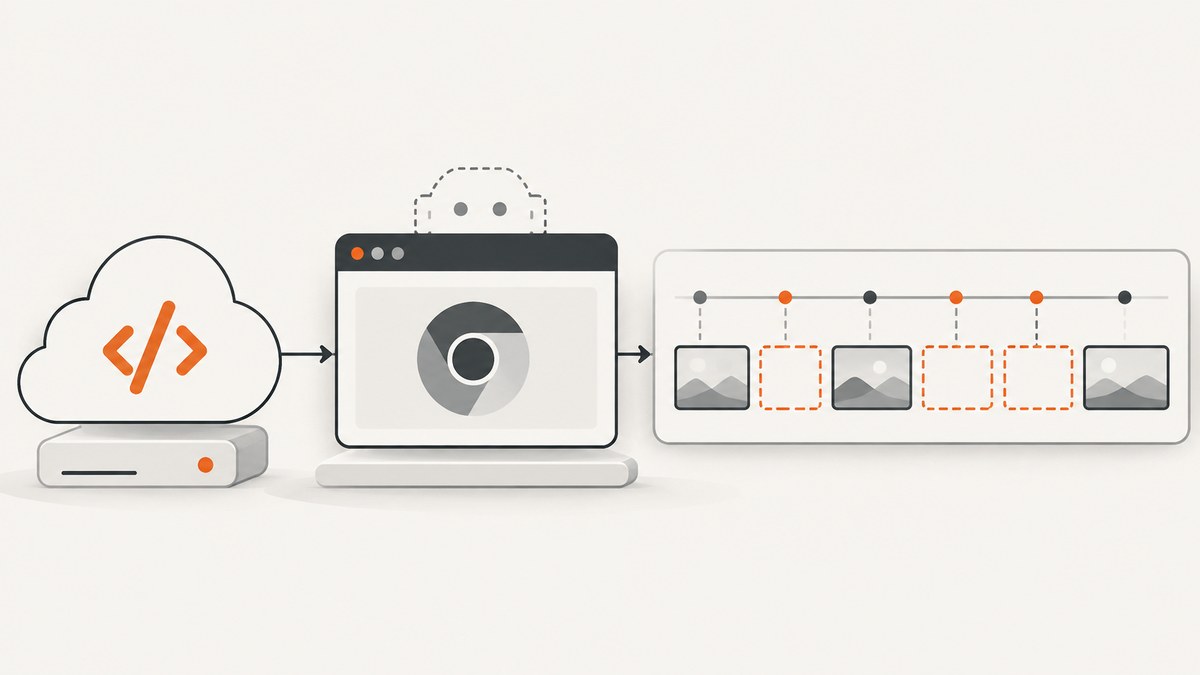
NO_SCREENSHOTS means Lighthouse found no screenshot frames in the navigation trace. It does not prove that the page was blank or too slow. The most reliable fix is to verify that Lighthouse is connected to the Chromium instance you launched, use the complete chrome-aws-lambda launch contract, align Chrome and Lighthouse versions, fix sandbox permissions, and give the function enough memory. If failures remain intermittent, run Lighthouse on a persistent VM, container, or hosted CI worker instead of a Lambda function.
What NO_SCREENSHOTS means
Lighthouse uses trace screenshots to calculate visual metrics such as Speed Index. A NO_SCREENSHOTS error occurs when the trace contains no screenshot frames during a normal navigation run. A fast page can still produce this error when tracing is attached to the wrong browser, Chrome exits early, the protocol versions are incompatible, or the runtime cannot start the required renderer.
Start by preserving the complete Lighthouse and Chrome logs. Do not treat the error as a page-speed diagnosis until the browser connection and trace are known to be valid.
Run a known-good Lambda baseline
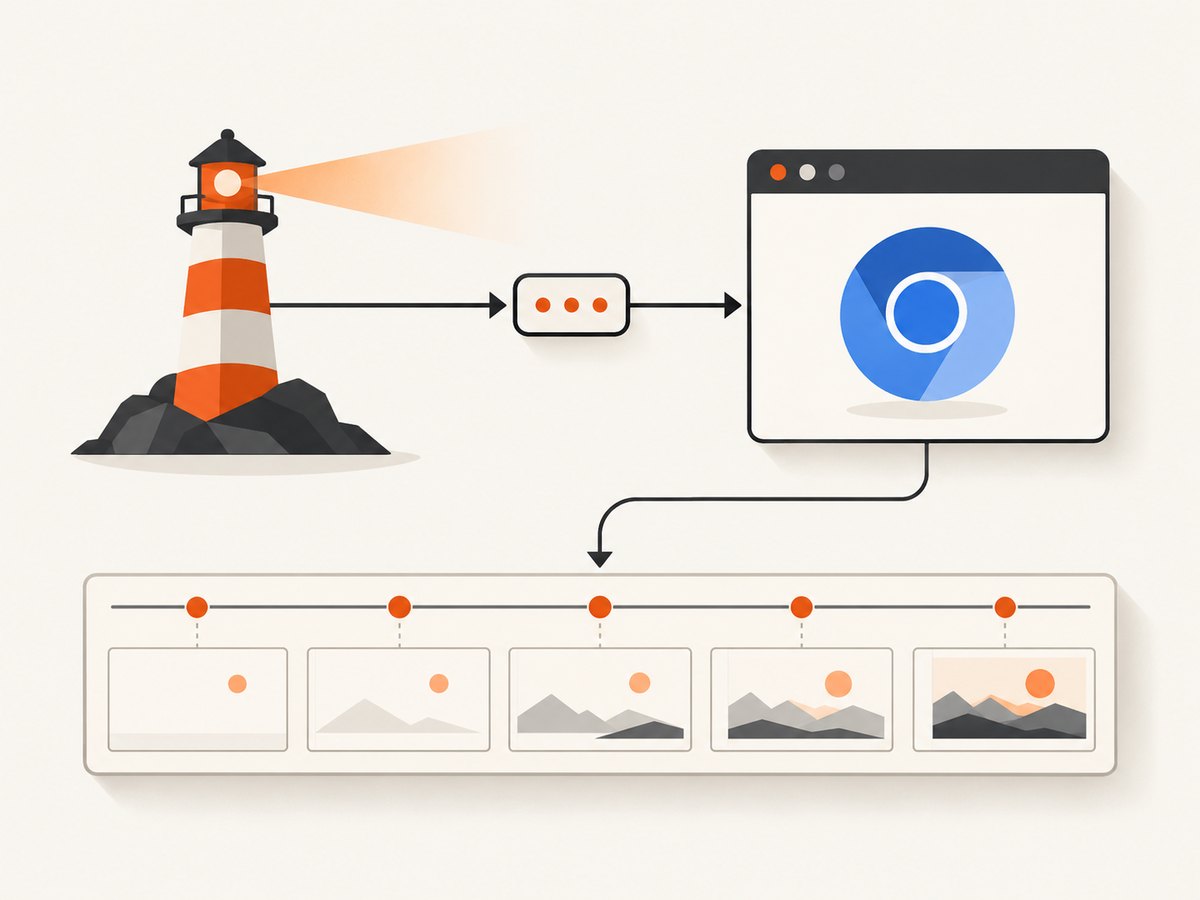
The following Node.js handler follows the launch settings documented by the chrome-aws-lambda README. It launches one browser, extracts its debugging port, points Lighthouse at that exact instance, and always closes the process.
const chromium = require('chrome-aws-lambda');
const lighthouse = require('lighthouse');

exports.handler = async () => {
  let browser;

  try {
    browser = await chromium.puppeteer.launch({
      args: chromium.args,
      defaultViewport: chromium.defaultViewport,
      executablePath: await chromium.executablePath,
      headless: chromium.headless,
      ignoreHTTPSErrors: true
    });

    const endpoint = new URL(browser.wsEndpoint());
    const port = Number(endpoint.port);
    if (!port) throw new Error('Chromium did not expose a debugging port');

    const result = await lighthouse(
      'https://developer.mozilla.org/',
      {
        port,
        output: 'json',
        logLevel: 'info'
      }
    );

    return {
      statusCode: 200,
      headers: { 'content-type': 'application/json' },
      body: result.report
    };
  } finally {
    if (browser) await browser.close();
  }
};
Deploy the same package versions together. A minimal dependency set is:
npm install chrome-aws-lambda lighthouseKeep the target URL fixed while diagnosing. Remove authentication, random test data, A/B flags, and unnecessary third-party requests until a baseline run succeeds.
Diagnostic order
1. Confirm that Lighthouse uses the launched browser
Start exactly one Chromium process and obtain its debugging port from browser.wsEndpoint(). Passing a stale, hard-coded, or different port can let Lighthouse collect partial audits while missing the trace frames it needs. Log the endpoint, resolved executable path, Chrome version, Lighthouse version, and the full error output.
console.log({
  chromePath: await chromium.executablePath,
  chromeVersion: await browser.version(),
  lighthouseVersion: require('lighthouse/package.json').version,
  endpoint: browser.wsEndpoint()
});
Do not launch a second browser for Lighthouse. The browser that creates the page must be the browser whose debugging port is supplied to Lighthouse.
2. Use the complete chrome-aws-lambda launch contract
Include args, defaultViewport, executablePath, headless, and (when required by your site) ignoreHTTPSErrors. Omitting one of these values can produce an unusable launch in Lambda. Always close the browser in a finally block so crashed invocations do not leave stale processes behind.
3. Align Chrome, Puppeteer, and Lighthouse versions
Lighthouse communicates with Chrome through the DevTools protocol. Chrome and Lighthouse releases that expect different protocol behavior can fail with protocol errors or silently miss trace data. Pin compatible versions in package-lock.json, update the browser bundle and Lighthouse together, and reproduce with a clean install.
rm -rf node_modules package-lock.json
npm install chrome-aws-lambda@<tested-version> lighthouse@<compatible-version>
npm ls chrome-aws-lambda lighthouse puppeteer
The Lighthouse CI documentation calls out Chrome/Puppeteer compatibility as a common source of protocol failures.
4. Check sandbox and container permissions
“No usable sandbox” indicates that Chrome cannot create its required sandbox in the runtime. Prefer granting the container or execution role the documented permissions and using a Chrome user group. Use --no-sandbox only when the deployment environment requires it; disabling the sandbox reduces isolation.
For container-based Lambda images, verify the required kernel capabilities and filesystem permissions before changing browser flags. A flag that hides the original permission problem can create a less secure, still unreliable run.
5. Allocate sufficient memory and temporary storage
The chrome-aws-lambda maintainers state that Lambda should have at least 512 MB of RAM, with 1600 MB or more recommended. Treat that as a starting point, not a guarantee. Large pages, PDFs, many concurrent tabs, and trace recording need additional CPU, memory, and writable temporary space.
- Increase memory in steps and record whether the error rate changes.
- Keep one Lighthouse browser per invocation while debugging.
- Close pages and browsers on every success and failure path.
- Watch duration, timeout, out-of-memory, and process-exit logs together.
6. Stabilize the measurement
Lambda hardware, cold starts, network timing, third-party scripts, and page experiments vary between invocations. Remove random timers and A/B behavior, use the same device and throttling settings, keep authentication and geography consistent, and block unstable third-party resources only when that matches your measurement goal.
Lighthouse CI runs measurements three times by default. Repeat the same URL several times and compare whether the failure is random or deterministic. A single successful run does not establish reliability.
A repeatable debugging checklist
- Run the handler against a simple, stable page.
- Log Chrome, Lighthouse, Puppeteer, endpoint, memory, duration, and exit status.
- Confirm the Lighthouse port came from the launched browser’s WebSocket endpoint.
- Verify the executable exists and is executable in the deployed artifact.
- Check for sandbox, shared-memory, and temporary-directory errors.
- Increase memory to the recommended range and retry.
- Pin and update Chrome/Puppeteer/Lighthouse as a compatible set.
- Run three or more measurements and compare the traces.
- Move the workload to a persistent worker if failures remain intermittent.
Common errors, causes, and fixes
| Error or symptom | Likely cause | Fix |
|---|---|---|
NO_SCREENSHOTS on a fast page |
Wrong debugging port, tracing not attached, or Chrome exited before frames were recorded | Use the port from browser.wsEndpoint(); preserve logs; ensure the browser stays open until Lighthouse completes |
| Protocol error or “Target closed” | Chrome and Lighthouse/Puppeteer protocol mismatch, crash, or memory pressure | Pin compatible versions, increase memory, and inspect Chrome stderr |
| “No usable sandbox” | Missing container privileges or an unsupported sandbox setup | Configure the documented sandbox permissions; use --no-sandbox only when required by the runtime |
| Executable path is empty or missing | Chromium was not packaged or the runtime architecture does not match | Verify the deployment artifact, architecture, and await chromium.executablePath result |
| Timeout before the report is written | Cold start, heavy page, insufficient CPU/memory, or an overly short Lambda timeout | Raise the function timeout and memory, reduce page variance, and close unused tabs |
| Only some invocations fail | Lambda hardware and cold-start variance, unstable resources, or renderer crashes | Repeat measurements, reduce third-party variance, and use a stable worker for production runs |
| Page loads but visual audits are absent | Partial connection or trace collection failure | Validate the browser/port pair and inspect the raw trace before interpreting audit scores |
When Lambda is the wrong execution environment
The Lighthouse issue tracker describes this failure as rare and random across Lambda instances, and project guidance discourages function-as-a-service infrastructure for some Lighthouse workloads. If the same pinned build still produces intermittent missing frames after the checks above, use a dedicated VM, a long-lived container, or a hosted CI worker.
| Factor | Lambda | Dedicated worker or container |
|---|---|---|
| Screenshot reliability | Can vary between cold and warm instances | Stable browser process and hardware |
| Browser control | Packaging and runtime constraints | Pin the exact OS, Chrome, and dependencies |
| Sandbox permissions | Restricted by the managed runtime | Configure capabilities directly |
| Cold starts | Possible on every new environment | Keep workers warm when needed |
| Concurrency | Separate ephemeral environments | Explicit queueing and isolation |
| Geography | Choose an available function region | Place workers near the users or origin being measured |
| Cost model | Pay per invocation and allocated resources | Pay for reserved or continuously running capacity |
Choose based on required repeatability, not just the lowest per-invocation price. Lighthouse CI recommends reliable hardware, repeated runs, and consistent settings for comparable measurements.
Performance, reliability, and cost practices
- Performance: Reuse nothing across unrelated tests until correctness is established. A single browser per invocation simplifies tracing; a controlled pool on a persistent worker can reduce launch overhead later.
- Reliability: Record raw reports and traces, retry only transient infrastructure failures, and mark a run inconclusive when no screenshot frames exist. Do not convert a missing trace into a zero performance score.
- Cost: Larger memory settings increase Lambda’s resource cost, but repeated failed measurements also cost engineering time. Measure the failure rate at each memory and concurrency level before optimizing spend.
- Consistency: Fix viewport, throttling, user agent, authentication, timezone, geography, and test URL. Changes to any of these can change the score even when screenshot capture works.
Or skip the browser setup
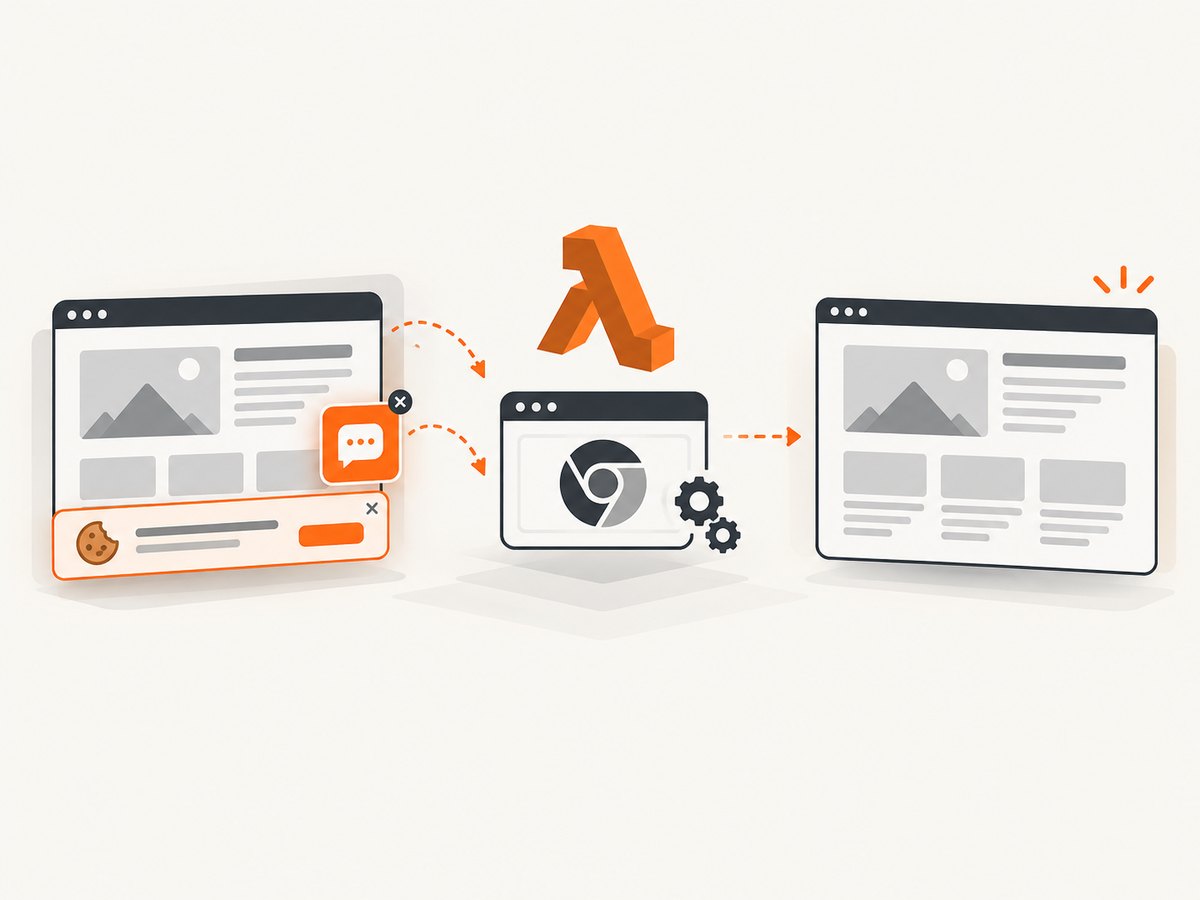
ScreenshotNeo provides a website screenshot API and MCP server. One GET request returns PNG, JPEG, WebP, or PDF. Before capture it accepts cookie and consent banners and removes more than 60 known consent platforms, newsletter popups, and chat widgets; each step can be turned off. Bot checks, blank pages, timeouts, failed loads, and cache hits are not billed, and the response reports the page verdict and billing status in X-Page-Verdict and X-Billed headers.
See the ScreenshotNeo API documentation for all options. A basic call is:
curl -G "https://api.screenshotneo.com/v1/shot" -d access_key=YOUR_API_KEY --data-urlencode url=https://stripe.com -o shot.webpimport requests
r = requests.get(
"https://api.screenshotneo.com/v1/shot",
params={"access_key": "YOUR_API_KEY", "url": "https://stripe.com"},
timeout=90,
)
open("shot.webp", "wb").write(r.content)const q = new URLSearchParams({ access_key: 'YOUR_API_KEY', url: 'https://stripe.com' });
const res = await fetch(`https://api.screenshotneo.com/v1/shot?${q}`);ScreenshotNeo also supports full-page and element captures, dark mode, device presets and custom viewports, retina scale, PDF paper and page settings, HTML/CSS rendering, custom CSS and JavaScript, clicks, waits, request blocking, headers, cookies, user agents, authorization, timezone, geolocation, transparent backgrounds, resizing, configurable caching, signed links, asynchronous jobs with signed webhooks, bulk capture of up to 100 URLs, usage reporting, and an OpenAPI specification. Its MCP server exposes take_screenshot, get_page_info, and capture_pdf to Claude, Cursor, and other MCP clients.
There is a free tier of 1,000 screenshots per month with no card. Paid plans start at $5 for 3,000 screenshots, and every feature is available on every plan. Create a free ScreenshotNeo account.
FAQ
Does NO_SCREENSHOTS mean the page had no visible content?
No. It means Lighthouse found no screenshot frames in its trace. The page may have rendered; the trace or browser connection failed.
Will increasing Lambda memory always fix it?
No. Memory can prevent renderer crashes and timeouts, but port mismatches, incompatible versions, sandbox failures, and Lambda variance can still cause the error.
How many retries should I use?
Run several measurements to identify variance, but do not hide a persistent infrastructure failure with unlimited retries. Record inconclusive runs separately from valid scores.
Should I add --no-sandbox?
Only when the deployment environment cannot provide the required sandbox permissions. Prefer configuring the documented permissions because disabling the sandbox reduces isolation.
When should I leave Lambda?
After the launch contract, versions, permissions, resources, and measurement variance are controlled, move to a persistent VM, container, or CI worker if screenshot capture remains intermittent.


