How to Fix Lag in ChromiumWebBrowser with C#
Diagnose ChromiumWebBrowser lag in C# by separating rendering, WPF layout, JavaScript, loading, and shutdown problems.
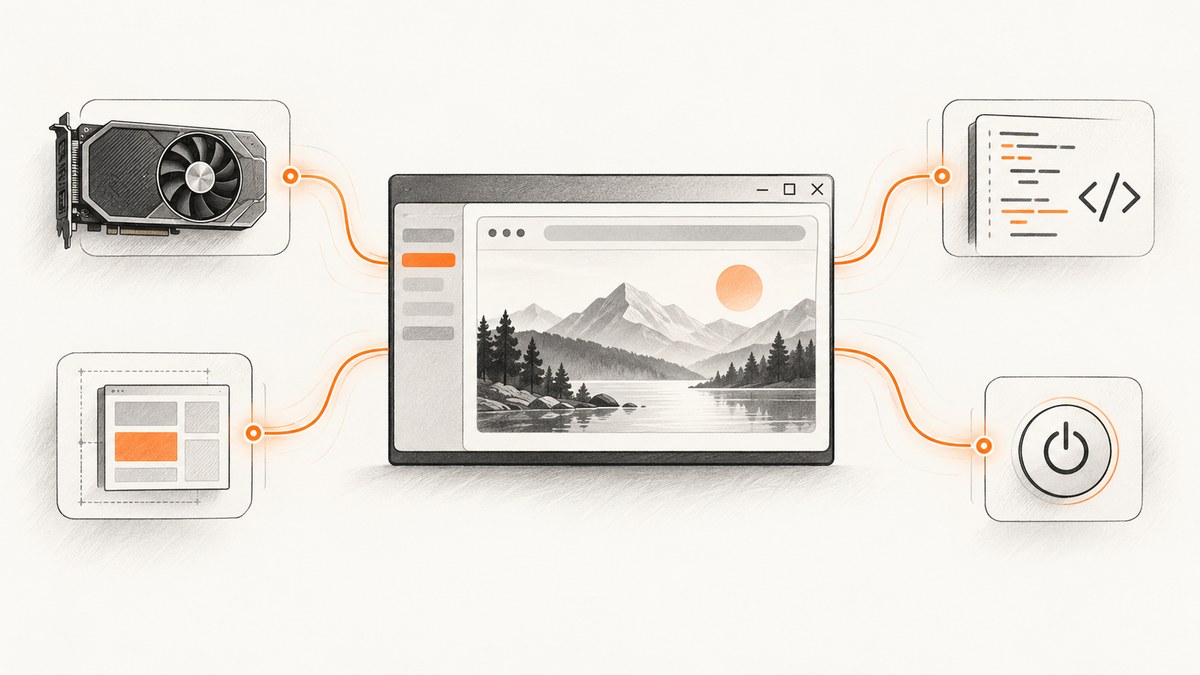
Lag in ChromiumWebBrowser does not have one universal fix. First identify whether the delay is page loading, JavaScript interaction, drawing and scrolling, or a freeze during shutdown. CefSharp documents separate diagnostics for graphics, WPF rendering, DevTools investigation, and application lifecycle problems.
This guide gives a repeatable C# diagnostic process, reversible configuration tests, WPF-specific fixes, runnable examples, and a troubleshooting checklist. The linked CefSharp documentation is mutable, so verify APIs and runtime requirements against the release branch used by your application.
1. Classify the lag before changing settings
| Symptom | Likely area | First check |
|---|---|---|
| Navigation takes too long | Network, page resources, redirects, or the page itself | Reproduce with a fixed URL and inspect DevTools |
| Clicks or typing respond slowly | JavaScript, renderer work, or a blocked main thread | Open Chromium DevTools and inspect the page while the delay occurs |
| Scrolling or animations look choppy | GPU, driver, compositor, or WPF composition | Inspect chrome://gpu/ and test GPU switches one at a time |
| Only WPF is slow | Off-screen rendering and WPF layout | Remove a surrounding ViewBox and compare |
| The application hangs while exiting | CEF lifecycle and shutdown threading | Review initialization and shutdown rules instead of changing graphics settings |
Record the CefSharp version, WPF/WinForms/OffScreen flavor, Windows and GPU driver context, URL or workload, exact action that feels slow, and whether another machine reproduces it. Use the same page and interaction for every comparison.

2. Test GPU acceleration and VSync
CefSharp says GPU acceleration is enabled by default. Its graphics troubleshooting guidance recommends temporarily disabling GPU acceleration and GPU VSync when rendering is slow or quirky, then confirming the arguments in chrome://version and the resulting status in chrome://gpu/.CefSharp troubleshooting guide
Run one change at a time. Compare the same page, scroll path, animation, and window size before deciding whether to retain a switch. Disabling GPU is a diagnostic test, not a guaranteed performance improvement.
Minimal C# configuration test
using CefSharp;

var settings = new CefSettings();
settings.CefCommandLineArgs.Add("disable-gpu");
settings.CefCommandLineArgs.Add("disable-gpu-vsync");

if (!Cef.Initialize(settings))
{
    throw new InvalidOperationException("CEF initialization failed.");
}

// Create your ChromiumWebBrowser controls only after Cef.Initialize(settings).
After starting the application, open chrome://version in the embedded browser and verify that the command-line switches are present. Then inspect chrome://gpu/. If the disabled-GPU run is worse, remove the switch and test only disable-gpu-vsync; if it is still worse, restore the default configuration.
What this test can and cannot tell you
- An improvement with GPU disabled points toward a graphics driver, GPU, compositor, or hardware-specific interaction.
- No change suggests that the bottleneck may be page JavaScript, network work, WPF layout, or another subsystem.
- A result that changes between machines is useful evidence. Compare another machine or graphics card when available.
- Do not turn a qualitative troubleshooting recommendation into a benchmark or assume it applies to every CefSharp version.
3. Remove WPF layout overhead
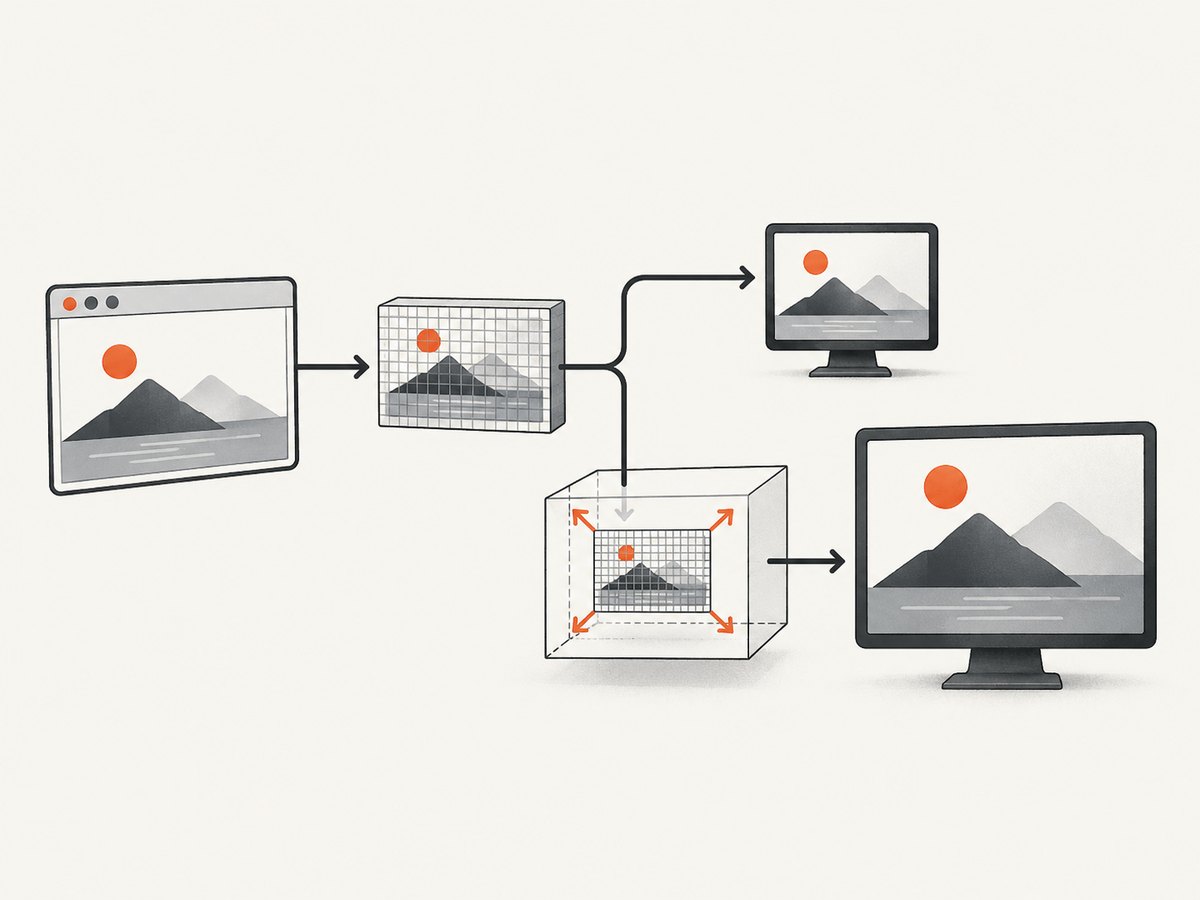
CefSharp’s WPF and OffScreen controls use off-screen rendering: Chromium renders a frame to a buffer, which WPF draws on screen or OffScreen exposes as a bitmap. The CefSharp documentation states that WPF performance is slower than the WinForms version and warns that placing the browser in a WPF ViewBox renders frames and then resizes and scales them, creating a “huge performance hit.”CefSharp general usage guide
Before: a scaling ViewBox
<ViewBox Stretch="Uniform">
    <cef:ChromiumWebBrowser Address="https://example.com" />
</ViewBox>
After: give the browser its real layout size
<Grid>
    <cef:ChromiumWebBrowser Address="https://example.com" />
</Grid>
Compare the two layouts at the same window dimensions. If you need the page content to appear larger or smaller, use the browser’s ZoomLevel instead of scaling the entire rendered frame through a ViewBox. The exact property access depends on your CefSharp control and version; check the API documentation for that release.
4. Investigate page-side JavaScript with DevTools
If navigation completes but clicks, typing, scrolling, or animations lag, inspect the page rather than changing GPU flags blindly. CefSharp exposes Chromium DevTools through ShowDevTools() after initialization and recommends DevTools for JavaScript debugging and memory investigation.CefSharp troubleshooting guide
using CefSharp.Wpf;

public partial class MainWindow : Window
{
    private readonly ChromiumWebBrowser browser;

    public MainWindow()
    {
        InitializeComponent();

        browser = new ChromiumWebBrowser("https://example.com");
        Content = browser;
    }

    private void OpenDevTools_Click(object sender, RoutedEventArgs e)
    {
        if (browser.IsBrowserInitialized)
        {
            browser.ShowDevTools();
        }
    }
}
When the symptom is present, look for long-running script tasks, repeated layout or style recalculation, large allocations, and pages that continue work after navigation. A slow embedded page can involve Chromium renderer processes, a GPU process, or the network service process; the process model tells you where to investigate, not which component is at fault.CefSharp general usage guide
5. Check loading separately from rendering
Measure navigation independently from drawing. Attach timing around your navigation request and the browser’s loading events, then record when the first useful content appears and when the page becomes interactive. A page can finish network navigation while scripts continue expensive work, or it can look frozen because a resource, redirect, or script is still pending.
browser.LoadingStateChanged += (sender, args) =>
{
    if (!args.IsLoading)
    {
        Debug.WriteLine($"Finished loading: {browser.Address}");
    }
};

browser.LoadError += (sender, args) =>
{
    Debug.WriteLine($"Load error {args.ErrorCode}: {args.ErrorText}");
};
Use a consistent test URL and avoid comparing a cold first load with a warm cached load. Record whether the delay is reproducible after a fresh process start.
6. Separate shutdown freezes from interactive lag
If the application is responsive until exit, investigate lifecycle rules. CefSharp warns against calling explicit Cef.Shutdown() on a background thread; shutdown must occur on the main application thread. CEF can be initialized and shut down only once per process.CefSharp troubleshooting guide CefSharp general usage guide
- Initialize CEF once, before creating browser controls.
- Dispose browser controls during application shutdown.
- Do not call
Cef.Shutdown()from a worker thread. - Do not initialize and shut down CEF repeatedly for each window or navigation.
- Confirm that your application framework invokes shutdown on its main UI thread.
7. A repeatable diagnostic sequence
- Write down the CefSharp version, control flavor, OS, GPU and driver, URL, and exact lag symptom.
- Reproduce with one fixed page and one fixed action.
- Classify the symptom as loading, JavaScript/interaction, drawing, or shutdown.
- For drawing problems, inspect
chrome://gpu/and verify switches inchrome://version. - Test
disable-gpuanddisable-gpu-vsyncseparately. - For WPF, remove a
ViewBoxand compare direct layout; useZoomLevelfor page scaling. - Open DevTools after initialization and inspect scripts and memory when page activity correlates with the lag.
- If only exit hangs, audit initialization and shutdown threading.
- Repeat the same test on another machine or graphics card when possible.
- Report the result with the version, control flavor, workload, tested change, and before/after observation.
8. Troubleshooting table
| Problem | Cause to investigate | Fix or next step |
|---|---|---|
| GPU switch appears ineffective | The argument was not applied, or the test is measuring a different bottleneck | Confirm it in chrome://version; inspect chrome://gpu/; change one switch at a time |
| WPF scrolling is much slower than WinForms | WPF off-screen rendering and layout overhead | Remove unnecessary scaling containers such as ViewBox; compare the WinForms flavor if practical |
| Everything is slow only on one computer | GPU, driver, or machine-specific graphics behavior | Compare another machine or graphics card; capture the GPU diagnostics |
| Clicks lag but the page displays correctly | Expensive JavaScript or memory pressure in the renderer | Open DevTools, inspect script activity and memory during the interaction |
| Navigation never becomes usable | Network resources, redirects, page scripts, or a load error | Log loading events, inspect DevTools, and handle LoadError |
| Application freezes during exit | CEF shutdown called from the wrong thread or repeated lifecycle calls | Shut down on the main application thread and initialize/shut down CEF once |
| Runtime or package incompatibility after an upgrade | CefSharp version requirements changed | Check the FAQ and release branch for your package; the FAQ lists version-specific Visual C++ and .NET requirements |
For example, the CefSharp FAQ says CefSharp 138.0.170 and newer listed non-.NET-Core packages use Visual C++ 2022 and .NET Framework 4.6.2 or higher. Treat this as deployment compatibility information, not as a performance fix.CefSharp FAQ
9. Performance, reliability, and cost considerations
Performance
- Use the smallest reproducible page and interaction when comparing settings.
- Keep browser layout at its display size instead of repeatedly scaling rendered frames.
- Separate cold navigation, cached navigation, script execution, and frame drawing in your measurements.
- Use DevTools to find page work before changing host configuration.
Reliability
- Keep GPU changes as explicit, reversible configuration switches so they can be rolled back per machine.
- Record diagnostics from
chrome://versionandchrome://gpu/with bug reports. - Pin or verify the CefSharp release branch and its runtime prerequisites during deployment.
- Keep CEF lifecycle calls centralized and on the required thread.
Cost
These remedies use application configuration and diagnostics. The cited material does not establish a hardware purchase recommendation or a universal benchmark, so choose hardware changes only after a comparison demonstrates a machine-specific graphics issue.
10. Or skip the browser setup
If your goal is to obtain a clean website image rather than embed Chromium in a desktop application, ScreenshotNeo provides a GET screenshot API and MCP server. Cookie and consent banners are accepted and removed before the shot, along with more than 60 known consent platforms, newsletter popups, and chat widgets. Bot checks, blank pages, failed loads, timeouts, and cache hits are not billed, and response headers report the page verdict and billing result.
See the ScreenshotNeo API documentation for the available options.
cURL
curl -G "https://api.screenshotneo.com/v1/shot" -d access_key=YOUR_API_KEY --data-urlencode url=https://example.com -o shot.webpPython
import requests
r = requests.get("https://api.screenshotneo.com/v1/shot", params={"access_key": "YOUR_API_KEY", "url": "https://example.com"}, timeout=90)
open("shot.webp", "wb").write(r.content)
Node.js
const q = new URLSearchParams({ access_key: 'YOUR_API_KEY', url: 'https://example.com' }); const res = await fetch(`https://api.screenshotneo.com/v1/shot?${q}`);ScreenshotNeo also supports full-page captures, element selectors, device presets and custom viewports, retina scale, dark mode, PDF output, HTML/CSS rendering, custom CSS and JavaScript, clicks, wait conditions, blocked resources, headers, cookies, user agents, authorization, timezone, geolocation, transparent backgrounds, resizing, TTL caching, signed links, asynchronous webhooks, bulk capture, usage reporting, and an OpenAPI specification. Its MCP server includes take_screenshot, get_page_info, and capture_pdf for Claude, Cursor, and other MCP clients.
There are 1,000 free screenshots per month with no card. Paid plans start at $5 for 3,000 screenshots; every feature is available on every plan, and yearly billing gives two months free. Create a free ScreenshotNeo account.
FAQ
Should I always disable GPU acceleration?
No. CefSharp recommends GPU and VSync switches as reversible troubleshooting tests because graphics hardware and drivers can behave differently. Keep a switch only when the reproduced symptom improves.
Is WPF always slower than WinForms?
CefSharp documents WPF as slower and calls out additional cost from off-screen rendering and scaling containers. Your result still depends on the page, layout, machine, and version, so compare the same workload.
Can DevTools prove that CefSharp is the cause?
DevTools can show page-side script and memory activity. Chromium work also occurs in renderer, GPU, and network service processes, so use the evidence to narrow the cause rather than assuming the host control is solely responsible.
Why does the application freeze only on exit?
That pattern points to lifecycle handling. Review one-time initialization and main-thread shutdown rules before changing rendering settings.
What should I include in a bug report?
Include the CefSharp version, control flavor, OS, GPU and driver, URL or workload, exact action, reproduction steps, tested switches, and before/after observations from chrome://version and chrome://gpu/.


