How to Fix Cypress Code Coverage Fetch Errors in Docker
Fix Cypress coverage fetch errors in Docker by checking instrumentation, plugin setup, endpoint URLs, container networking, and debug logs.
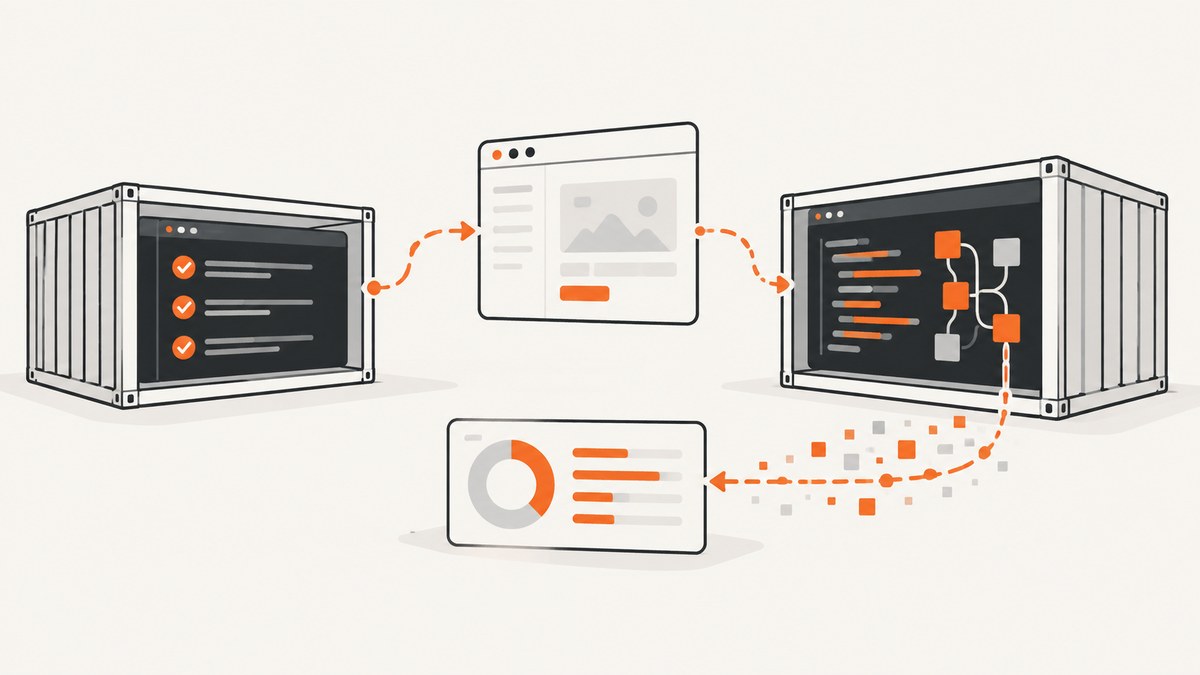
If Cypress cannot fetch code coverage in Docker, first confirm that the application is instrumented, then verify that @cypress/code-coverage is registered in both the support file and setupNodeEvents. If you collect backend coverage, expose a JSON coverage endpoint and set env.codeCoverage.url to an address reachable from the Cypress process. In Docker, localhost usually means the current container, so a URL that works on your host may point to the wrong place from Cypress.
Use the steps below to distinguish missing coverage data from plugin setup errors, an unreachable endpoint, or a large payload timing out. The official Cypress code coverage plugin documentation and Cypress coverage guide describe the required wiring and debug options.
1. Identify which coverage fetch is failing
The plugin can collect frontend coverage exposed by an instrumented app and backend coverage returned by a JSON endpoint. Figure out which path your test uses before changing Docker networking:
- Frontend coverage: the browser-loaded application must expose Istanbul coverage data, usually through a global coverage object.
- Backend coverage: the backend must return its coverage data as JSON from a reachable endpoint, such as
/__coverage__. - Both: verify instrumentation and access for each side independently. A working frontend capture does not prove that the backend endpoint is reachable.
Look at the first error in the Cypress output and the plugin debug trace. A missing coverage object points toward instrumentation or support setup. A request error points toward endpoint configuration or networking. A timeout on a large report may indicate that the coverage payload needs batching.
2. Instrument the application before running Cypress
The coverage plugin collects data; it does not instrument your application automatically. Your frontend build or test configuration must add Istanbul coverage instrumentation, and the app must expose the resulting coverage object while Cypress exercises it. The plugin lists an uninstrumented app as a common reason no coverage is collected.
Check the build configuration used inside Docker, not just the one used for local development. A production-optimized build or a separate container command may omit the instrumentation transform. Confirm that the instrumented bundle is actually served to Cypress. If the app is instrumented only in a local development command, make the container use the same coverage-enabled build mode for the test run.
For backend coverage, instrument the server process that handles the requests under test. Expose its collected coverage as JSON. The plugin provides Express middleware; for other server frameworks, implement a route that returns the global coverage object in JSON. Do not assume that frontend instrumentation makes a backend endpoint available.
3. Install and register the Cypress coverage plugin
Install @cypress/code-coverage as a development dependency in the project or test image that runs Cypress:
npm install --save-dev @cypress/code-coverageImport the support module from the support file used by your test type. For a typical E2E setup, that is cypress/support/e2e.js:
import '@cypress/code-coverage/support';If the project uses a different support file or CommonJS, use the equivalent import or require in the file Cypress actually loads. Check e2e.supportFile in the Cypress configuration if you are unsure. Adding the import to an unused support file has no effect.
Register the plugin task in setupNodeEvents in cypress.config.js:
const { defineConfig } = require('cypress');

module.exports = defineConfig({
  e2e: {
    setupNodeEvents(on, config) {
      require('@cypress/code-coverage/task')(on, config);
      return config;
    },
  },
});
For an ES module configuration, import the task and call it inside setupNodeEvents; keep the required return config:
import { defineConfig } from 'cypress';
import codeCoverageTask from '@cypress/code-coverage/task';

export default defineConfig({
  e2e: {
    setupNodeEvents(on, config) {
      codeCoverageTask(on, config);
      return config;
    },
  },
});
The support import and Node task serve different roles, and both are needed. The plugin saves combined coverage data under .nyc_output and generates reports that can be viewed under coverage/index.html. Preserve those output directories as CI artifacts if you need to inspect reports after a container exits.
4. Make the backend coverage endpoint reachable
For backend coverage, configure the plugin to fetch the full endpoint URL. The plugin expects a JSON response, not an HTML page, a redirect to a login screen, or a route that exists only on the host.
module.exports = {
  env: {
    codeCoverage: {
      url: 'http://app:3000/__coverage__',
    },
  },
};
Merge this setting into the existing Cypress config rather than replacing other settings. The hostname and port above are examples: use the address and listening port that the Cypress container can reach on its network.
In an Express app, the plugin documents middleware for exposing backend coverage. If you use another server, create an equivalent route that serializes the process coverage object. Confirm that the endpoint returns valid JSON from the Cypress container. A browser on the host successfully opening the URL is not enough to prove container-to-container reachability.
5. Set Docker-aware application and coverage URLs
Cypress uses e2e.baseUrl to prefix relative cy.visit() and cy.request() calls, and checks the configured URL before running. Relative requests resolve against the visited host or baseUrl; without a host, Cypress cannot resolve them. These behaviors are documented in the Cypress configuration reference and cy.request() documentation.
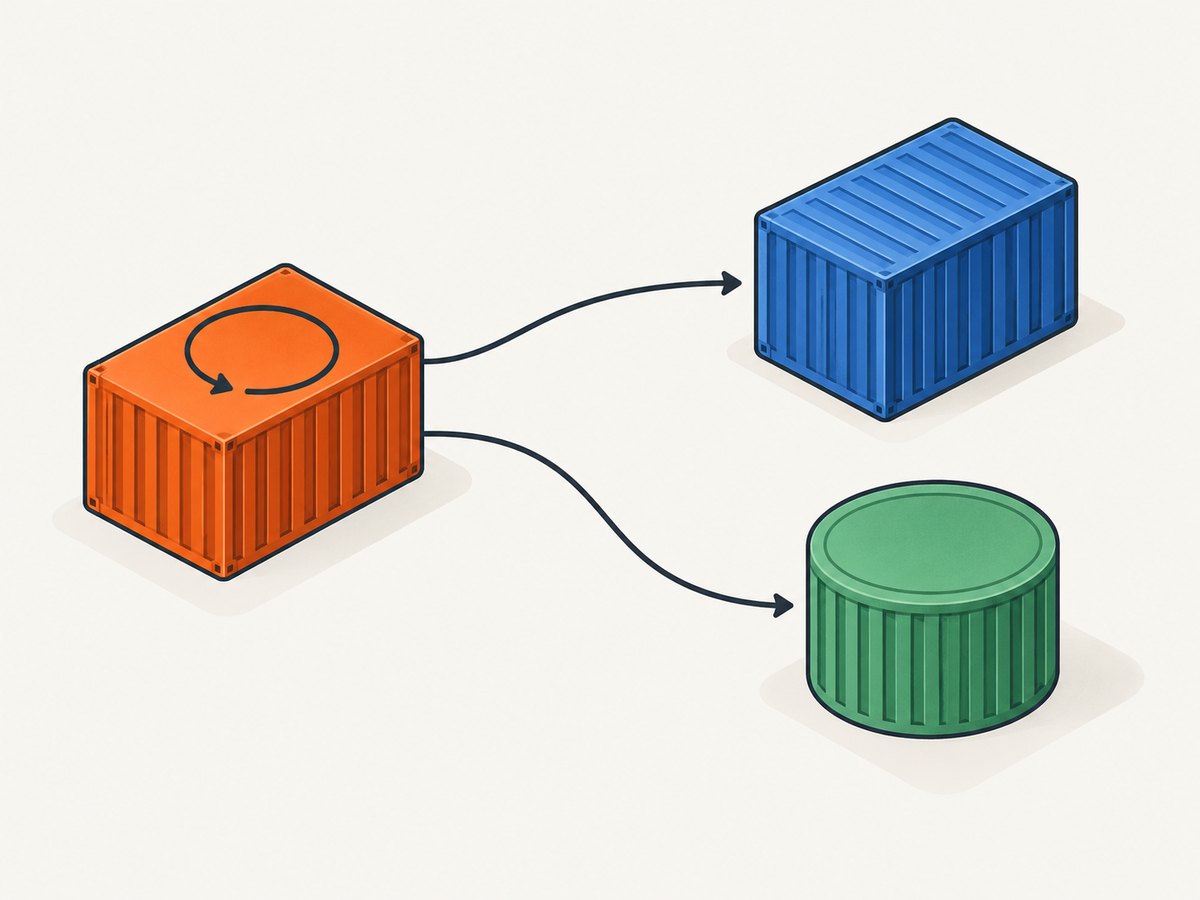
Docker changes what localhost refers to. Inside the Cypress container, it refers to that container itself. In a Docker Compose network, service-to-service traffic commonly uses the application service name and the port the app listens on inside the container. A host-mapped port is commonly for traffic coming from outside the Compose network. This is an operational inference; check your Compose network, port mapping, and server bind address.
// cypress.config.js
const { defineConfig } = require('cypress');

module.exports = defineConfig({
  e2e: {
    baseUrl: 'http://app:3000',
    setupNodeEvents(on, config) {
      require('@cypress/code-coverage/task')(on, config);
      config.env.codeCoverage = {
        ...config.env.codeCoverage,
        url: 'http://app:3000/__coverage__',
      };
      return config;
    },
  },
});
In this example, app is the Compose service name. Change it to the actual service name, and keep the endpoint port consistent with the app’s container-side listening port. If Cypress runs directly on the host while the app runs in Docker, the correct address may instead be the host-mapped port. The right value depends on where the Cypress process runs.
Also confirm the app binds to an interface reachable from other containers. A server listening only on its own loopback interface may reject requests arriving over the container network even when the service name resolves.
6. Trace the failure with plugin debug logs
Enable the plugin’s debug output for the Cypress run:
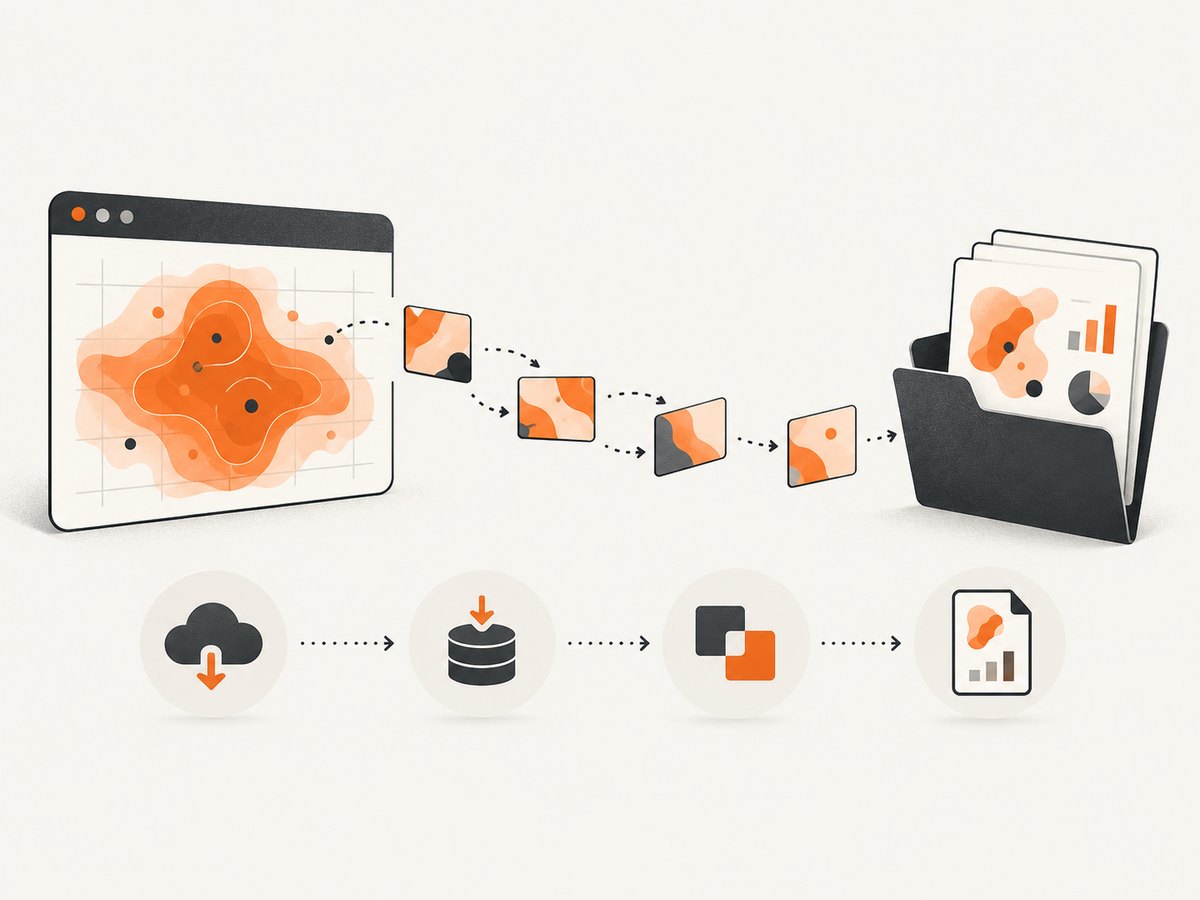
DEBUG=code-coverage npx cypress runOn Windows shells, set the environment variable using the shell’s syntax or a cross-platform environment helper. Read the trace in sequence and locate the stage that first fails:
| Trace stage | What to check |
|---|---|
| Reset | Whether the plugin can initialize or clear coverage state. |
| Fetch | Whether the frontend coverage object or backend JSON endpoint is available. |
| Write | Whether the container can write coverage files to its working directory. |
| Merge | Whether collected coverage data can be combined. |
| Report | Whether the report command runs and the output directory is writable. |
The debug output can also show the command used to invoke nyc. If collection works but the report is missing, inspect the write and report stages rather than changing the endpoint URL.
7. Fix large payload timeouts
Many instrumented files or large coverage maps can make the coverage payload slow to send. If the trace shows that sending coverage times out, configure sendCoverageBatchSize in the plugin’s expose configuration. Batching splits a large send into smaller pieces. Use the plugin’s documented configuration shape for your installed version, then check the debug log to confirm the batches complete.
Do not treat batching as a fix for an unreachable host or absent instrumentation: it addresses payload transfer size. If the failure appeared after upgrading Cypress or the plugin, compare the released plugin versions between the last working run and the first failing run, then consult the release notes for relevant changes.
8. Common errors and fixes
| Symptom | Likely cause | Fix |
|---|---|---|
| No coverage data found | The app bundle was not instrumented, or Cypress did not visit code that produces coverage. | Enable instrumentation in the container’s app build and exercise the relevant routes. |
| Coverage task or event error | The Node task is not registered, support import is missing, or Cypress loads another config/support file. | Check both plugin integration points and the configured support file path. |
Connection refused for localhost |
The URL points back to the Cypress container. | Use a hostname and port reachable from Cypress, often the Compose service name for container-to-container access. |
| Host resolves but request times out | The app is not ready, listens on a different port/interface, or the route is blocked. | Check service readiness, container port, bind address, and endpoint response from the Cypress container. |
| Endpoint returns HTML or invalid JSON | The route redirects, serves an error page, or does not serialize coverage. | Make the route return the backend coverage object as JSON and verify its response body. |
| Fetch timeout with a large coverage object | The payload is too large to send in one batch. | Set sendCoverageBatchSize in the plugin expose configuration. |
| Data is saved but report is absent | The report stage failed, nyc could not run, or output is inaccessible. |
Inspect the report command and write permissions; retain .nyc_output and coverage as CI artifacts. |
9. Reliability, runtime, and CI notes
- Wait for readiness: ensure the app and coverage endpoint are serving before Cypress starts. Cypress’s configured
baseUrlcheck can expose startup ordering problems. - Use one network address consistently: configure
baseUrlandenv.codeCoverage.urlfrom the perspective of the Cypress process, not the host browser. - Keep instrumented output identifiable: make sure CI runs the intended build mode and does not reuse an uninstrumented bundle from a previous step.
- Preserve diagnostics: save debug logs,
.nyc_output, and generated reports when a CI job fails, so the failing stage remains inspectable after container cleanup. - Watch transfer and report cost: instrumentation increases the amount of coverage data collected and transferred, while batching may change request count and runtime. No universal runtime or payload size applies; measure in your own pipeline.
10. Capture a screenshot of the failing page
If the failure may involve a blank page, a bot check, a cookie banner, or a popup obscuring the app, a screenshot can help inspect what Cypress was served. For browser-based troubleshooting, compare the rendered page in the Cypress session with the expected app state.
Or skip the browser setup
ScreenshotNeo can capture a URL in one request when you need a page image during debugging. It is a website screenshot API and MCP server from Yorker Media. A request can return PNG, JPEG, WebP, or PDF; the screenshot API does not replace Cypress coverage instrumentation or coverage collection.
curl -G "https://api.screenshotneo.com/v1/shot" -d access_key=YOUR_API_KEY --data-urlencode url=https://stripe.com -o shot.webpSee the ScreenshotNeo API documentation for request options. Cookie banners, newsletter popups, and chat widgets are removed before the shot. Bot checks, blank pages, failed loads, timeouts, and cache hits are not billed, and response headers identify the page verdict and billing status. An MCP server lets Claude, Cursor, and other MCP clients take screenshots. The Free plan includes 1,000 shots a month with no card; paid plans start at $5 for 3,000 shots.
Sign up for ScreenshotNeo’s free plan to get 1,000 screenshots a month with no card.
FAQ
Does Cypress collect backend coverage automatically?
No. The backend must expose coverage as JSON, and the plugin needs the endpoint URL in env.codeCoverage.url.
Why does cy.request('/__coverage__') work locally but fail in Docker?
Relative Cypress requests resolve against the visited host or configured baseUrl. If that host is unsuitable from the Cypress container, configure an address reachable from that process.
Where do the collected files and report go?
The plugin saves combined data under .nyc_output and generates reports viewable under coverage/index.html.
Can I use a screenshot to prove coverage was collected?
No. A screenshot shows rendered pixels, not Istanbul coverage data. Use the plugin trace and coverage artifacts to diagnose collection.


