How to Fix Headless Chrome REPL Console Errors
Diagnose Headless Chrome REPL errors by finding which process or page produced them, then use the right DevTools or Puppeteer logs to investigate.
Start by identifying where the error appears. A message before Chrome shows the >>> REPL prompt points to startup or command-line setup; a message after an expression may come from the REPL evaluation; a page’s JavaScript exception belongs to the site; and output from Puppeteer or the Chrome DevTools Protocol (CDP) belongs to the automation connection. Those are different failure paths, so there is no single fix for every “Headless Chrome REPL console error.”
Record the exact message, the full command or script, operating system, Chrome version, and Puppeteer version if used. Then follow the matching branch below. Chrome’s REPL evaluates JavaScript expressions from the command line, while remote debugging and Puppeteer provide separate ways to inspect a page or browser process. Chrome’s Headless Chrome documentation and Puppeteer’s debugging guide describe these distinct paths.
1. Locate the error before changing anything
Note when the message appears and which application displays it. Preserve the first error and surrounding lines; later messages can be consequences of the first failure.
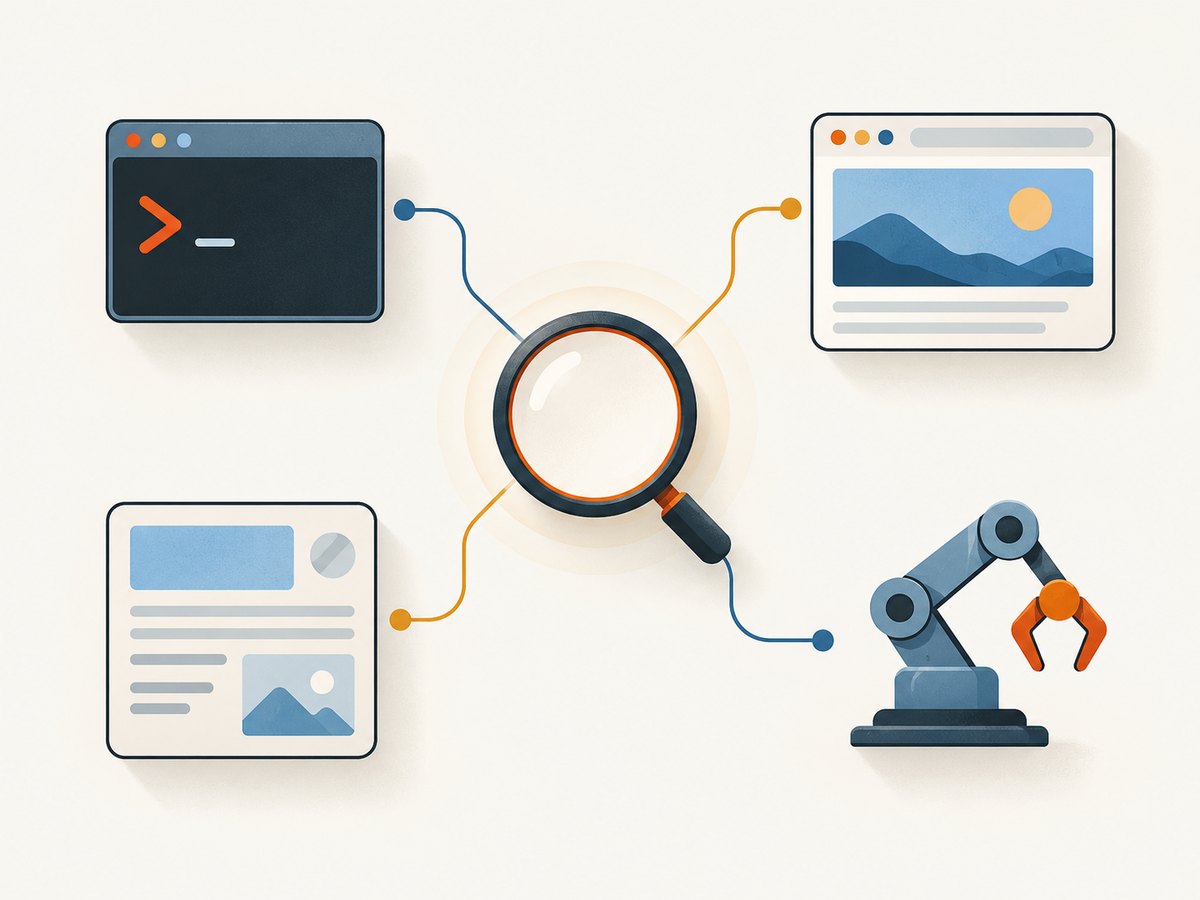
| Where it appears | Likely area to investigate | First useful action |
|---|---|---|
| Shell, before the REPL prompt | Chrome executable, flags, permissions, sandbox, startup | Check the full command and browser stderr/stdout |
After entering an expression at >>> |
Expression syntax or evaluation in the REPL context | Reduce the expression and capture its exact error |
| Page DevTools Console | Site JavaScript or page runtime behavior | Inspect the stack trace and source in DevTools |
| Puppeteer application output | Node code, launch, page events, or browser process | Separate page listeners from browser process logs |
| Automation call hangs or rejects | CDP request, browser connection, or unresolved operation | Enable protocol diagnostics and inspect pending calls |
Keep a short incident record:
- Exact error text, including capitalization and stack trace.
- Command line or minimal script, with secrets removed.
- Chrome version and executable path; Puppeteer version if applicable.
- Operating system and whether the failure happens before launch, during navigation, after evaluation, or at exit.
- Whether the same URL or expression behaves differently in a visible browser.
This classification is a practical diagnostic method, not a claim that the documentation defines one universal error taxonomy. If asking for help, include this information; a title or paraphrase alone is not enough to select a safe fix.
2. Diagnose Chrome’s command-line REPL
Chrome’s headless shell documentation shows --repl for evaluating JavaScript expressions from the command line. Its example is:
chrome --headless --disable-gpu --repl --crash-dumps-dir=./tmp https://www.chromestatus.com/The documentation example may reflect a particular Chrome setup. Confirm the flags and executable supported by your installed version rather than assuming the sample is a universal current command. --crash-dumps-dir sets a location for crash dumps in the documented example; it is not a generic remedy for page console exceptions.
- Check whether Chrome starts. If no prompt appears, capture all shell output and investigate launch, permissions, and executable configuration first.
- Try a simple expression. Once at
>>>, enter a basic expression such as1 + 1. If it works, the REPL is accepting expressions; reduce the failing expression to isolate syntax, context, or page dependencies. - Separate page state from expression errors. An expression that references a missing page object may fail even though Chrome launched successfully. Inspect the target page itself before treating it as a process crash.
- Exit cleanly. The shell documentation describes entering
quitto exit. If Chrome instead fails while closing, preserve the shutdown output separately from errors that occurred during evaluation.
The official shell page includes the example instruction “Type a Javascript expression to evaluate or ‘quit’ to exit.” Treat that as an explanation of REPL use, not a promise that every expression has a page context or that every error signals a crash.
3. Inspect page JavaScript errors with remote DevTools
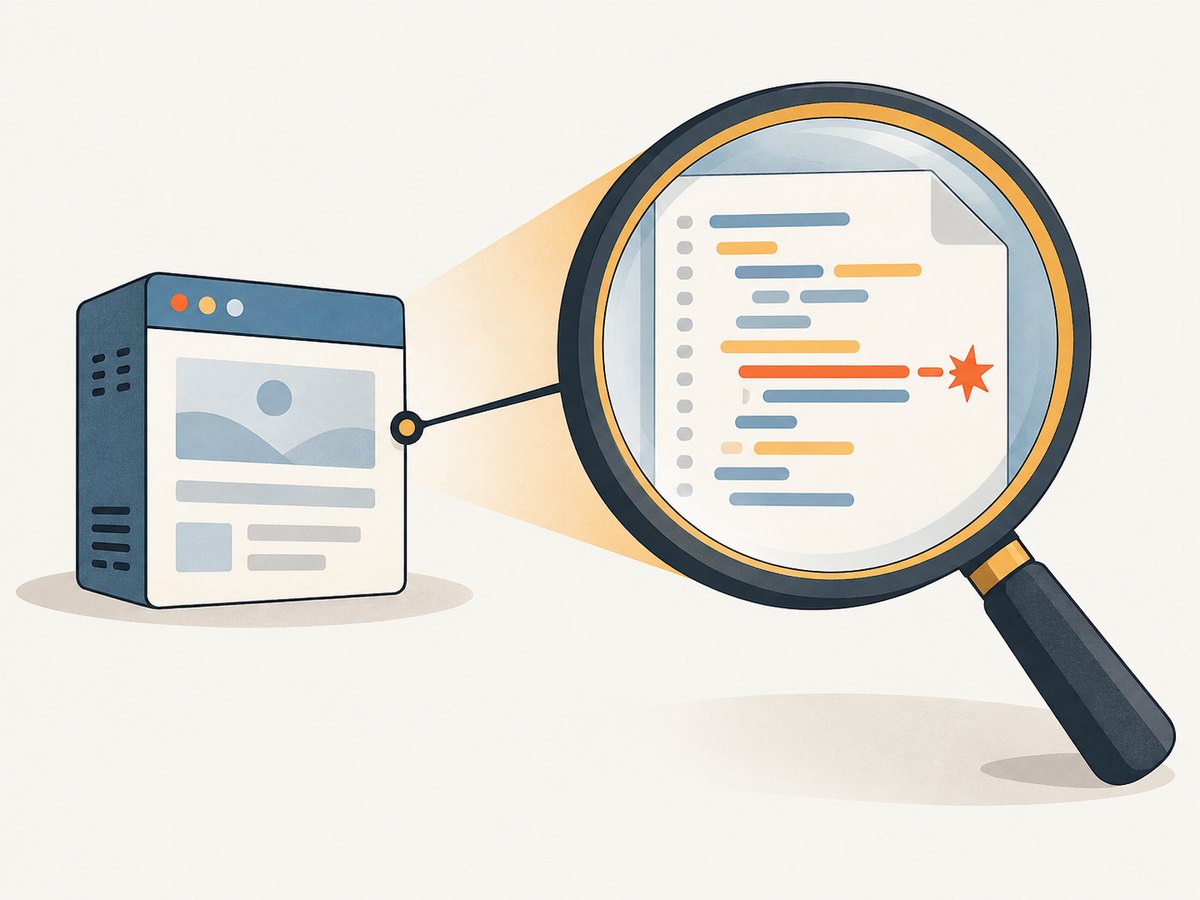
A headless page can still be inspected in DevTools. Chrome documents starting headless Chrome with a remote debugging endpoint, then connecting through chrome://inspect. When the error is in the page’s JavaScript, this is often the most direct way to see the target, source location, and stack.
- Start the page with remote debugging enabled. Chrome’s documented pattern uses port
0, allowing Chrome to select a port and print a WebSocket endpoint:
chrome --headless --remote-debugging-port=0 https://example.com/- Keep the process running and note the debugging endpoint printed by Chrome.
- In a regular Chrome window, open
chrome://inspect. Configure the host and port if the target is on another machine or a non-default endpoint. - Find the target page and choose Inspect. In DevTools, check Console for the exception and Sources for the source line and stack trace.
- Reproduce the issue while the target is attached. Record whether the error occurs on initial navigation, after interaction, or only after a particular expression.
Use a debugging endpoint only where access is controlled: it provides a route to inspect and interact with the browser target. If DevTools cannot connect, verify that Chrome remains running, the endpoint and port are reachable from the inspecting machine, and host configuration matches the endpoint. See Chrome’s remote debugging guide and the Chrome DevTools Protocol reference.
4. Choose the right Puppeteer logging path
Puppeteer has separate mechanisms for browser process output, page console events, and protocol diagnostics. Turning on one does not automatically capture the others. The following Node.js example wires up page-level events and forwards browser process output.
const puppeteer = require('puppeteer');

(async () => {
  const browser = await puppeteer.launch({
    headless: true,
    dumpio: true,
  });

  try {
    const page = await browser.newPage();
    page.on('console', message => {
      console.log(`[page console:${message.type()}] ${message.text()}`);
    });
    page.on('pageerror', error => {
      console.error('[page exception]', error);
    });

    await page.goto('https://example.com/', {
      waitUntil: 'domcontentloaded',
      timeout: 30000,
    });
    console.log('Title:', await page.title());
  } finally {
    await browser.close();
  }
})().catch(error => {
  console.error('[automation error]', error);
  process.exitCode = 1;
});
dumpio: true forwards browser output to the Node process’s standard output and error streams. The console and pageerror handlers above capture page messages and uncaught page exceptions. An automation exception caught at the end is a separate channel. Keep the message categories distinct when analyzing a log.
For protocol-level logging, run the script with Puppeteer’s documented debug setting:
NODE_DEBUG="puppeteer:*" node diagnose.jsFor unresolved asynchronous calls, Puppeteer documents inspecting pending protocol errors and their stacks through browser.debugInfo.pendingProtocolErrors. This is appropriate when an automation request stalls or the client-browser exchange is suspect; it is not the first response to a page’s own JavaScript exception. Verbose protocol logs may include sensitive data. Redact cookies, authorization values, URLs with private tokens, and other secrets before sharing them. See Puppeteer’s debugging guide.
5. Compare headless and visible behavior
When the failure only occurs in headless mode, reproduce with a visible browser as a comparison. Puppeteer documents visible-browser debugging and DevTools use. A difference can narrow the cause to mode-dependent behavior, timing, rendering, or environment, but a successful visible run does not prove the headless setup is fixed.
For example, temporarily change the launch setting:
const browser = await puppeteer.launch({ headless: false });Observe the page and use DevTools to identify the failing script or action. Keep the same URL, inputs, and relevant timing where practical. Puppeteer notes a Chromium limitation involving use of await page.click() in the DevTools console; do not treat entering automation commands into that console as a general workaround.
6. Check browser compatibility and launch configuration
If Chrome fails before the REPL prompt, exits unexpectedly, or Puppeteer cannot establish a session, check browser compatibility and launch configuration before changing page code. Puppeteer states that it is only guaranteed to work with its bundled browser. A separately installed Chrome executable may work, but version mismatches can be relevant when launch or protocol behavior is suspect. Check the Puppeteer LaunchOptions documentation and compare the configured executable and package version.
Review one change at a time: the executable path, headless mode, flags, user permissions, and environment. Retain the complete original error so you can tell whether a change altered the failure or merely hid a later symptom.
Sandbox errors need a specific remedy
For Linux errors such as No usable sandbox!, consult Puppeteer’s platform-specific troubleshooting guidance and match the remedy to the host setup. Puppeteer documents --no-sandbox only for cases where the content is absolutely trusted. Disabling the sandbox reduces an important browser isolation boundary; it is not a routine fix for a console message, page exception, or generic launch failure. See Puppeteer troubleshooting.
GPU symptoms are a separate branch
Do not add GPU flags to address unrelated JavaScript or REPL errors. Puppeteer’s troubleshooting guide notes that chrome-headless-shell requires --enable-gpu for GPU acceleration. Consider that setting only when the actual symptom concerns GPU acceleration or compositing in that shell, and verify the relevant behavior for the browser build in use.
7. Common errors and how to respond
| Symptom | Possible cause | Next step |
|---|---|---|
| No REPL prompt; Chrome prints an error and exits | Executable, permission, sandbox, or unsupported launch configuration | Keep the full process output; verify executable and platform guidance before changing flags |
Expression fails after >>> |
Invalid JavaScript, missing name, or an expression that assumes page state | Try a minimal expression, then reduce the failing one and capture the exact exception |
| Page Console shows an exception | Page script or runtime failure | Attach with remote DevTools; use the source location and stack to locate the failing script |
| Puppeteer launch rejects | Browser launch or executable mismatch, permissions, or environment issue | Enable dumpio; check bundled-browser compatibility and platform troubleshooting |
| Navigation times out | Slow or stalled page load, chosen navigation condition, or connectivity issue | Check whether the page is reachable and which load condition is awaited; distinguish navigation timeout from a page exception |
| Automation action hangs | Unresolved operation or protocol/client problem | Enable protocol logs and inspect pending protocol errors and stacks |
No usable sandbox! on Linux |
Sandbox environment or host configuration | Use the documented host-specific sandbox setup; reserve --no-sandbox for absolutely trusted content |
| GPU or compositing behavior differs in headless shell | GPU acceleration configuration | Check whether this is chrome-headless-shell and consult its GPU guidance |
These are diagnostic mappings, not claims that a symptom has only one cause. The exact error text and environment determine the fix.
8. Improve capture reliability and performance
Browser debugging can add overhead. Keep verbose protocol logging off during normal runs and enable it for a focused reproduction. Use a navigation condition suited to the page: waiting for full network idleness can be counterproductive on pages that keep connections open, while waiting only for DOM content may be too early for scripts that render later. Set a finite timeout and report whether the timeout came from navigation, a selector wait, or another action.
- Make failures observable: log launch errors, page console messages, page exceptions, navigation failures, and automation exceptions as separate event types.
- Preserve context: include URL, browser/library version, elapsed time, and the action underway, while redacting credentials and personal data.
- Bound waits: use explicit timeouts and avoid indefinite waits for an event that may never occur.
- Reproduce minimally: reduce to one page, one action, and the smallest relevant expression before changing launch options.
- Compare consistently: keep the same browser build and page inputs when comparing headless with visible mode.
There is no source-backed universal speed or failure-rate figure for this problem. Measure your own workload; do not infer a general performance benchmark from one page or a single debug run.
Or skip the browser setup
If your task is to obtain a screenshot rather than debug Chrome itself, ScreenshotNeo provides a website screenshot API. One GET request returns an image or PDF, and its API accepts screenshot parameters used by other screenshot APIs. See the ScreenshotNeo API documentation for options and configuration.
curl -G "https://api.screenshotneo.com/v1/shot" -d access_key=YOUR_API_KEY --data-urlencode url=https://example.com -o shot.webpScreenshotNeo removes cookie and consent banners, newsletter popups, and chat widgets before the capture; each step can be turned off. Bot checks, blank pages, timeouts, failed loads, and cache hits are not billed, and response headers report the page verdict and billing status. Its MCP server offers take_screenshot, get_page_info, and capture_pdf tools for AI agents and MCP clients. The free plan includes 1,000 screenshots per month with no card; paid plans start at $5 for 3,000 screenshots. Every feature is available on every plan. If screenshots fit your workflow, sign up for 1,000 free screenshots a month, with no card.
Frequently asked questions
Does every Headless Chrome REPL error mean Chrome crashed?
No. A REPL evaluation error, page exception, process message, and protocol failure can look similar in a terminal but come from different layers. Locate the source before deciding.
Can I inspect a page that is running headless?
Yes. Chrome documents remote debugging and inspection through chrome://inspect. The debugging endpoint must be reachable from the inspecting browser.
Should I always use --no-sandbox in a container?
No. Treat it as a security-sensitive workaround for absolutely trusted content, and follow the platform-specific sandbox guidance for the actual error.
What information should I include when asking for help?
Provide the exact error, complete command or a minimal script, where it appeared, Chrome and Puppeteer versions, operating system, and what you already observed. Remove credentials and private tokens from logs.


