How to Fix Highcharts SVG Rendering Issues in PhantomJS
Fix blank, clipped, or different Highcharts SVG output in PhantomJS, then migrate safely to Node.js, client-side export, or ScreenshotNeo.
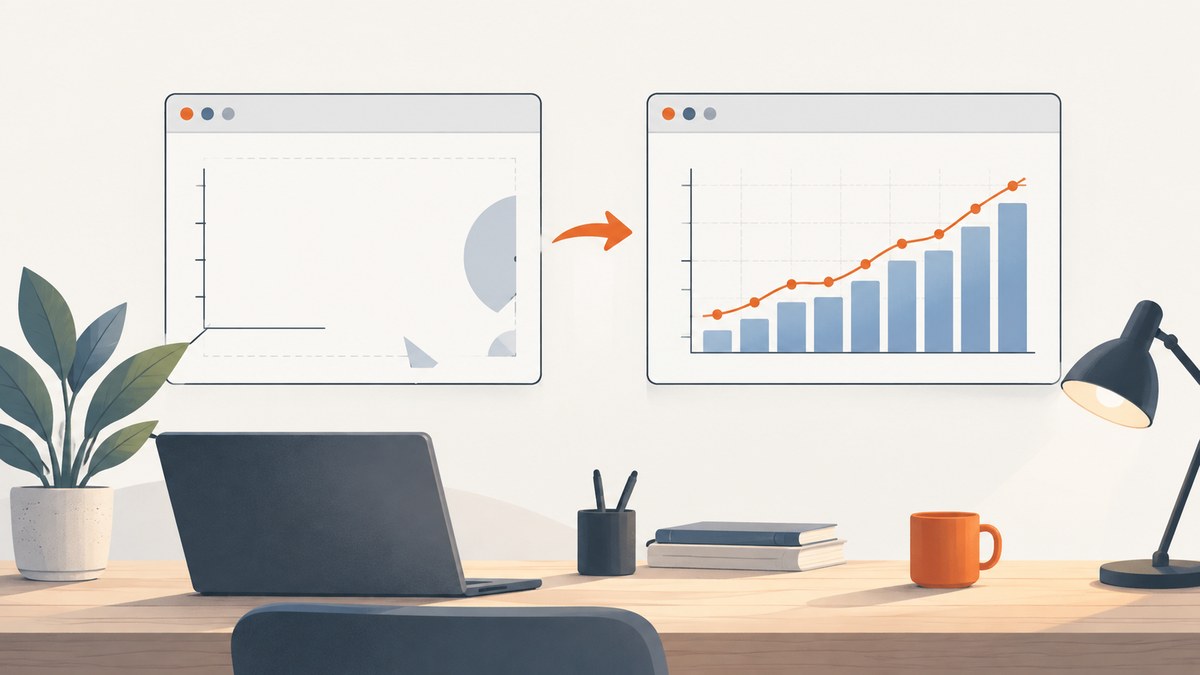
Highcharts SVG rendering problems in PhantomJS usually come from a small set of causes: the legacy renderer is deprecated, a required Highcharts module cannot be loaded, the wrong chart constructor or input type is passed, dimensions conflict, or PhantomJS lacks the browser APIs and fonts your chart needs. Fix the immediate failure by checking inputs, resources, dimensions, callbacks, and page errors in that order. Then plan a migration: use client-side exporting where it fits, or move server rendering to the maintained Highcharts Node.js export server based on Puppeteer.
PhantomJS can still be useful while you repair an existing pipeline, but Highcharts’ legacy documentation marks its PhantomJS export methods as deprecated and no longer maintained. Treat a blank SVG as a compatibility problem, not as a signal to build a new production service on PhantomJS.
1. Identify the failure before changing code
Save the exact input, command, stdout, stderr, exit code, and output file for a failing request. “Blank chart” can mean an empty SVG, an SVG with no series, a clipped viewport, or a chart that failed before the constructor ran.
| Symptom | Likely cause | First check |
|---|---|---|
| Completely blank SVG | JavaScript error, missing Highcharts file, wrong input mode, or botched constructor | PhantomJS page errors, resource failures, and the input flag |
| Axes appear but series do not | Missing data, stock/map/more module, or malformed options | Network paths and the module required by the chart type |
| Labels are clipped or misplaced | Viewport, width, scale, font, or unreliable geometry API |
Explicit dimensions and available fonts |
| Output differs from Chrome | Different SVG client, font metrics, unsupported DOM APIs, or timing | Compare loaded resources and computed dimensions |
| Export hangs | Network request, timer, callback, or page never reaching a ready state | Timeout logging and a minimal chart |
Highcharts documents that SVG clients do not all support the same features. Its server-rendering experience also describes unreliable getBBox and box-model behavior in alternative stacks. Those differences can change text placement even when the SVG source looks valid.
2. Confirm the PhantomJS input and chart constructor
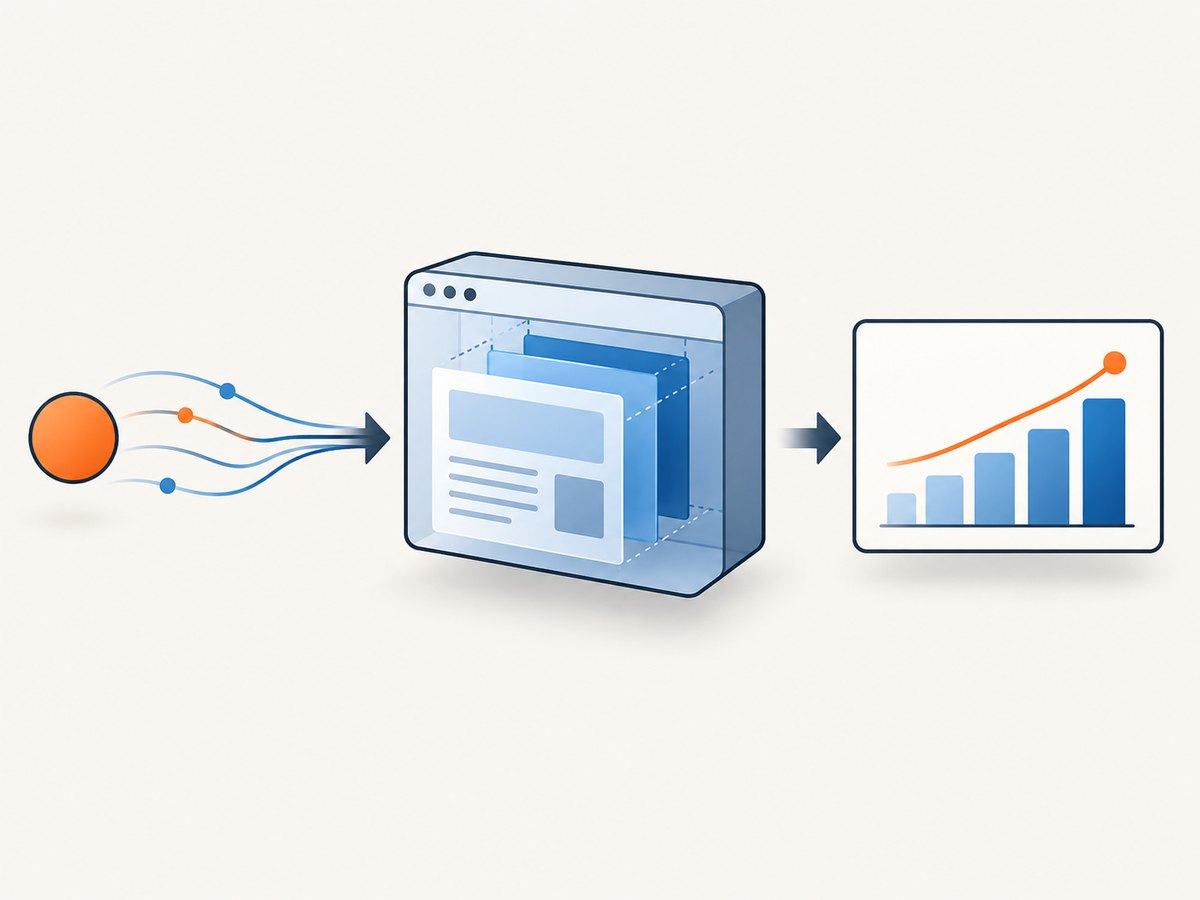
The legacy converter accepts either a chart options/configuration file or SVG input, depending on the command you use. It also distinguishes the regular Chart constructor from StockChart. Passing an SVG file where JSON options are expected, or invoking Chart for stock configuration, can produce an empty or malformed result.
- Open the configuration file and verify that it is valid JSON with an
optionsobject or the structure expected by your converter version. - Check that the command’s input mode matches the file. Do not assume a file containing SVG markup is treated as chart options.
- Select
StockChartfor Highstock options andChartfor ordinary charts. - Reduce the chart to one series and one axis. Add modules and options back one at a time.
{
  "infile": "chart.json",
  "outfile": "chart.svg",
  "constructor": "Chart",
  "width": 1000,
  "scale": 1
}
Use the exact option names supported by the version of the legacy converter in your deployment. Keep a known-good minimal configuration in source control so you can separate converter errors from chart-option errors.
3. Make every Highcharts resource discoverable
A PhantomJS page cannot render code it cannot load. The legacy setup expects Highcharts JavaScript and module files to be available from its working directory or from an explicitly configured location. Missing highcharts-more.js, data, map, stock, accessibility, or other modules can remove series and rendering paths without producing a useful server error.
Check paths and working directories
- Run the converter from the directory that contains the files it references, or use absolute paths.
- Verify the exact filename and case of every script on case-sensitive systems.
- Load Highcharts before any module that extends it.
- Keep map data, data tables, and custom scripts beside the configuration or give each an explicit path.
- Do not rely on a developer machine’s globally installed files inside a container or service account.
<script src="highcharts.js"></script>
<script src="highcharts-more.js"></script>
<script src="modules/stock.js"></script>
<script src="modules/exporting.js"></script>
<script>
  Highcharts.chart('container', options);
</script>
Instrument the page’s resource callback if your wrapper exposes one. Record the URL and status for failed requests. A 404 for a module is more actionable than an empty output file.
4. Control width, scale, viewport, and layout
The converter’s scale changes PhantomJS’s zoom factor. width overrides scale and sets an exact output width. Unintended combinations can make text tiny, push labels outside the viewport, or clip the plot area.
- Start with a fixed width such as 1000 pixels and a scale of 1.
- Set the chart’s CSS width and height explicitly; do not depend on a percentage whose parent has no size.
- Give the chart enough height for axis labels, legend, title, and credits.
- Change one dimension at a time and compare the SVG viewBox with the intended output.
- For high-density output, prefer a predictable width and then apply a controlled scale rather than mixing several implicit sizes.
# Example legacy converter arguments
phantomjs highcharts-convert.js \
  -infile chart.json \
  -outfile chart.svg \
  -width 1200 \
  -scale 1
If labels are cut off, inspect chart margins and allow room for rotated labels. If the SVG contains the labels but the bitmap does not, the problem is likely output sizing or a downstream rasterizer.
5. Remove callback, CSS, and injected-script failures
Callback JavaScript, custom CSS, and injected files execute inside the rendering page. A syntax error, unsupported DOM method, or broad CSS selector can stop chart construction or alter SVG geometry.
- Run the callback against a minimal chart before using production data.
- Use syntax supported by the PhantomJS JavaScript engine; avoid modern language features unless transpiled.
- Scope CSS to the chart container. Rules such as
svg { width: 100% }can override dimensions used by the exporter. - Do not call browser APIs that PhantomJS does not implement.
- Move data preparation outside the page and inject plain JSON.
page.onError = function (message, trace) {
  console.error('page error: ' + message);
  trace.forEach(function (item) {
    console.error('  ' + item.file + ':' + item.line);
  });
};

page.onResourceError = function (error) {
  console.error('resource error: ' + error.url + ' (' + error.errorCode + ')');
};
Preserve stderr and stdout in your job system. If the wrapper hides errors, add temporary logging around page creation, script injection, chart construction, and SVG extraction.
6. Check fonts and geometry-sensitive features
SVG text is positioned using font metrics. A font installed on your workstation may be absent in a container, causing different line breaks, overlap, or clipped labels. Install the required fonts in the rendering environment or use a font stack with a known fallback. Avoid assuming that a webfont has loaded unless your page waits for it.
Features that depend on getBBox, exact text measurement, foreign objects, or browser layout can behave differently in PhantomJS and other SVG clients. Highcharts’ documentation records feature differences among clients, and its server-rendering article describes unreliable geometry behavior in alternative environments. When exact typography matters, compare the output in a maintained Chromium-based renderer.
7. Wait for data, fonts, and asynchronous work
PhantomJS can capture before an asynchronous data request, callback, or font load finishes. Use one deterministic readiness condition:
- Inline small datasets when possible.
- Wait for a specific selector or a chart-created marker.
- Use a bounded delay only when no event or selector is available.
- Fail the job when the ready condition is not met; do not silently save an empty SVG.
- Set a hard timeout for every network request and the overall render.
var deadline = Date.now() + 15000;
(function waitForChart() {
  var ready = page.evaluate(function () {
    return !!document.querySelector('#container svg');
  });
  if (ready) {
    saveSvg();
  } else if (Date.now() > deadline) {
    console.error('chart did not become ready');
    phantom.exit(1);
  } else {
    window.setTimeout(waitForChart, 100);
  }
}());
8. Use a reproducible debugging checklist
- Render a one-series chart with no external data.
- Confirm
highcharts.jsloads and the constructor runs. - Add the required module, then the real data.
- Set explicit width, height, and scale.
- Capture page and resource errors.
- Test with system fonts only, then add custom fonts.
- Compare the SVG source, viewBox, and a browser screenshot.
- Record the PhantomJS version, Highcharts version, operating system, and command line.
9. Common errors and fixes
| Error or symptom | Cause | Fix |
|---|---|---|
Highcharts is not defined |
Core script failed to load or ran after the chart code | Fix the path, load core first, and log resource failures. |
Highcharts.stockChart is not a function |
Stock module is missing or the wrong build is loaded | Load the stock module or use the regular Chart constructor. |
| Blank output with exit code 0 | Page JavaScript failed but the wrapper did not propagate it | Add page.onError, verify the container, and fail on missing SVG. |
| Only some series are missing | Module, data, map, or asynchronous request was unavailable | Check each request and wait for the data-ready condition. |
| Labels overlap after deployment | Different fonts or viewport dimensions | Install fonts, set dimensions explicitly, and compare computed metrics. |
| SVG is valid but PNG is clipped | Rasterizer width, scale, or viewBox mismatch | Inspect the SVG viewBox and use one explicit output width. |
| Export server is unreachable | Legacy PhantomJS web server is bound incorrectly or exposed unsafely | Bind it to localhost or an internal network while migrating. |
10. Choose a supported replacement
Highcharts documents the maintained Node.js export server, which accepts chart configurations or SVG and uses Puppeteer to render PNG, JPG, PDF, or SVG. It can be installed with npm and used from the command line; batch conversion is also supported. This is the usual server-side migration path when you need repeatable browser rendering and control of the runtime.
For an application that already runs in a browser, Highcharts says client-side exports are the default since v12.3. PDF generation may require the offline-exporting module and its dependencies. Client-side export keeps chart data in the user’s browser, while a hosted exporter receives generated SVG. Choose with four questions: which browser features your chart needs, whether data may leave your network, how much operational control you require, and whether your fonts and chart modules behave consistently.
Do not expose the legacy PhantomJS web server to the public internet. Highcharts explicitly warns that it is not intended as a general production server. Put it behind an internal boundary during migration, restrict access, and remove it after the replacement is validated.
11. Or skip the browser setup
ScreenshotNeo provides a website screenshot API and MCP server. Use it when your goal is a clean rendered page image or PDF rather than maintaining a PhantomJS process.

One request returns PNG, JPEG, WebP, or PDF. The service accepts consent banners before capture and removes more than 60 known consent platforms, newsletter popups, and chat widgets; each cleanup step can be disabled. Bot checks and CAPTCHAs, blank pages, timeouts, failed loads, and cache hits are not billed, and response headers report the page verdict and billing result.
See the ScreenshotNeo API documentation for all options, including viewport and device presets, full-page and CSS-element capture, dark mode, retina scale, custom CSS and JavaScript, click and wait rules, request blocking, headers, cookies, authorization, timezone, geolocation, transparent backgrounds, resizing, caching, signed links, asynchronous jobs, webhooks, bulk capture, usage, and the OpenAPI specification.
cURL
curl -G "https://api.screenshotneo.com/v1/shot" \
  -d access_key=YOUR_API_KEY \
  --data-urlencode url=https://stripe.com \
  -o shot.webp
Python
import requests

r = requests.get(
    "https://api.screenshotneo.com/v1/shot",
    params={"access_key": "YOUR_API_KEY", "url": "https://stripe.com"},
    timeout=90,
)
r.raise_for_status()
open("shot.webp", "wb").write(r.content)
Node.js
const q = new URLSearchParams({
  access_key: 'YOUR_API_KEY',
  url: 'https://stripe.com'
});
const res = await fetch(`https://api.screenshotneo.com/v1/shot?${q}`);
if (!res.ok) throw new Error(`Screenshot failed: ${res.status}`);
const buffer = Buffer.from(await res.arrayBuffer());
require('fs').writeFileSync('shot.webp', buffer);
ScreenshotNeo has an MCP server with take_screenshot, get_page_info, and capture_pdf tools for Claude, Cursor, and other MCP clients. The Free plan includes 1,000 shots per month without a card; paid plans start at $5 for 3,000 shots. Every feature is available on every plan.
Create a free ScreenshotNeo account and use the included 1,000 screenshots to replace the fragile capture step.
12. Performance, reliability, and cost
- Performance: Keep charts small while diagnosing. Highcharts reports one production experience where SVGs with more than 1,500 data points became too slow in PhantomJS; treat that as an environment-specific experience, not a universal limit.
- Reliability: Pin the renderer and Highcharts versions, install fonts explicitly, set bounded timeouts, and retain logs. Retry only transient network failures; retrying deterministic JavaScript errors adds load without fixing the chart.
- Reproducibility: Store the input JSON, module set, dimensions, font package, and command line with each failed artifact.
- Cost: A self-hosted Node or PhantomJS service consumes compute and maintenance time. ScreenshotNeo bills only clean shots; failed loads, blank pages, bot checks, CAPTCHAs, timeouts, and cache hits cost nothing.
13. FAQ
Is PhantomJS still supported by Highcharts?
The legacy PhantomJS export methods are deprecated and no longer maintained. Use it only as a temporary compatibility target while migrating.
Why does the SVG work in Chrome but not PhantomJS?
The renderers have different DOM, SVG, font, and geometry support. Unsupported APIs, missing fonts, and different getBBox results commonly change layout.
Should I use SVG input or chart options?
Use the mode your converter command expects. Mixing an SVG file with an options mode, or selecting the wrong constructor, can create empty output.
When should I choose client-side export?
Use it when the chart already runs in a browser and its data can remain there. For server jobs, compare the maintained Node.js export server with your privacy and operational requirements.
Can ScreenshotNeo render a Highcharts chart?
Yes, when the chart is available from a URL. It captures the rendered page and can wait, inject scripts or CSS, select an element, and return an image or PDF.


