How to Fix VS Code Playwright Tests Stuck in Debugging
Find out why a Playwright test is paused or still running in VS Code, then fix breakpoints, page.pause(), launch settings, and stuck processes.
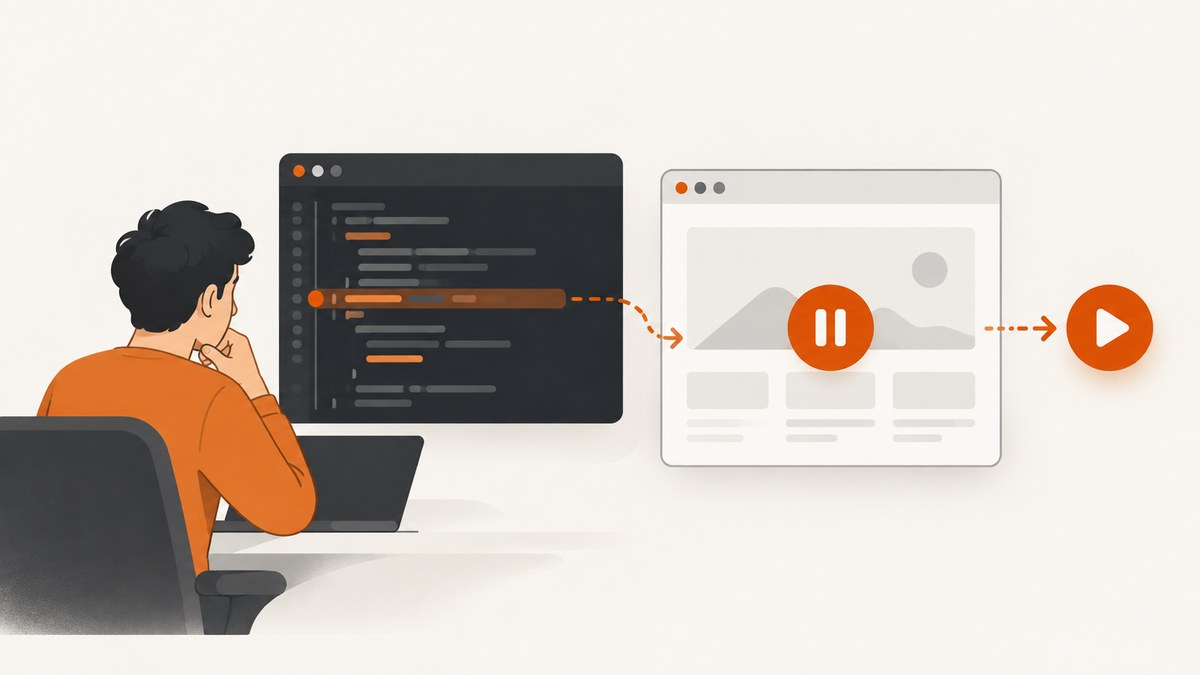
When a VS Code Playwright test appears stuck in debugging, first identify whether it is paused by design or whether the debug session failed to shut down. A breakpoint or page.pause() stops execution and waits for Resume. A session that remains active after the last assertion is a lifecycle or process problem. Use the current line and call stack to tell these cases apart, then resume, remove the pause, or stop the correct process.
This guide follows the troubleshooting flow documented by Playwright and VS Code’s Node.js debugger documentation. It also shows how to reproduce the test outside the editor with Playwright Inspector, UI Mode, and Trace Viewer.
1. Check what “stuck” means
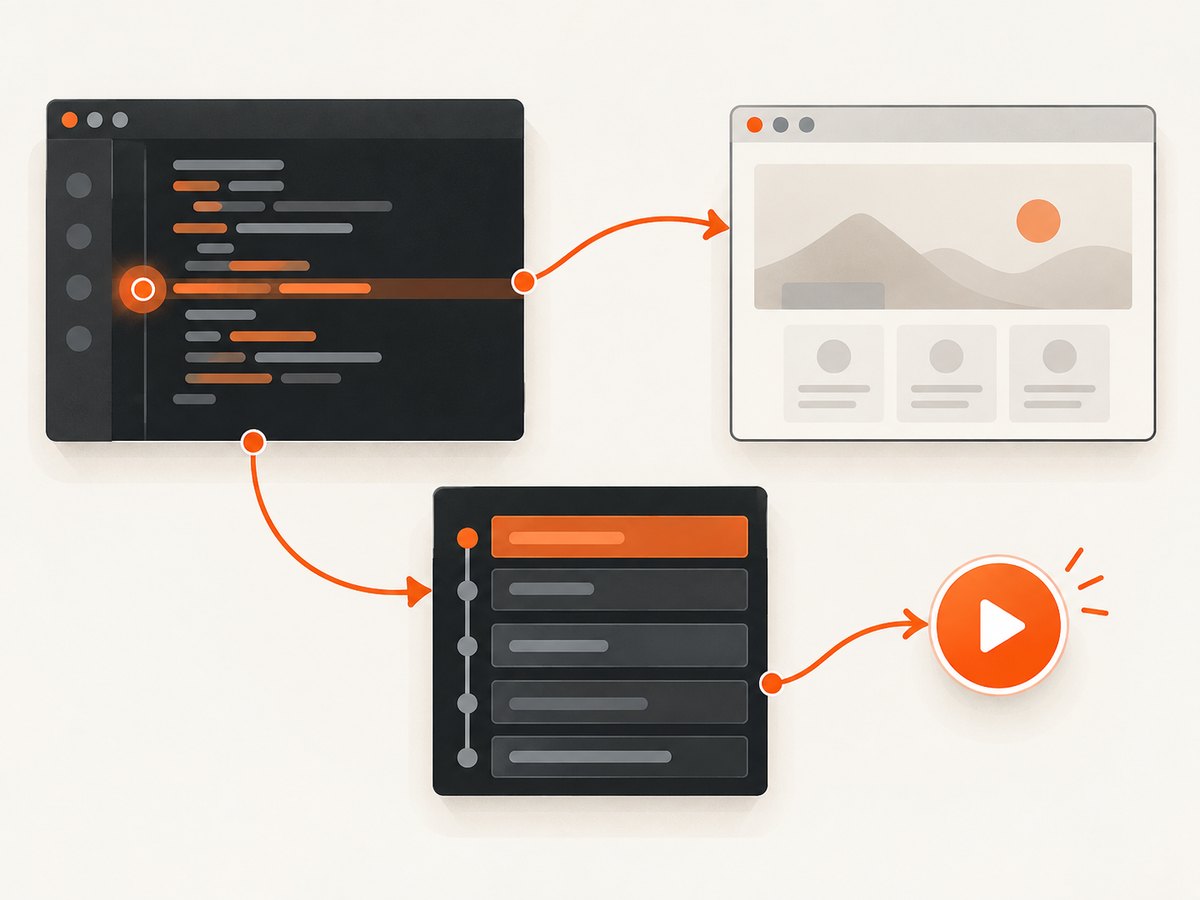
Look at the Debug view before changing configuration. The highlighted source line, call stack, and debug toolbar tell you whether the browser is waiting at a deliberate pause or whether Node.js is still running.
| What you see | Likely cause | First action |
|---|---|---|
| Execution is highlighted on a line with a red breakpoint | VS Code paused at a breakpoint | Click Continue (or press F5) |
The line is await page.pause() |
Playwright Inspector was explicitly opened | Resume in Inspector or remove the call |
| The test assertions passed but the debug toolbar remains | Launch process did not exit | Press Stop again to force termination |
| Stop disconnects but a server or browser keeps running | You used an attach session | Stop the target process separately |
| The wrong test or process opens repeatedly | launch.json, pre-launch task, or test selection issue | Inspect the debug configuration and command |
Playwright’s VS Code extension intentionally pauses when you choose Debug Test at a test breakpoint. A pause is therefore not evidence of a hang by itself. The same is true of page.pause(), which is an explicit request to open the Inspector and wait for interaction.
2. Resume a breakpoint or page.pause()
Breakpoint pause
- Open Run and Debug in VS Code.
- Read the highlighted line and the Call Stack panel.
- Confirm that the breakpoint is in the test you intended to run.
- Click Continue in the floating debug toolbar, or press
F5. - Use Step Over or Step Into only when you need to inspect the next action.
To remove an accidental breakpoint, click the red dot in the editor gutter or open the Breakpoints section and disable all breakpoints. A conditional breakpoint can also appear to be unexpected when its expression evaluates to true; inspect its condition before deleting it.
Explicit Playwright pause
import { test, expect } from '@playwright/test';

test('checkout page', async ({ page }) => {
  await page.goto('https://example.com/checkout');
  await page.pause();
  await expect(page.getByRole('heading', { name: 'Checkout' })).toBeVisible();
});
Run this code in debug mode and Playwright Inspector waits at page.pause(). Use the Inspector’s Resume control to continue. Once you finish inspecting locators, remove the call or guard it so normal runs do not stop:
if (process.env.PW_INSPECT === '1') {
  await page.pause();
}
Start an inspection run with PW_INSPECT=1 npx playwright test checkout.spec.ts --debug on macOS/Linux, or $env:PW_INSPECT='1'; npx playwright test checkout.spec.ts --debug in PowerShell.
3. Stop a session that will not end
If the test has finished and the launched debuggee remains active, click Stop once and wait briefly. VS Code documents pressing Stop a second time to force termination when a launched Node.js debuggee does not shut down correctly.
Launch and attach sessions have different semantics:
- Launch: VS Code started the Node.js process. Stop asks that debuggee to terminate; a second Stop forces shutdown when required.
- Attach: VS Code connected to a process that was already running. Stop disconnects the debugger, but the target process continues. Stop the Playwright worker, web server, or test runner using the command that started it.
Do not kill processes blindly. First check whether the configuration uses "request": "launch" or "request": "attach", and check the terminal that owns the process.
4. Validate .vscode/launch.json
For a custom configuration, inspect the debugger type, request, program or runtime arguments, working directory, environment, and pre-launch task. Settings supported by one debugger do not automatically apply to another.
{
  "version": "0.2.0",
  "configurations": [
    {
      "name": "Playwright: current test",
      "type": "node",
      "request": "launch",
      "program": "${workspaceFolder}/node_modules/@playwright/test/cli.js",
      "args": ["test", "${file}", "--project=chromium"],
      "cwd": "${workspaceFolder}",
      "console": "integratedTerminal",
      "env": {
        "PWDEBUG": "1"
      },
      "skipFiles": ["<node_internals>/**"]
    }
  ]
}
The exact fields depend on your project and installed extension. The important checks are:
- Entry point: It should invoke the Playwright test runner, not a stale compiled file.
- Arguments: Confirm the file, project, grep expression, and debug flags are the ones you expect.
- cwd: Use the directory containing the correct
playwright.configandpackage.json. - Environment: Remove an old
PWDEBUG,DEBUG, or custom flag that keeps Inspector behavior enabled. - Pre-launch task: A task that starts a server may keep the session alive unless it is marked background-ready and has a termination strategy.
- Attach details: For attach, verify the process ID or inspect port matches the running target.
5. Reproduce outside the VS Code test workflow
Separating Playwright from the editor quickly tells you whether the problem is in the test, browser, or VS Code session.
Playwright Inspector
npx playwright test tests/checkout.spec.ts:10 --debugThe :10 suffix narrows execution to a test location. Inspector provides step controls, locator inspection, and actionability information. If this command exits normally, focus on the VS Code launch configuration or extension workflow.
UI Mode
npx playwright test --uiUI Mode lets you select tests, rerun them, watch logs and errors, inspect network requests and DOM snapshots, and review traces. It is useful when the editor debugger is too stateful or repeatedly selects the wrong test.
Trace Viewer
For a completed or failed run, open the generated trace:
npx playwright show-trace test-results/path-to-trace.zipA trace shows a timeline plus recorded DOM snapshots, network activity, screenshots, and test metadata. It can reveal that the test was merely waiting on a slow navigation or locator while VS Code looked idle.
6. Browser DevTools and the Playwright extension
If you need Chrome DevTools, use the documented Playwright extension path: choose Run Test with Show Browser enabled so the extension can reuse the browser session and open DevTools. Opening a separate browser manually can produce a different context and make it appear that the test is not responding.
Keep one debugging controller active at a time. Running Inspector, UI Mode, and a VS Code debug launch against the same test can create multiple workers and confusing breakpoints. Stop the extra runner, then reproduce with one command.
7. Common errors and fixes
| Symptom | Cause | Fix |
|---|---|---|
| “Paused on breakpoint” never advances | Breakpoint is hit on every retry or worker | Disable it, remove retries temporarily, and inspect the worker count. |
| Inspector opens on every run | page.pause() or PWDEBUG=1 remains enabled |
Remove the pause or unset the environment variable for normal runs. |
| Stop disconnects but Chrome stays open | Attach session or separately launched browser | Terminate the owning process or close the browser started outside VS Code. |
| Wrong test starts | Stale launch arguments, test filter, or active editor file | Run the exact CLI command in a terminal and update args. |
| Session waits after assertions | Web server, worker, or pre-launch task is still alive | Check terminal processes and task configuration; stop the owner. |
| Browser never appears | Headless setting or launch configuration mismatch | Run with --debug, enable Show Browser, and verify the selected project. |
| Debugger attaches to old code | Compiled output or source maps point to a previous build | Clean the build output, restart VS Code, and launch the TypeScript source through Playwright. |
8. A repeatable recovery checklist
- Read the highlighted line and call stack.
- Resume if it is a breakpoint or
page.pause(). - Remove accidental breakpoints and clear Inspector environment variables.
- Stop once; press Stop a second time only for a launched process that did not exit.
- If attached, stop the target process separately.
- Run the exact test with
npx playwright test file:line --debug. - Try
--uiwhen you need filtering, logs, network details, or DOM snapshots. - Open a trace for a retrospective view of a completed run.
- Only then change
launch.json, one setting at a time.
9. Or skip the browser setup
If your goal is to capture a page image for a test artifact, visual diff, report, or documentation screenshot, ScreenshotNeo can return the image through one GET request. The API accepts PNG, JPEG, WebP, or PDF output and does not require you to maintain a Playwright browser session.
cURL:
curl -G "https://api.screenshotneo.com/v1/shot" -d access_key=YOUR_API_KEY --data-urlencode url=https://stripe.com -o shot.webpPython:
import requests
r = requests.get("https://api.screenshotneo.com/v1/shot", params={"access_key": "YOUR_API_KEY", "url": "https://stripe.com"}, timeout=90)
open("shot.webp", "wb").write(r.content)
Node.js:
const q = new URLSearchParams({ access_key: 'YOUR_API_KEY', url: 'https://stripe.com' });
const res = await fetch(`https://api.screenshotneo.com/v1/shot?${q}`);
See the ScreenshotNeo API documentation for the complete option list. You can select full-page or CSS-element captures, device presets or custom viewports, dark mode, retina scale, custom CSS and JavaScript, clicks, selector waits, delays, network idle, hidden selectors, headers, cookies, user agents, authorization, timezone, geolocation, transparent backgrounds, resizing, caching, signed links, asynchronous jobs, webhooks, bulk capture, usage data, and PDF settings.
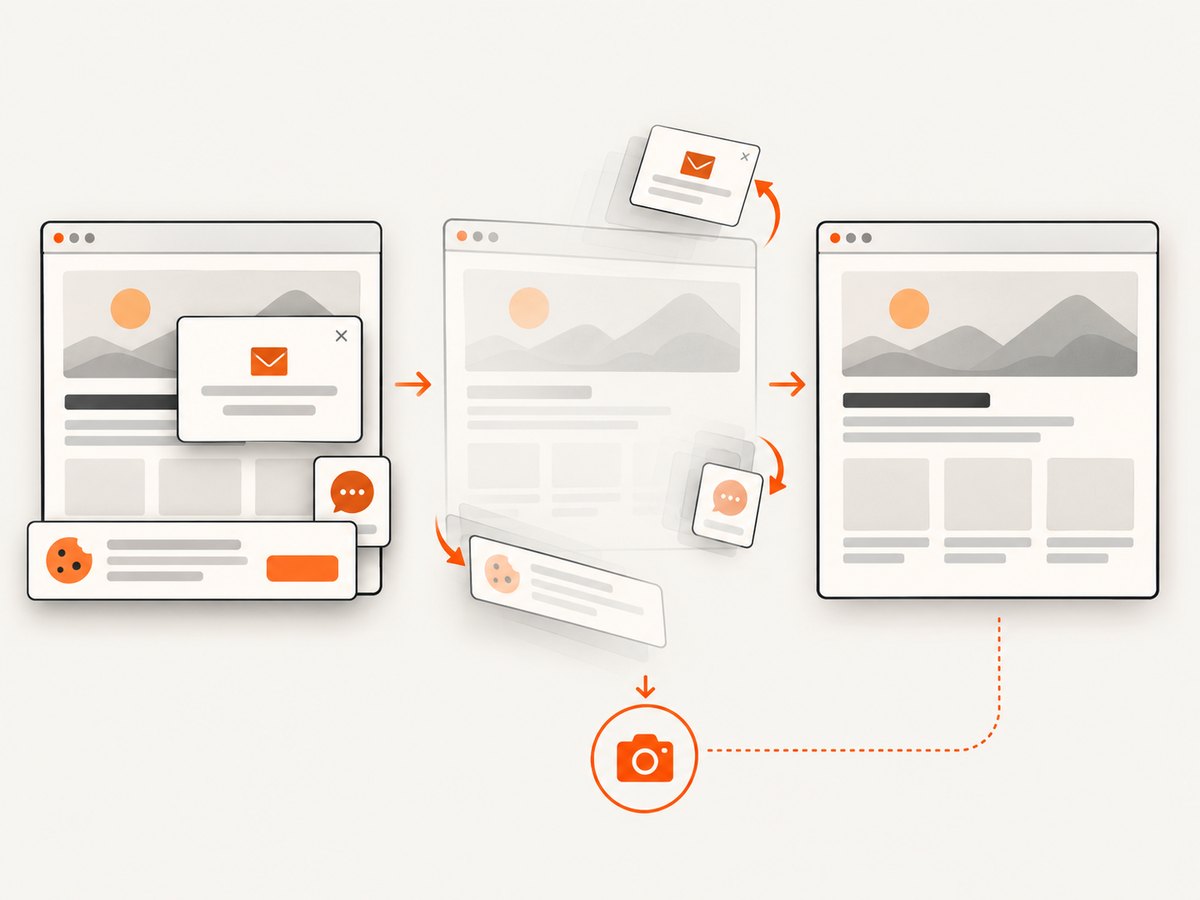
ScreenshotNeo removes cookie and consent banners, newsletter popups, and chat widgets before capture. Bot checks, blank pages, timeouts, failed loads, and cache hits are not billed; response headers identify the page verdict and billing result. Its MCP server provides take_screenshot, get_page_info, and capture_pdf tools for Claude, Cursor, and other MCP clients.
The Free plan includes 1,000 screenshots each month with no card. Paid plans start at $5 for 3,000 shots; yearly billing gives two months free, and every feature is available on every plan. Create a free ScreenshotNeo account.
10. Performance, reliability, and cost notes
- Use a focused test location while debugging so fewer workers and browser contexts compete for resources.
- Prefer UI Mode or traces for repeated diagnosis; they avoid keeping an interactive VS Code session open for every attempt.
- For screenshots, cache with a TTL when the page does not change frequently. Use async jobs and signed webhooks for long pages or batches.
- Bulk capture supports up to 100 URLs per call, which can reduce client-side orchestration.
- Check
X-Page-VerdictandX-Billedheaders when accounting for API usage. A cache hit or failed load should not be treated as a successful visual artifact. - Keep secrets such as API keys in environment variables or a secret store rather than source files.
FAQ
Is a paused Playwright test broken?
No. A breakpoint and page.pause() intentionally suspend execution until you resume.
Why does Stop leave my process running?
Attach sessions disconnect the debugger while leaving the target process alive. Launch sessions are managed by VS Code; a second Stop can force a non-terminating launched debuggee to exit.
Should I use Inspector or UI Mode?
Use Inspector for focused step-through debugging and locator work. Use UI Mode for test selection, watch mode, logs, network requests, DOM snapshots, and traces.
Can a trace replace live debugging?
For completed or failed runs, a trace often provides enough timeline and artifact detail to diagnose the action without another interactive session.
Can ScreenshotNeo run my Playwright test?
No. It captures URLs and returns images or PDFs. Use it when you need a clean page capture without managing a browser-debug session.


