Google Lighthouse: Measure Website Performance and Quality
Learn how to run Lighthouse audits, interpret performance and quality findings, and turn a repeatable baseline into focused improvements.
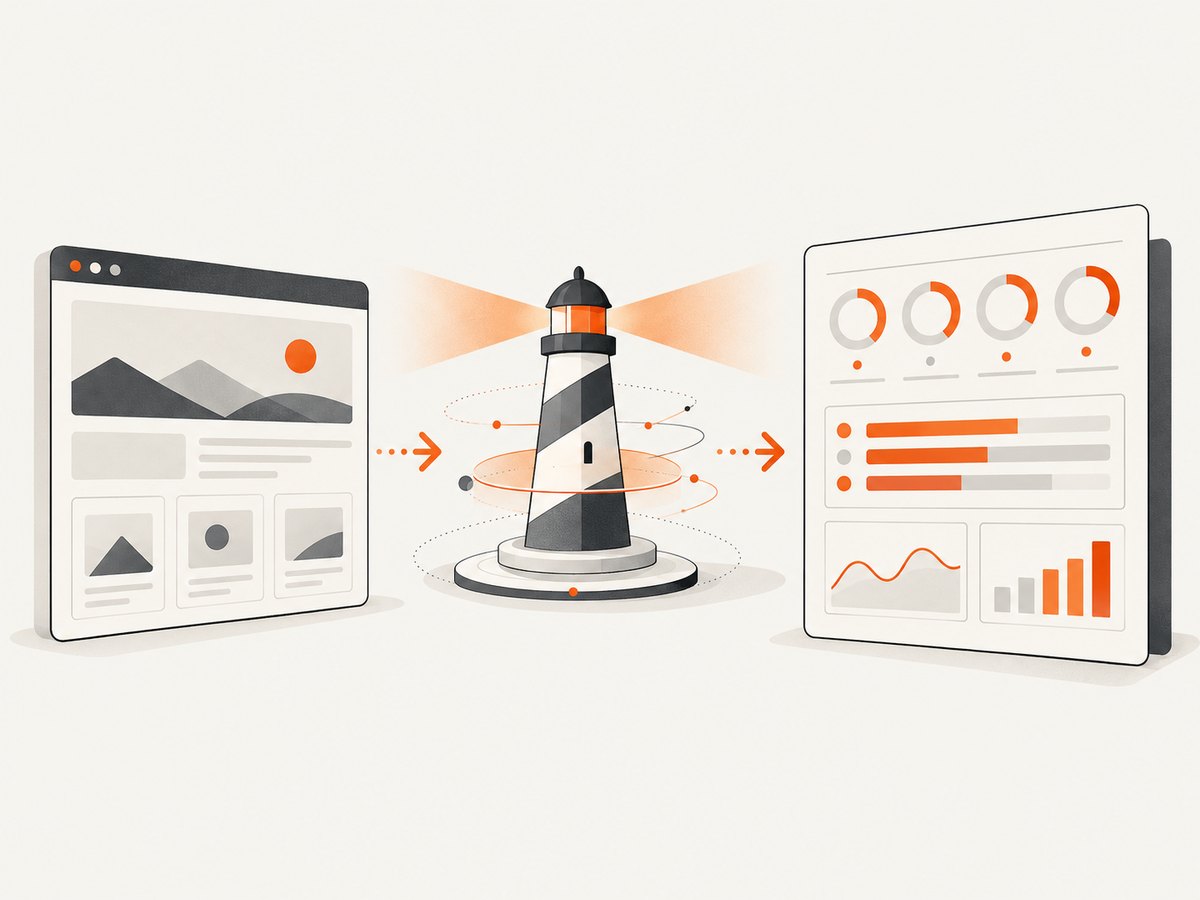
Google Lighthouse is a free, open-source audit tool for measuring aspects of a web page’s performance and quality. Run it in Chrome DevTools for an interactive report, through the command line or Node.js for automation, or in PageSpeed Insights for a web-based report. Start with a baseline, inspect the individual metrics and failed audits, make one targeted change, and rerun under similar conditions.
Lighthouse audits include Performance, Accessibility, Best Practices, and SEO. Its report is a diagnostic aid: a score is not a complete measure of every visitor’s experience, and an automated accessibility score cannot establish that a page works for every user. Chrome’s Lighthouse overview describes its workflows and capabilities.
1. Choose how to run Lighthouse
| Workflow | Best fit | Important constraint |
|---|---|---|
| Chrome DevTools | Interactive audits, local development, and pages that require login | Run it in the browser where the page and session are available. |
| Command line | Repeatable audits and shell scripts | Requires Node.js and Chrome installed. |
| Node.js module | Custom reporting or integration into a build workflow | Requires Node.js and Chrome installed. |
| PageSpeed Insights | A quick audit of a publicly reachable URL from a web interface | Use DevTools for local or authenticated pages. |
For a one-off check of a signed-in page, DevTools is usually the most direct option. Use the CLI when you want to save reports or repeat a check in a script. Use the Node API when your own code needs to process the report. Lighthouse CI is another documented option for preventing regressions in a project workflow.
2. Run an audit in Chrome DevTools
- Open the page in desktop Chrome. For a local project, start its development server and navigate to that local URL.
- Open DevTools and select the Lighthouse panel. It may be under the panels menu.
- Choose the categories you want to inspect. Performance, Accessibility, Best Practices, and SEO are useful starting points; turn off irrelevant categories to slightly shorten the audit.
- Select the device mode and other available settings. Use mobile when you need to assess a mobile-style viewport and conditions, or desktop for that environment.
- Run the audit and wait for the report. The report provides category scores, metrics, failed audits, opportunities, and diagnostics.
- Save or record the baseline, including the tested URL, device mode, and conditions. Change one thing, rerun, and compare.
The exact panel labels and settings can vary by Chrome version. In the documented DevTools workflow, options include clearing storage before the audit, enabling JavaScript sampling for more detailed call stacks, selecting simulated or DevTools throttling, choosing a navigation mode, and selecting device and categories. Clearing storage is useful for a first-visit baseline; disable it when you specifically want to inspect repeat-visit behavior. JavaScript sampling can add detail to the trace but may slow report generation. The DevTools tutorial explains these controls and the baseline-first workflow.
3. Run Lighthouse from the command line
Install Node.js and Chrome first. Install Lighthouse locally in a project or globally, then invoke it with the URL. The following uses a project-local installation:
npm install --save-dev lighthouse
npx lighthouse https://example.com --output html --output-path ./lighthouse-report.html
For a JSON report suitable for scripts, change the output format:
npx lighthouse https://example.com --output json --output-path ./lighthouse-report.jsonUse npx lighthouse --help to inspect the options supported by the version you installed. Flags let you control output formats, output paths, Chrome launch settings, and audit configuration. Pin the Lighthouse dependency version in a project lockfile when repeatability matters, because tool updates can change audits or scoring. Keep the Chrome environment consistent too.
To audit an authenticated local page, the CLI needs a way to access the same state as a logged-in browser. For an interactive local or authenticated audit, use DevTools; it can audit a page already open in your browser session. Avoid placing passwords or session cookies directly in shell history or committed scripts.
4. Run Lighthouse programmatically with Node.js
This example starts Chrome through Lighthouse, runs an audit, and writes the JSON report. It assumes Node.js and Chrome are available and uses an ES module file such as audit.mjs.
import fs from 'node:fs/promises';
import lighthouse from 'lighthouse';
import * as chromeLauncher from 'chrome-launcher';

const url = process.argv[2] ?? 'https://example.com';
const chrome = await chromeLauncher.launch({ chromeFlags: ['--headless'] });

try {
  const result = await lighthouse(url, {
    port: chrome.port,
    output: 'json',
    logLevel: 'info',
    onlyCategories: ['performance', 'accessibility', 'best-practices', 'seo'],
  });
  await fs.writeFile('lighthouse-report.json', result.report);
  console.log(`Saved Lighthouse report for ${url}`);
} finally {
  await chrome.kill();
}
Install the dependencies with npm install lighthouse chrome-launcher, then run node audit.mjs https://example.com. In a build environment, make the URL, output path, and selected categories configurable. Ensure Chrome is installed in that environment; CLI and Node workflows require it. Handle failed launches and nonzero process exits in your wrapper so a missing report does not silently look like a successful audit. For the module’s current API and advanced options, consult the Lighthouse project documentation and the version you have installed.
5. Interpret the report and choose what to fix
Performance: investigate metrics, not only the headline score
Lighthouse calculates its Performance score as a weighted average of metric scores. The score can fluctuate when conditions change: A/B tests, ads, network routing, device differences, browser extensions, or antivirus software can affect measurements. The scoring documentation says to consider performance as a distribution rather than relying on one score. Its published page includes historical version-specific weighting tables; do not assume those old percentages describe the Lighthouse version you are running. Check the scoring documentation for context and variability.
Use the metric details and the report’s linked explanations to understand what a finding means. Opportunities estimate potential improvements under the audit’s conditions; diagnostics provide additional clues. Neither should be treated as a guaranteed improvement for every user. Confirm a change with repeat runs and, where available to your team, real-user performance data.
Accessibility: follow automated findings with human review
The Accessibility score is based on automated audits that pass or fail, weighted by user impact. Manual audits and low-impact or best-practice audits do not affect the score. A high score cannot prove that every interaction works with assistive technology. Investigate failed checks, then manually review important flows with keyboard navigation and appropriate assistive technology. Chrome documents how accessibility scoring works.
Best Practices and SEO: treat failures as leads
Open the explanation attached to each failed audit. Confirm the issue in the page or its source before changing code. Audit results are indicators of issues Lighthouse checks; they are not a complete code review, SEO strategy, or substitute for checking the actual user experience.
6. Make comparisons useful and repeatable
- Record the page URL, date, Lighthouse and Chrome versions if known, selected device, and relevant settings.
- Keep the device class and browser setup consistent across comparisons.
- Close unrelated tabs and avoid extensions that modify pages or network traffic. If an audit errors, try an incognito window with no other tabs open.
- Run multiple audits when a small score change would affect a decision. Investigate whether ads, experiments, or network conditions changed.
- Change one thing at a time when possible, then rerun. This makes it easier to attribute a difference to the change.
- Review a representative set of important pages. One URL does not establish that every template or route performs the same way.
For a change that alters page content, a screenshot can help reviewers see what the page looked like at a point in time. A screenshot is visual evidence; it does not run Lighthouse or measure performance. ScreenshotNeo is a website screenshot API and MCP server that returns screenshots or PDFs from one request. Its output can accompany an audit report when a visual record is useful.
7. Troubleshooting common problems
| Problem | Likely cause | What to do |
|---|---|---|
| CLI says Chrome cannot be found or launched | Chrome is absent, inaccessible, or blocked in the environment. | Install Chrome and confirm the runtime can launch it. In containers and CI, configure the environment for browser execution and check the CLI help for supported Chrome flags. |
| DevTools audit errors or hangs | An extension, another open tab, or browser state may interfere. | Try incognito with no other tabs open, then rerun. Close resource-heavy applications if the machine is under load. |
| The score differs between runs | Device, network, ads, A/B tests, extensions, antivirus, or other conditions changed. | Match device and browser conditions, reduce interference, and compare underlying metrics over repeated runs. |
| Local page cannot be reached | The development server is not running, the URL or port is wrong, or the browser process cannot access that host. | Open the same URL in Chrome first. Check the server address, port, and whether the audit runs on the same machine or network. |
| Authenticated page redirects to login | The CLI or remote audit does not have the browser session used by your interactive login. | Run the audit in DevTools in the authenticated browser session. Do not expose credentials in command history or reports. |
| Accessibility score is high but a user flow still fails | Automated checks cover only a subset; manual audits do not contribute to the score. | Manually test the flow with keyboard navigation and assistive technology, and fix the observed issue. |
| Historic PWA checks appear in an old guide | Lighthouse PWA testing has been deprecated. | Do not rely on historic PWA audit results as a current installability checklist. Follow current PWA guidance. Chrome’s PWA audit documentation states the deprecation. |
8. Performance, reliability, and cost notes
Lighthouse is open-source software. Its practical cost is the developer time and compute needed to run audits, especially repeated browser launches in automation. Browser startup, page complexity, and unstable external resources can affect run duration and reliability. Limit audits to useful URLs and categories, reuse a controlled environment, and retain reports when you need a history of changes. Lighthouse does not promise that every run will produce an identical score.
Do not make a release decision from a single noisy score. Treat the audit as a repeatable check with known conditions, investigate material changes, and pair automated findings with manual review for areas the tool cannot fully assess. When automating, pin dependencies, capture process errors, and keep browser availability visible in CI logs.
Or skip the browser setup
For a visual record of a public page, ScreenshotNeo provides a one-call screenshot request. This captures an image; it does not replace Lighthouse’s performance, accessibility, Best Practices, or SEO audit. See the ScreenshotNeo API documentation.
curl -G "https://api.screenshotneo.com/v1/shot" -d access_key=YOUR_API_KEY --data-urlencode url=https://stripe.com -o shot.webpimport requests
r = requests.get("https://api.screenshotneo.com/v1/shot", params={"access_key": "YOUR_API_KEY", "url": "https://stripe.com"}, timeout=90)
open("shot.webp", "wb").write(r.content)const q = new URLSearchParams({ access_key: 'YOUR_API_KEY', url: 'https://stripe.com' });
const res = await fetch(`https://api.screenshotneo.com/v1/shot?${q}`);
if (!res.ok) throw new Error(`Screenshot request failed: ${res.status}`);
await import('node:fs/promises').then(fs => fs.writeFile('shot.webp', Buffer.from(await res.arrayBuffer())));ScreenshotNeo accepts cookie and consent banners like a visitor and removes more than 60 known consent platforms, newsletter popups, and chat widgets before capture; each step can be turned off. Bot checks, blank pages, and failed loads are never billed. Its MCP server gives AI agents screenshot tools. The Free plan includes 1,000 screenshots a month with no card, and paid plans start at $5 for 3,000. Sign up for 1,000 free screenshots a month with no card.
FAQ
Does Lighthouse test a page behind a login?
Yes. DevTools can audit an authenticated page open in your browser. The CLI and Node workflows need their own access to the page and may not share your interactive login.
Is PageSpeed Insights the same as real-user measurement?
No. It runs Lighthouse for a URL and presents a web-based report. Treat its audit as a diagnostic result, not a complete account of every visitor’s experience.
Should I aim for a perfect score?
Use the report to find and validate meaningful improvements. A single perfect score is not required to deliver a good experience, and the score can vary with test conditions.
Can ScreenshotNeo produce a Lighthouse report?
No. ScreenshotNeo captures screenshots or PDFs. Run Lighthouse separately for its audits and use screenshots only when a visual record helps explain a result.


