How to Show Highcharts Gridlines in wkhtmltoimage
Set Highcharts gridline options explicitly and wait for SVG rendering before wkhtmltoimage captures the page. This guide covers reliable code, timing, CSS, and fixes.
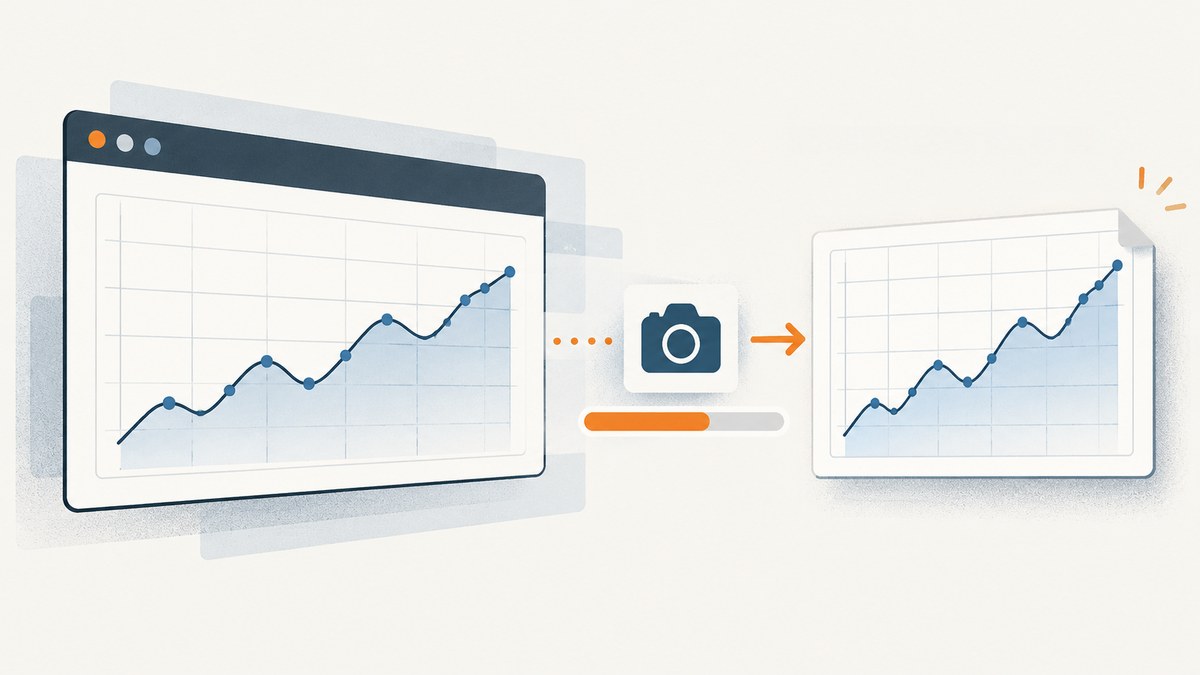
To show Highcharts gridlines in a wkhtmltoimage screenshot, configure the gridlines explicitly on each axis and make wkhtmltoimage wait until Highcharts has finished creating its SVG. The essential settings are gridLineWidth, gridLineColor, and optionally gridLineDashStyle. A deterministic capture uses a page-level ready flag with --window-status; a measured --javascript-delay is a practical fallback.
This distinction matters because wkhtmltoimage captures the page produced by an older browser engine. If it takes the screenshot before Highcharts runs, the chart can be empty. If the chart exists but its gridline styles depend on CSS that did not load, the plot may render without visible lines.
1. Configure gridlines in Highcharts
Highcharts controls gridlines per axis. Set the options on xAxis and yAxis rather than relying on a theme default. The following complete page creates a chart, draws solid light-gray gridlines, and sets a status value after the chart loads.
<!doctype html>
<html lang="en">
<head>
  <meta charset="utf-8">
  <title>Highcharts gridlines</title>
  <script src="https://code.highcharts.com/highcharts.js"></script>
  <style>
    html, body { margin: 0; padding: 0; }
    #container { width: 900px; height: 500px; }
  </style>
</head>
<body>
  <div id="container"></div>
  <script>
    Highcharts.chart('container', {
      title: { text: 'Weekly values' },
      chart: {
        events: {
          load: function () {
            // wkhtmltoimage waits for this value.
            window.status = 'highcharts-ready';
          }
        }
      },
      xAxis: {
        categories: ['Mon', 'Tue', 'Wed', 'Thu'],
        gridLineWidth: 1,
        gridLineColor: '#d9d9d9',
        gridLineDashStyle: 'Solid'
      },
      yAxis: {
        title: { text: 'Value' },
        gridLineWidth: 1,
        gridLineColor: '#d9d9d9',
        gridLineDashStyle: 'Solid'
      },
      series: [{
        name: 'Example',
        data: [1, 3, 2, 4]
      }]
    });
  </script>
</body>
</html>
Highcharts documents gridLineWidth, gridLineColor, and gridLineDashStyle as axis gridline controls. See the x-axis gridLineWidth API, gridLineColor API, and gridLineDashStyle API. The same options apply to yAxis.
Minor gridlines
For denser guides between major tick marks, use the corresponding minor settings: minorGridLineWidth, minorGridLineColor, and minorGridLineDashStyle. Minor lines only appear when the axis has a minor tick interval or minor ticks configured.
yAxis: {
  gridLineWidth: 1,
  gridLineColor: '#d9d9d9',
  minorTickInterval: 0.5,
  minorGridLineWidth: 1,
  minorGridLineColor: '#eeeeee',
  minorGridLineDashStyle: 'Dash'
}
Useful visual choices
| Goal | Settings |
|---|---|
| Hide gridlines | gridLineWidth: 0 |
| Light solid lines | gridLineWidth: 1, gridLineColor: '#d9d9d9', gridLineDashStyle: 'Solid' |
| Dashed guides | gridLineDashStyle: 'Dash' or 'Dot' |
| Dark-mode chart | Use a darker plot background and a low-contrast line such as 'rgba(255,255,255,0.2)' |
| Only horizontal guides | Set yAxis.gridLineWidth; set xAxis.gridLineWidth: 0 |
2. Make wkhtmltoimage wait for Highcharts
Gridline options cannot affect a screenshot until Highcharts has executed and inserted the SVG. Enable JavaScript and choose a readiness method.
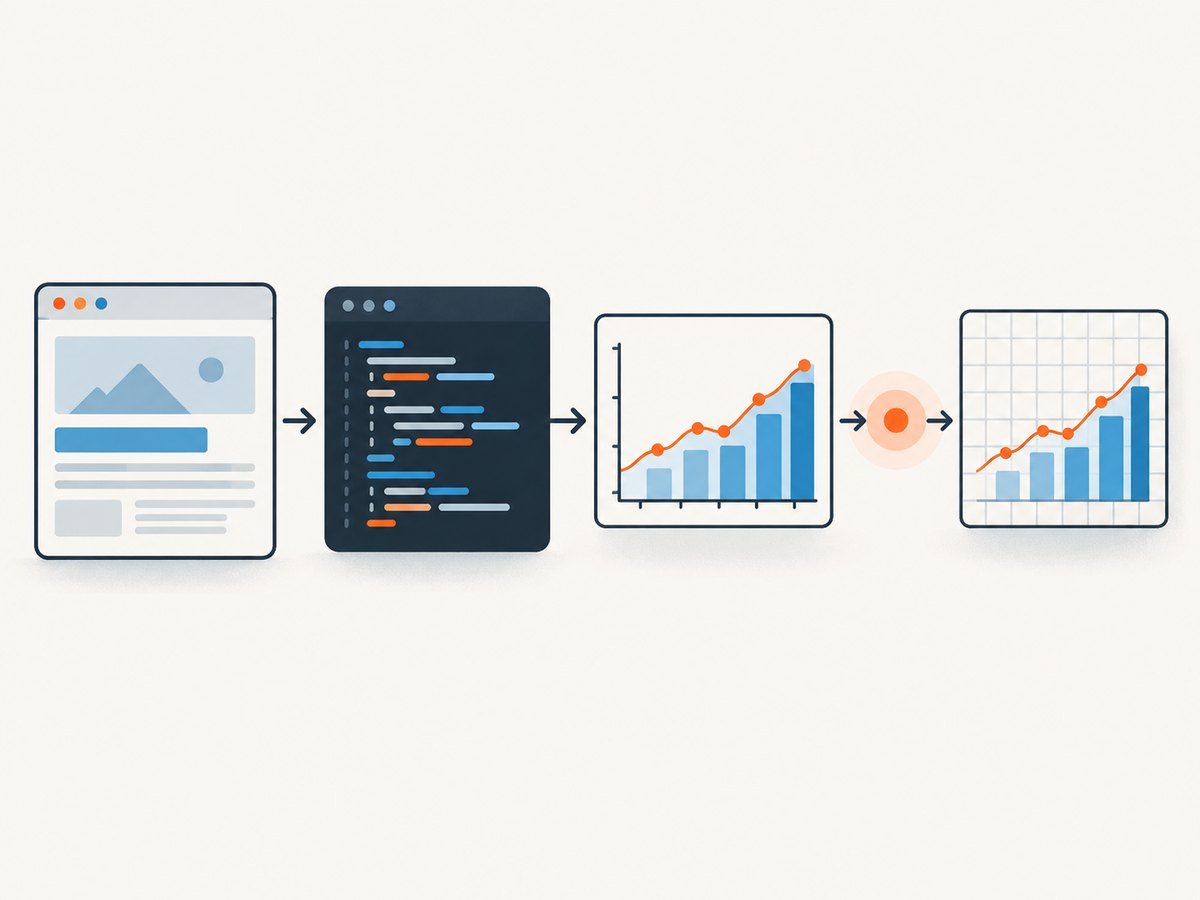
Deterministic method: window status
The page above sets window.status in the chart’s load event. Capture it with:
wkhtmltoimage \
  --enable-javascript \
  --window-status highcharts-ready \
  input.html output.png
--window-status tells wkhtmltoimage to wait until the browser status equals the supplied value. This is preferable when your data and chart initialization have a clear completion point.
Fallback method: measured delay
If you cannot modify the page to set a status, add a delay:
wkhtmltoimage \
  --enable-javascript \
  --javascript-delay 1500 \
  input.html output.png
Choose a delay longer than the time needed to load Highcharts, fetch data, and render the chart. A fixed delay is less predictable: a fast machine wastes time, while a slow network can still produce an incomplete image.
Run a script after loading
--run-script can execute a small JavaScript snippet in the page context. For example, if your page exposes a completion function:
wkhtmltoimage \
  --enable-javascript \
  --run-script "window.renderForCapture && window.renderForCapture()" \
  --javascript-delay 500 \
  input.html output.png
Use this only when the script is idempotent. It should not create a second chart or append duplicate series.
Background painting
By default, verify that the output includes the background you expect. Use --background to paint page backgrounds, or --no-background when you need transparency and the format supports it. A transparent background can make light gridlines appear to vanish against a white image viewer, so inspect the result on the intended background.
3. A complete local workflow
- Save the HTML as
input.html. - Open it in a normal browser and confirm that the gridlines are visible.
- Confirm the Highcharts script URL is reachable from the capture machine.
- Run wkhtmltoimage with
--enable-javascriptand the status gate. - Inspect the PNG at 100% scale; thin one-pixel lines can be hard to see in a thumbnail.
wkhtmltoimage \
  --enable-javascript \
  --window-status highcharts-ready \
  --width 900 \
  --height 500 \
  --format png \
  input.html highcharts-gridlines.png
If the chart is rendered from a remote page, use an absolute URL instead of a local file. If local assets are required by your build, check the installed wkhtmltoimage policy and file-access settings for your distribution before depending on them in production.
4. Styled mode: put gridline styles in CSS
When chart.styledMode is enabled, presentation is controlled by CSS. In that mode, set the SVG stroke on .highcharts-grid-line rather than expecting gridLineColor and gridLineWidth to provide the final appearance.
<style>
  .highcharts-grid-line {
    stroke: #d9d9d9;
    stroke-width: 1px;
  }
  .highcharts-minor-grid-line {
    stroke: #eeeeee;
    stroke-width: 1px;
  }
</style>
<script>
Highcharts.chart('container', {
  chart: { styledMode: true },
  xAxis: {},
  yAxis: {},
  series: [{ data: [1, 3, 2, 4] }]
});
</script>
Highcharts identifies .highcharts-grid-line as the styled-mode selector. Make sure the stylesheet is loaded before the ready status is set; otherwise wkhtmltoimage can capture the SVG before the stroke rules apply.
5. Asynchronous data and reliable readiness
A chart’s load event can fire before an asynchronous data request finishes if you create the chart with an empty series and add data later. Set the status only after the final data update and redraw.
const chart = Highcharts.chart('container', {
  xAxis: { gridLineWidth: 1, gridLineColor: '#d9d9d9' },
  yAxis: { gridLineWidth: 1, gridLineColor: '#d9d9d9' },
  series: [{ data: [] }]
});

fetch('/metrics.json')
  .then(response => {
    if (!response.ok) throw new Error(`HTTP ${response.status}`);
    return response.json();
  })
  .then(points => {
    chart.series[0].setData(points, true);
    window.status = 'highcharts-ready';
  })
  .catch(error => {
    document.body.dataset.captureError = error.message;
    window.status = 'highcharts-error';
  });
For a production pipeline, treat highcharts-error as a failed capture rather than silently saving a blank chart. A status value proves that your page reached a branch; it does not guarantee that every external image or font loaded successfully.
6. Troubleshooting missing gridlines
| Symptom | Likely cause | Fix |
|---|---|---|
| Blank output | JavaScript disabled or capture occurs too early | Add --enable-javascript and use --window-status or a delay. |
| Series visible, no gridlines | Axis width is zero, color matches the background, or a theme overrides the option | Set explicit width and color on the axis; inspect computed SVG styles. |
| Only one axis has lines | Options were added to xAxis but not yAxis, or vice versa |
Configure both axes independently. |
| CSS gridline rule ignored | Styled mode is disabled, or the stylesheet is not loaded | Use API options in normal mode; use .highcharts-grid-line in styled mode and verify CSS loading. |
| Lines appear in Chrome but not wkhtmltoimage | Legacy rendering-engine compatibility or unsupported CSS/SVG behavior | Use explicit SVG-friendly options, remove unsupported effects, or switch to Highcharts export tooling. |
| Chart is clipped | Viewport is smaller than the chart or labels | Set --width and --height explicitly and size the chart container. |
| Intermittent blank or partial chart | Remote script, data, font, or image request is slow | Use a readiness flag after all requests complete; avoid relying on a short fixed delay. |
| Transparent output looks wrong | Background is not painted or line contrast is too low | Use --background, choose a contrasting line color, or inspect on the final page background. |
Debugging checklist
- Confirm the Highcharts script loads before the chart code runs.
- Check the browser console for JavaScript exceptions.
- View the generated page source or DOM and verify that an SVG element exists.
- Inspect the SVG for
highcharts-grid-linepaths. - Check the axis options after chart creation:
chart.xAxis[0].options.gridLineWidth. - Increase the delay temporarily to distinguish timing from styling problems.
- Record the exact wkhtmltoimage version and distribution build; compatibility is not universal across every Highcharts and wkhtmltoimage combination.
7. Highcharts export as an alternative renderer
If the legacy wkhtmltoimage engine remains unreliable, Highcharts provides an export module and a Node-based export server. The export API can produce PNG, JPEG, PDF, and SVG, and exposes methods such as chart.exportChart() and chart.getSVG().
For command-line server rendering, Highcharts documents:
highcharts-export-server -infile chartConfig.json -outfile chart.pngThe input configuration contains the same axis gridline settings shown earlier. Highcharts also documents local client-side exporting as the default from version 12.3.0, controlled by exporting.local. This route avoids a wkhtmltoimage capture wait, but it introduces its own Node runtime and export-server maintenance requirements.
8. Or skip the browser setup
If your goal is a reliable image of a rendered chart rather than maintaining a wkhtmltoimage process, ScreenshotNeo provides a website screenshot API. You still configure Highcharts in the page, but the capture request is one HTTP call. Its cleanup step accepts cookie and consent banners like a visitor and removes more than 60 known consent platforms, newsletter popups, and chat widgets before the shot; each cleanup step can be disabled.
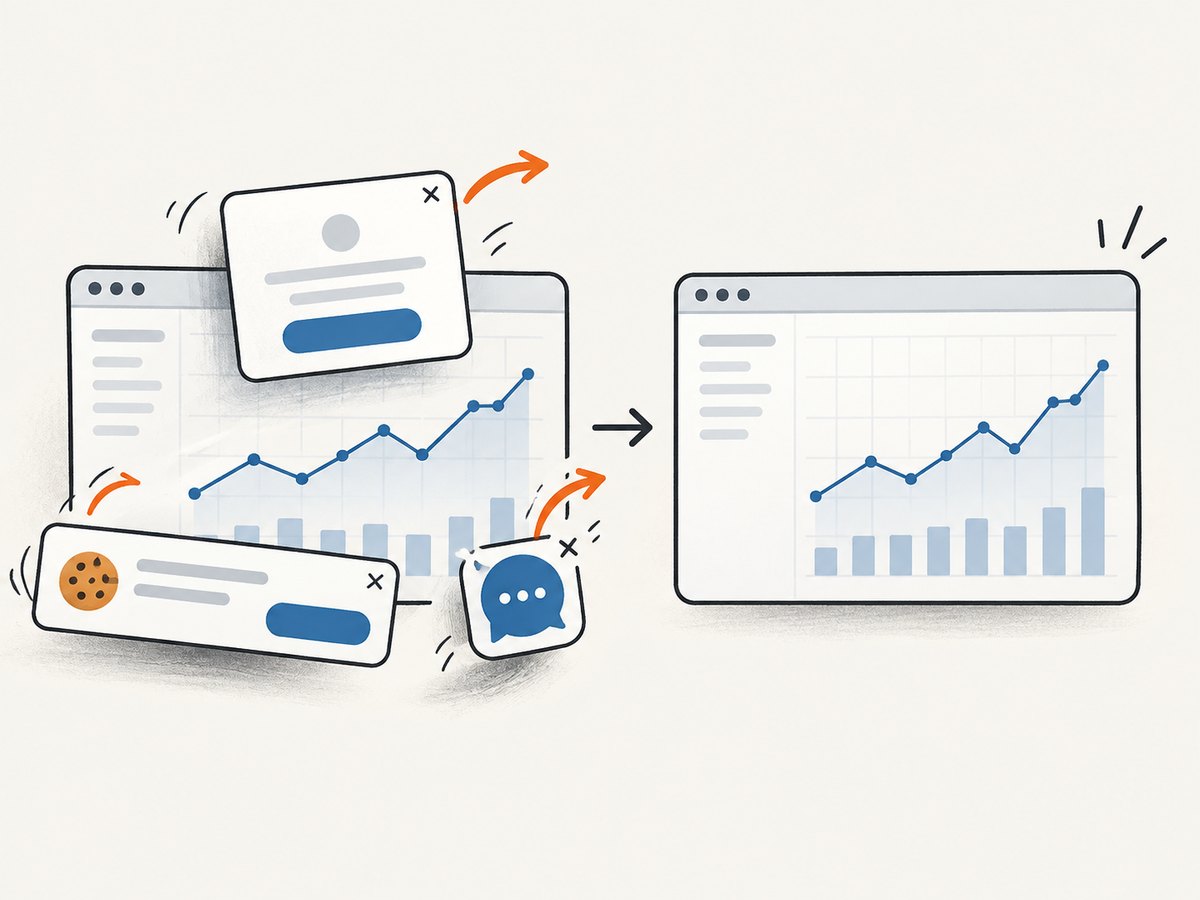
Only clean shots are billed. Bot checks and CAPTCHAs, blank pages, timeouts, failed loads, and cache hits cost nothing, and the response identifies the result with X-Page-Verdict and X-Billed headers. ScreenshotNeo also provides an MCP server with take_screenshot, get_page_info, and capture_pdf tools for Claude, Cursor, and other MCP clients.
See the ScreenshotNeo API documentation for all options. This request captures a rendered page as WebP:
curl -G "https://api.screenshotneo.com/v1/shot" \
  -d access_key=YOUR_API_KEY \
  --data-urlencode url=https://your-site.example/chart \
  -o chart.webp
import requests
r = requests.get(
"https://api.screenshotneo.com/v1/shot",
params={"access_key": "YOUR_API_KEY", "url": "https://your-site.example/chart"},
timeout=90,
)
r.raise_for_status()
open("chart.webp", "wb").write(r.content)const q = new URLSearchParams({
access_key: 'YOUR_API_KEY',
url: 'https://your-site.example/chart'
});
const res = await fetch(`https://api.screenshotneo.com/v1/shot?${q}`);
if (!res.ok) throw new Error(`HTTP ${res.status}`);
const bytes = new Uint8Array(await res.arrayBuffer());
// Save bytes as chart.webp in your application.You can pass a wait for a selector, a delay, or network idle; custom CSS and JavaScript; dark mode; a device preset or viewport; retina scale; custom headers, cookies, user agent, Authorization, timezone, and geolocation; and resource blocking for ads, trackers, requests, or resource types. Full-page capture loads lazy images, and caching lets you choose a TTL. Async jobs, signed webhooks, bulk capture for up to 100 URLs, usage reporting, an OpenAPI specification, and familiar parameter names make it practical to move an existing screenshot integration.
Free usage includes 1,000 screenshots per month with no card. Paid plans start at $5 for 3,000 shots; yearly billing gives two months free, and every feature is available on every plan. Create a free ScreenshotNeo account and start with the included 1,000 screenshots.
9. Performance, reliability, and cost notes
Capture performance
The largest delays usually come from loading Highcharts, fetching data, waiting for fonts, and rendering a large SVG. Keep the page focused, avoid unnecessary third-party scripts, and signal readiness immediately after the final chart update. A fixed delay should be measured against the slowest expected environment.
Reliability
Pin the wkhtmltoimage build in deployments and log its version. Run a small fixture page in CI that checks for a nonempty output and expected gridline paths. For remote pages, make failures observable: record status values, HTTP errors, and whether the chart contains the expected number of series.
Cost
Local wkhtmltoimage has no per-shot service charge, but you maintain the binary, fonts, browser compatibility, workers, retries, and storage. A hosted API trades that maintenance for usage pricing. With ScreenshotNeo, failed loads, blank pages, bot checks, timeouts, and cache hits are not billed, so inspect the response headers when reconciling usage.
10. FAQ
Why do I see gridlines in the browser but not in the PNG?
The capture usually occurs before the chart finishes, or the wkhtmltoimage engine handles the page’s CSS differently. Add a status gate, set explicit axis options, and test styled-mode CSS separately.
Can I show gridlines only on the y-axis?
Yes. Set yAxis.gridLineWidth to a positive value and set xAxis.gridLineWidth: 0.
Is a delay always required when using window status?
No. A status gate is intended to wait for your readiness signal. A short delay can still be useful for fonts or other resources that finish immediately after the chart event.
Should I use Highcharts export instead of wkhtmltoimage?
Use the export module or Node export server when you need a renderer maintained for Highcharts output. Keep wkhtmltoimage when you need a full-page browser capture and its command-line workflow fits your environment.
Can ScreenshotNeo capture a chart that needs authentication?
Yes. Its request options include custom headers, cookies, user agents, and Authorization. Configure the page so Highcharts can load its data, then use a selector, delay, or network-idle wait before capture.


