How to Open Chrome DevTools
Open Chrome DevTools with menus, shortcuts, Inspect mode, or a startup flag on Windows, macOS, Linux, and ChromeOS.
Chrome DevTools is built into Google Chrome. Open it by right-clicking a page element and choosing Inspect, using the Chrome menu, or pressing a keyboard shortcut. Use F12 or Ctrl+Shift+I on Windows and Linux, and Cmd+Option+I on macOS, to reopen the last-used panel.
For a specific element, right-click it and choose Inspect. To open the Console directly, use Ctrl+Shift+J on Windows/Linux or Cmd+Option+J on macOS. Chrome’s official reference covers these methods and additional workflows: Open Chrome DevTools.
Open DevTools from the Chrome menu
- Open the page you want to inspect in Chrome.
- Click the three-dot menu to the right of the address bar.
- Choose More Tools.
- Click Developer Tools.
Chrome reopens the last DevTools panel you used. If DevTools was last closed on Network, for example, this menu path opens Network again.
Use keyboard shortcuts
| Action | Windows/Linux | macOS | Result |
|---|---|---|---|
| Open or reopen DevTools | F12 or Ctrl+Shift+I | Cmd+Option+I | Opens the last-used panel |
| Open Console | Ctrl+Shift+J | Cmd+Option+J | Opens JavaScript logs and the command prompt |
| Activate Inspect mode | Ctrl+Shift+C | Cmd+Shift+C or Cmd+Option+C | Lets you select an element on the page |
On ChromeOS, use the Windows/Linux shortcuts. Laptop function keys may require holding Fn for F12; the Ctrl+Shift+I shortcut avoids that hardware difference.
Right-click an element and choose Inspect
- Move the pointer over the element you want to examine.
- Right-click it.
- Choose Inspect.
DevTools opens to the Elements panel and selects the corresponding DOM node. The Styles pane shows the CSS rules applied to that node, including overridden declarations. This is usually the fastest method when you already know which button, heading, image, or container you need.

Use Inspect mode to pick an element
- Open DevTools with a shortcut or the Chrome menu.
- Click the pointer-in-a-box Inspect button in the DevTools toolbar.
- Hover over the page. Chrome highlights the element under the pointer.
- Click the highlighted element.
The hover tooltip can show dimensions, applied styles, contrast information, accessibility role, and keyboard-focusability. Inspect mode is useful when nested elements make a context-menu click ambiguous.
Shortcut for Inspect mode
Press Ctrl+Shift+C on Windows, Linux, or ChromeOS. On macOS, press Cmd+Option+C; Cmd+Shift+C also activates element inspection in Chrome.
Open the Console directly
Use Ctrl+Shift+J on Windows/Linux or Cmd+Option+J on macOS. The Console displays JavaScript messages and provides a prompt where you can run expressions against the current page.
If DevTools is already open in another panel, the shortcut switches to Console. You can also open DevTools first and select Console from the panel tabs or the double-chevron overflow menu.
Open DevTools automatically for every new tab
Chrome supports the --auto-open-devtools-for-tabs startup flag. Quit Chrome completely, then launch a new Chrome instance with the command for your operating system:
macOS
open -a "Google Chrome" --args --auto-open-devtools-for-tabsWindows
start chrome --auto-open-devtools-for-tabsLinux
google-chrome --auto-open-devtools-for-tabsThe flag applies to the first Chrome instance launched and keeps DevTools opening for each new tab until Chrome is closed. If an existing Chrome process is still running, quit it before launching with the flag.
Which opening method should you use?
| Situation | Best method | Why |
|---|---|---|
| You need one particular element | Right-click and Inspect | Elements opens with that node selected |
| You need to select elements visually | Inspect mode | Hover highlighting makes nested DOM easier to identify |
| You need JavaScript logs or commands | Console shortcut | Console opens immediately |
| You want your previous workflow | Last-panel shortcut | Reopens the last-used DevTools panel |
| You are debugging every newly opened tab | Startup flag | DevTools opens automatically for each tab in that Chrome session |
Common problems and fixes
The shortcut does nothing
On some keyboards, function keys are assigned to hardware controls. Use Ctrl+Shift+I instead of F12, or hold Fn while pressing F12. Confirm that Chrome is the active application before using the shortcut.
The Console shortcut opens another application
Operating-system or keyboard utilities can reserve browser shortcuts. Open the three-dot menu, choose More Tools → Developer Tools, then click the Console tab.
Inspect is missing from the context menu
Some managed devices, embedded browsers, or pages that replace the context menu can prevent a normal right-click menu. Open DevTools from the Chrome menu or use the keyboard shortcut, then activate Inspect mode.
The startup command opens Chrome without DevTools
Make sure every existing Chrome window is closed before running the command. Use the executable name installed on your system, and launch the command in a terminal or command prompt rather than entering it in the address bar.
DevTools opens docked in an inconvenient position
Open the DevTools three-dot menu, choose a dock-side option, or select the undock icon to move DevTools into a separate window. Chrome remembers the selected layout.
The page changes when DevTools opens
Opening DevTools can change the available viewport width when it is docked. Use the device toolbar if you need to check a specific viewport, or undock DevTools to keep the page width unchanged.
Capture a page without setting up a browser
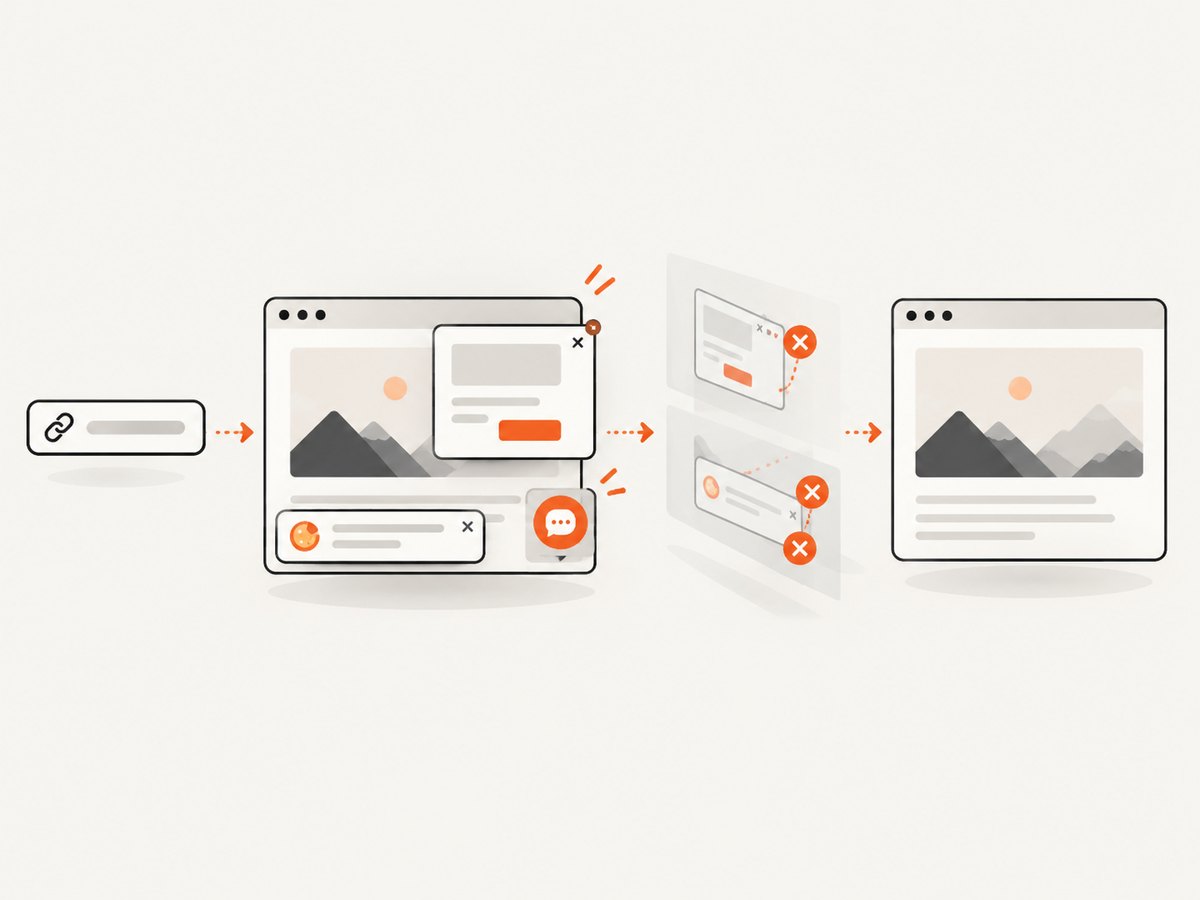
If your goal is a repeatable screenshot rather than interactive debugging, ScreenshotNeo provides a website screenshot API and MCP server. It accepts one GET request and returns PNG, JPEG, WebP, or PDF. Cookie and consent banners, newsletter popups, and chat widgets are removed before capture. Bot checks, blank pages, timeouts, failed loads, and cache hits are not billed, and the response reports the result with X-Page-Verdict and X-Billed headers.
Or skip the browser setup
See the ScreenshotNeo API documentation for all options. This minimal request captures a page:
cURL
curl -G "https://api.screenshotneo.com/v1/shot" -d access_key=YOUR_API_KEY --data-urlencode url=https://stripe.com -o shot.webpPython
import requests

r = requests.get(
    "https://api.screenshotneo.com/v1/shot",
    params={"access_key": "YOUR_API_KEY", "url": "https://stripe.com"},
    timeout=90,
)
r.raise_for_status()
open("shot.webp", "wb").write(r.content)
Node.js
const q = new URLSearchParams({ access_key: 'YOUR_API_KEY', url: 'https://stripe.com' });
const res = await fetch(`https://api.screenshotneo.com/v1/shot?${q}`);
if (!res.ok) throw new Error(`HTTP ${res.status}`);
const buffer = Buffer.from(await res.arrayBuffer());
require('fs').writeFileSync('shot.webp', buffer);
ScreenshotNeo also supports full-page captures with lazy images loaded, CSS-element capture, dark mode, device presets, custom viewports, retina scale, PDF paper settings, custom CSS and JavaScript, clicks, selector or network-idle waits, request blocking, headers, cookies, user agents, authorization, timezone, geolocation, transparent backgrounds, resizing, TTL caching, signed image links, asynchronous jobs with signed webhooks, bulk capture of up to 100 URLs per call, and a usage API. Every feature is included on every plan. An MCP server provides take_screenshot, get_page_info, and capture_pdf tools for Claude, Cursor, and other MCP clients.
The Free plan includes 1,000 screenshots per month with no card. Paid plans start at $5 for 3,000 shots; yearly billing gives two months free. Create a free ScreenshotNeo account.
Performance, reliability, and cost notes
- Use the keyboard shortcut or context menu when you need immediate interactive inspection; both avoid restarting Chrome.
- The startup flag is useful for repeatable debugging sessions, but it opens DevTools on every new tab in that session.
- For automated screenshots, wait for a selector, a delay, or network idle when content is rendered asynchronously. Full-page mode can load lazy images before capture.
- Use caching with a TTL when the same URL is captured repeatedly. Cache hits are not billed by ScreenshotNeo.
- Check
X-Page-VerdictandX-Billedin API responses so your application can distinguish a clean capture from a failed or non-billable result.
FAQ
Is Chrome DevTools a separate download?
No. DevTools is included with Google Chrome.
What opens with F12?
On Windows and Linux, F12 opens or reopens the last-used DevTools panel.
How do I inspect an element without a mouse?
Open DevTools, then press Ctrl+Shift+C on Windows/Linux/ChromeOS or Cmd+Option+C on macOS. Navigate the page and select the highlighted element.
Can DevTools open automatically?
Yes. Launch a newly started Chrome instance with --auto-open-devtools-for-tabs.
Does DevTools take a screenshot?
DevTools can support page debugging and capture workflows, but an API such as ScreenshotNeo is more suitable when your application needs repeatable, automated image or PDF output.


