How Website Monitoring System Software Works
Learn how website monitoring probes, validates failures, tests user journeys, alerts teams, and records performance across synthetic and real-user checks.
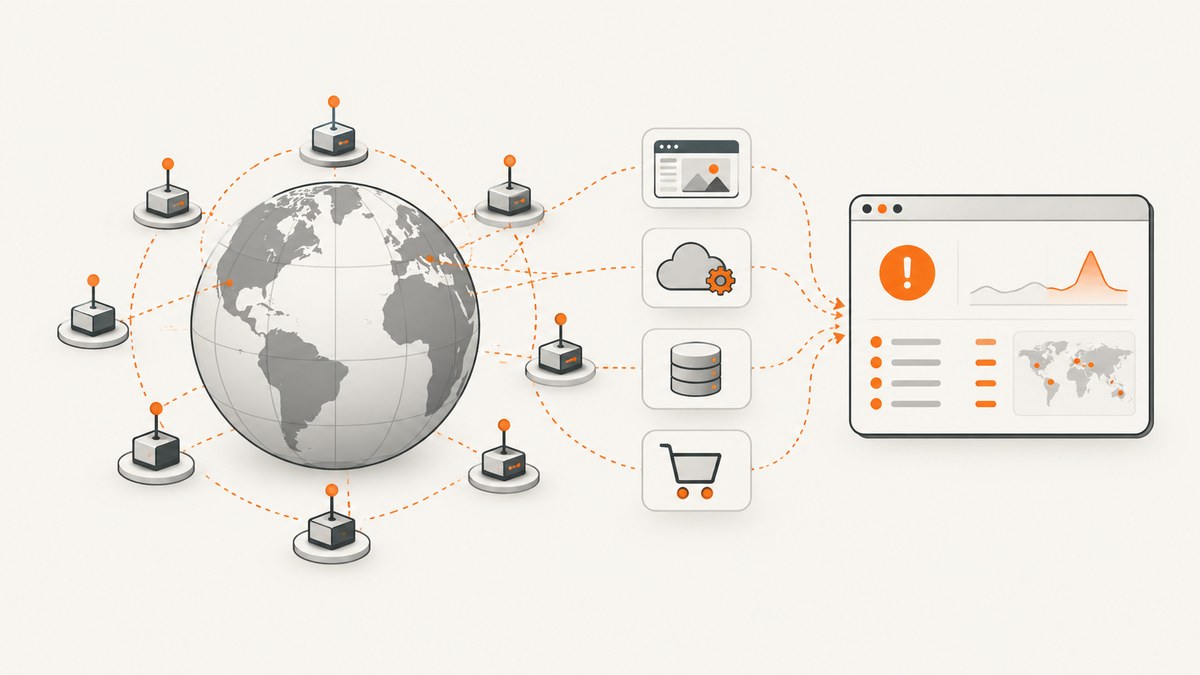
Website monitoring software checks your site from outside its infrastructure on a schedule. A probe sends an HTTP request, ping, TCP connection, DNS query, API request, or scripted browser journey. It measures availability and timing, validates the response against rules, confirms suspected failures, alerts the right people, and stores the results for analysis.
Monitoring is most useful when several check types work together. HTTP checks can show that a page responds, while browser checks prove that a visitor can log in or complete checkout. Synthetic checks provide repeatable observations; real-user monitoring (RUM) shows what actual devices, networks, and locations experienced.
1. The monitoring pipeline
Configure a target and rule
An operator defines what to check and what counts as success:
- A URL, IP address, hostname, API endpoint, or service port.
- An expected status code such as 200, a response-time limit, or required text in the body.
- Authentication headers, cookies, credentials, or a test account for protected systems.
- A certificate-expiry threshold for TLS monitoring.
- A scripted journey such as login, search, add to cart, and checkout.
- Retry count, sensitivity, maintenance windows, notification channels, and escalation delays.
Validation rules should match the failure you need to detect. A 200 response containing an error page is not a successful transaction, so combine status checks with content or business assertions.
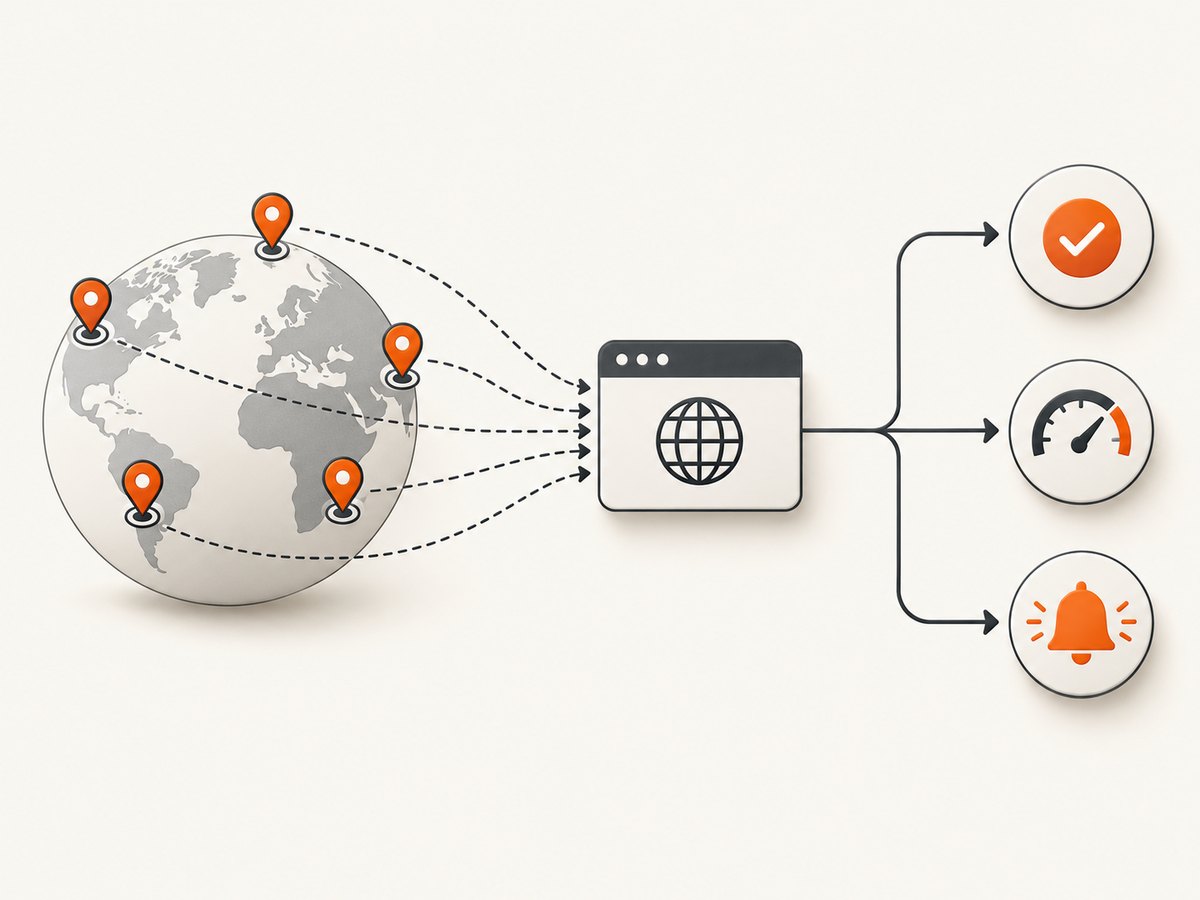
Run probes from selected locations
Synthetic probes run from one or more geographic locations at a configured interval. Multiple regions help distinguish a global outage from a routing, DNS, firewall, or regional provider problem. The probe records timestamps for DNS resolution, connection, TLS negotiation, time to first byte, download, and (for browser checks) page actions.
Measure and validate
| Check | What it proves | What it cannot prove alone |
|---|---|---|
| HTTP/HTTPS | Status, headers, body text, and latency | That a user can complete a multi-step workflow |
| ICMP ping | Network reachability | That the application or web server is healthy |
| TCP port | That a service port accepts connections | That the protocol or application is functioning correctly |
| DNS | That a hostname resolves as expected | That the resolved service returns valid content |
| SSL/TLS | Certificate validity and approaching expiry | That the site serves every route correctly |
| API | Request, authentication, response, and assertions | Browser rendering and client-side behavior |
| Browser transaction | Controlled user actions and visible outcomes | Every device and network condition visitors have |
| RUM | Actual visitor experience by device, network, and region | A repeatable test before any visitor arrives |
Replay critical journeys
Browser monitors use a controlled browser to perform actions an end user would make. A useful checkout journey might open the store, sign in with a dedicated test account, add a known item, enter test payment details, and assert that the confirmation page appears. Keep test accounts and data isolated from production customers, and make destructive actions impossible or reversible.
Confirm failures before alerting
Transient DNS errors, packet loss, deploys, and overloaded probes can create false positives. Monitoring systems commonly retry, require several failed attempts, or compare results from multiple regions before opening an incident. Tune sensitivity to the cost of delay: a payment path may need fast confirmation, while a low-risk marketing page can tolerate more retries.
Alert, escalate, and preserve history
After a confirmed breach, the system records an incident and can notify email, Slack, SMS, webhooks, or other integrations. Escalation rules contact additional responders when an incident remains unresolved. Maintenance windows suppress alerts during planned work. Dashboards expose uptime, response time, latency by region, incident timelines, and historical trends; some products retain regional graphs for up to 90 days.
2. Synthetic monitoring versus real-user monitoring
Synthetic monitoring generates repeatable observations under controlled conditions. It detects failures before visitors encounter them and makes regressions comparable over time. Real-user monitoring records actual sessions, so it captures device types, browser versions, networks, locations, and conditions that a scripted probe cannot reproduce.
Use both layers when the experience matters. A synthetic check can be green while users on a particular mobile network see slow JavaScript or a broken feature. RUM can reveal that pattern; a synthetic journey can then provide a stable regression test for the affected path.
SolarWinds describes digital experience monitoring as tracking external websites and URI endpoints with synthetic methods or real-user activity. Elastic describes real-browser synthetic monitoring as testing critical actions and requests an end user would make at predefined intervals in a controlled environment.
3. Choosing the right check types
Availability and infrastructure checks
- HTTP/HTTPS: Check status code, body text, headers, redirects, and latency.
- Ping: Detect basic network reachability, while remembering that a reachable host can still have a failed application.
- TCP: Confirm that a service port accepts connections.
- DNS: Validate records, resolution, and propagation from several regions.
- SSL/TLS: Alert before certificates expire or become invalid.
API and application checks
API monitors send one or more requests with authentication and assertions. Validate status, JSON fields, values, response time, and relationships between calls. For example, create a test object, retrieve it, verify its state, and delete it if the API permits cleanup.
Browser and transaction checks
Use browser checks for login, registration, search, cart, checkout, account management, and other workflows where JavaScript, cookies, redirects, or rendered content matter. Give each step a clear wait condition and assertion so failures identify the broken action instead of merely reporting a timeout.
Cron and heartbeat checks
A scheduled job calls a unique heartbeat URL when it finishes. The monitor alerts if the expected report does not arrive within a grace period. This detects silent failures in imports, backups, queues, and scheduled reports.
4. A practical monitoring design
- Inventory public pages, APIs, DNS zones, certificates, and business-critical journeys.
- Assign an owner and severity to each target.
- Start with HTTP, DNS, and TLS checks for every public service.
- Add API assertions for machine-to-machine dependencies.
- Add browser journeys for the few workflows that directly affect revenue or support volume.
- Select probe regions that represent customers and important network paths.
- Set intervals, timeouts, retries, and sensitivity based on impact and acceptable detection delay.
- Define alert routing, escalation, maintenance windows, and incident webhooks.
- Review latency and failure history regularly, then adjust thresholds when normal behavior changes.
5. DIY browser monitoring example
The following Playwright example checks a login page and a post-login element. Install Playwright with npm install playwright, then run npx playwright install chromium.
const { chromium } = require('playwright');

(async () => {
  const browser = await chromium.launch({ headless: true });
  const page = await browser.newPage({
    viewport: { width: 1440, height: 900 },
    timezoneId: 'UTC'
  });

  try {
    await page.goto('https://example.com/login', { waitUntil: 'networkidle', timeout: 30000 });
    await page.fill('input[name="email"]', process.env.MONITOR_EMAIL);
    await page.fill('input[name="password"]', process.env.MONITOR_PASSWORD);
    await page.click('button[type="submit"]');
    await page.waitForURL('**/account', { timeout: 15000 });
    await page.locator('[data-testid="account-home"]').waitFor({ state: 'visible', timeout: 10000 });
    console.log(JSON.stringify({ ok: true, url: page.url() }));
  } catch (error) {
    console.error(JSON.stringify({ ok: false, message: error.message }));
    process.exitCode = 1;
  } finally {
    await browser.close();
  }
})();
Replace selectors and URLs with stable attributes from your application. Store credentials in the monitor’s secret store or environment, never in source control. Add a screenshot, trace, or console-log artifact on failure so responders can diagnose the exact state.
6. Or skip the browser setup
ScreenshotNeo provides a website screenshot API and MCP server. One request captures a PNG, JPEG, WebP, or PDF while handling browser setup for you. See the ScreenshotNeo API documentation for all options.
curl -G "https://api.screenshotneo.com/v1/shot" -d access_key=YOUR_API_KEY --data-urlencode url=https://stripe.com -o shot.webpimport requests
r = requests.get("https://api.screenshotneo.com/v1/shot", params={"access_key": "YOUR_API_KEY", "url": "https://stripe.com"}, timeout=90)
open("shot.webp", "wb").write(r.content)const q = new URLSearchParams({ access_key: 'YOUR_API_KEY', url: 'https://stripe.com' });
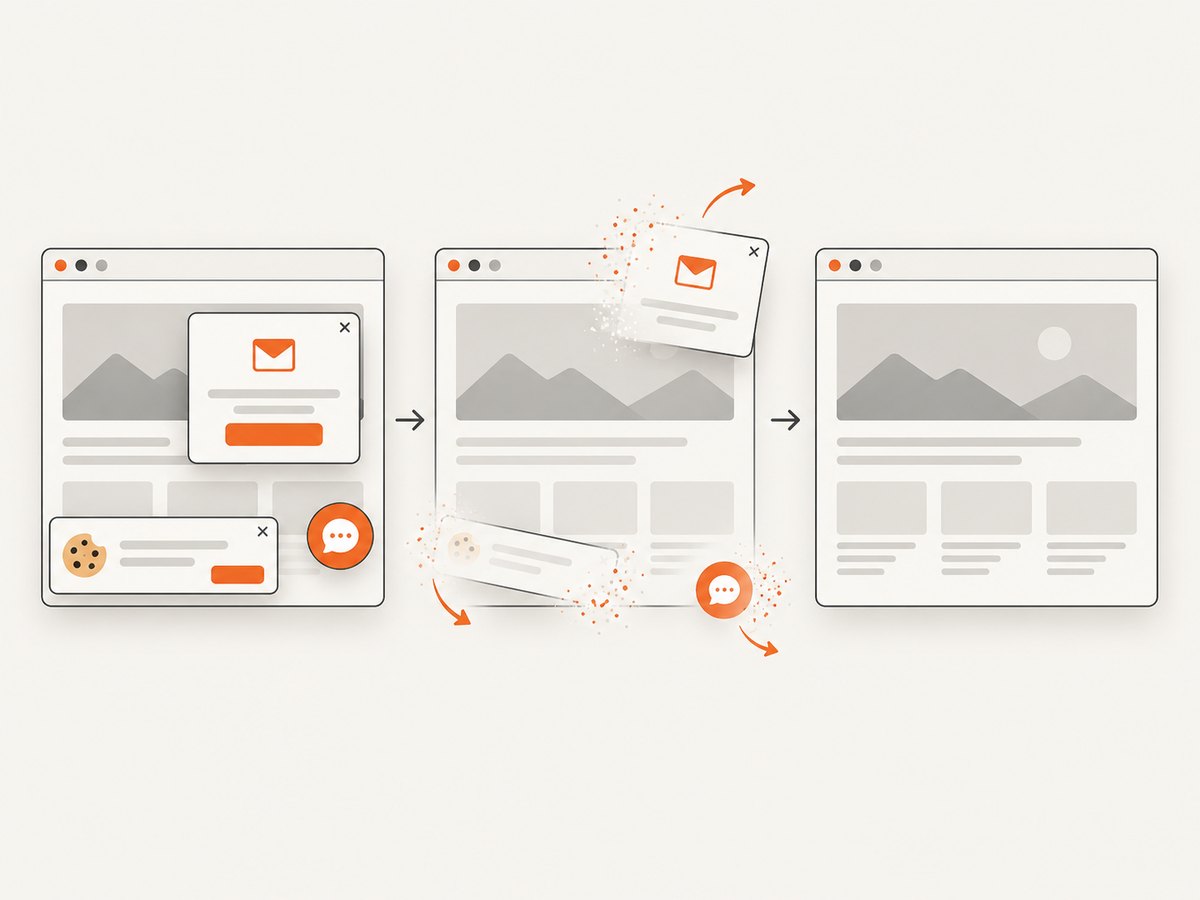
const res = await fetch(`https://api.screenshotneo.com/v1/shot?${q}`);Before capture, ScreenshotNeo accepts cookie or consent banners and removes more than 60 known consent platforms, newsletter popups, and chat widgets; each step can be disabled. Bot checks, blank pages, timeouts, failed loads, and cache hits are not billed, and response headers identify the page verdict and whether the shot was billed. Its MCP server provides take_screenshot, get_page_info, and capture_pdf tools for Claude, Cursor, and other MCP clients. The free plan includes 1,000 screenshots per month with no card; paid plans start at $5 for 3,000 shots. Create a free ScreenshotNeo account.
7. Reliability, performance, and cost
- Reliability: Use more than one probe region, retries, and corroboration for important alerts. Keep maintenance windows current.
- Performance: Separate availability latency from browser rendering time. Track DNS, connection, TLS, server response, download, and client-side action timings.
- Load: Keep intervals proportional to risk. High-frequency browser checks consume more compute and can add traffic to your application.
- Test safety: Use dedicated accounts, non-destructive data, idempotent actions, and cleanup steps.
- Privacy: Minimize captured personal data, redact secrets, and choose probe locations and retention to meet your requirements.
- Cost: Compare check interval, number of locations, browser minutes, API volume, retention, alert integrations, and RUM event volume. A simple HTTP check is usually cheaper than a full browser journey, so reserve browser coverage for critical paths.
8. Troubleshooting common monitoring failures
| Symptom | Likely cause | Fix |
|---|---|---|
| False outage during deploys | No maintenance window or too little confirmation | Schedule maintenance and require retries or regional agreement. |
| Ping is green but site is broken | Host is reachable while the application failed | Add HTTP, API, or browser assertions. |
| Browser step times out | Unstable selector, missing wait condition, slow dependency, or bot challenge | Use stable selectors, explicit waits, a longer bounded timeout, and capture diagnostics. |
| Login check fails intermittently | Expired credentials, MFA, rate limiting, or shared test state | Use a dedicated account, rotate secrets, isolate runs, and provide a test authentication path. |
| Alerts arrive too late | Long interval, excessive retries, or a slow escalation policy | Shorten the interval or confirmation window for high-severity checks. |
| Different regions disagree | DNS propagation, CDN routing, firewall rules, or regional dependency | Compare phase timings and response bodies by region before declaring a global incident. |
| Certificate alert is missed | Threshold is shorter than the notification lead time | Set an earlier threshold and verify the renewal process with a test alert. |
9. FAQ
How often should a website be monitored?
Choose the shortest interval that matches the business impact and your traffic budget. Critical checkout and API paths generally need more frequent checks than brochure pages.
Can monitoring software prove that every visitor is unaffected?
No. Synthetic probes sample controlled conditions. RUM is needed to understand the variety of real devices, networks, browsers, and locations.
Why use content assertions when the status code is 200?
Applications often return a friendly error page, login redirect, or maintenance document with a successful HTTP status. Content and business assertions detect those cases.
Should a monitor follow redirects?
Usually yes for a public page, but assert the final host and content so an unexpected redirect to a login, parked domain, or error page is visible.
What is the first monitor to create?
Start with an HTTPS check that validates status, expected text, latency, TLS expiry, and at least one customer-facing region. Add API and browser checks as you map dependencies.


