How to Improve Chart Quality in wkhtmltopdf PDFs
Fix blurry, clipped, or missing charts in wkhtmltopdf with vector output, explicit sizing, print CSS, and deterministic JavaScript waits.
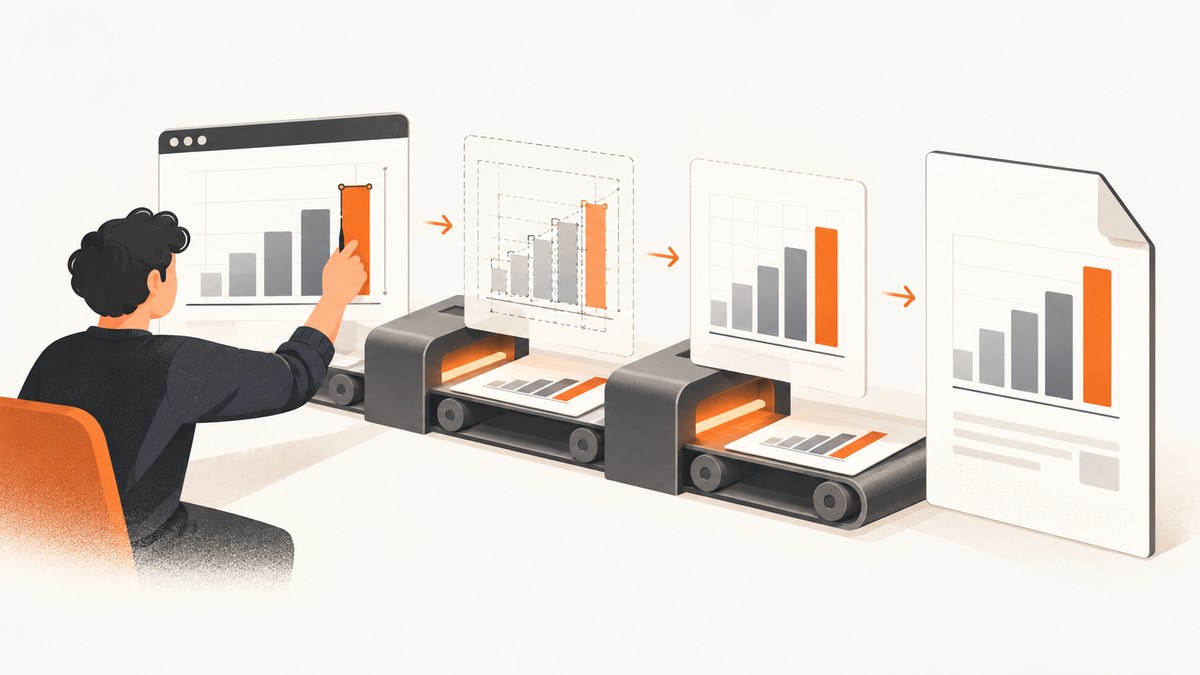
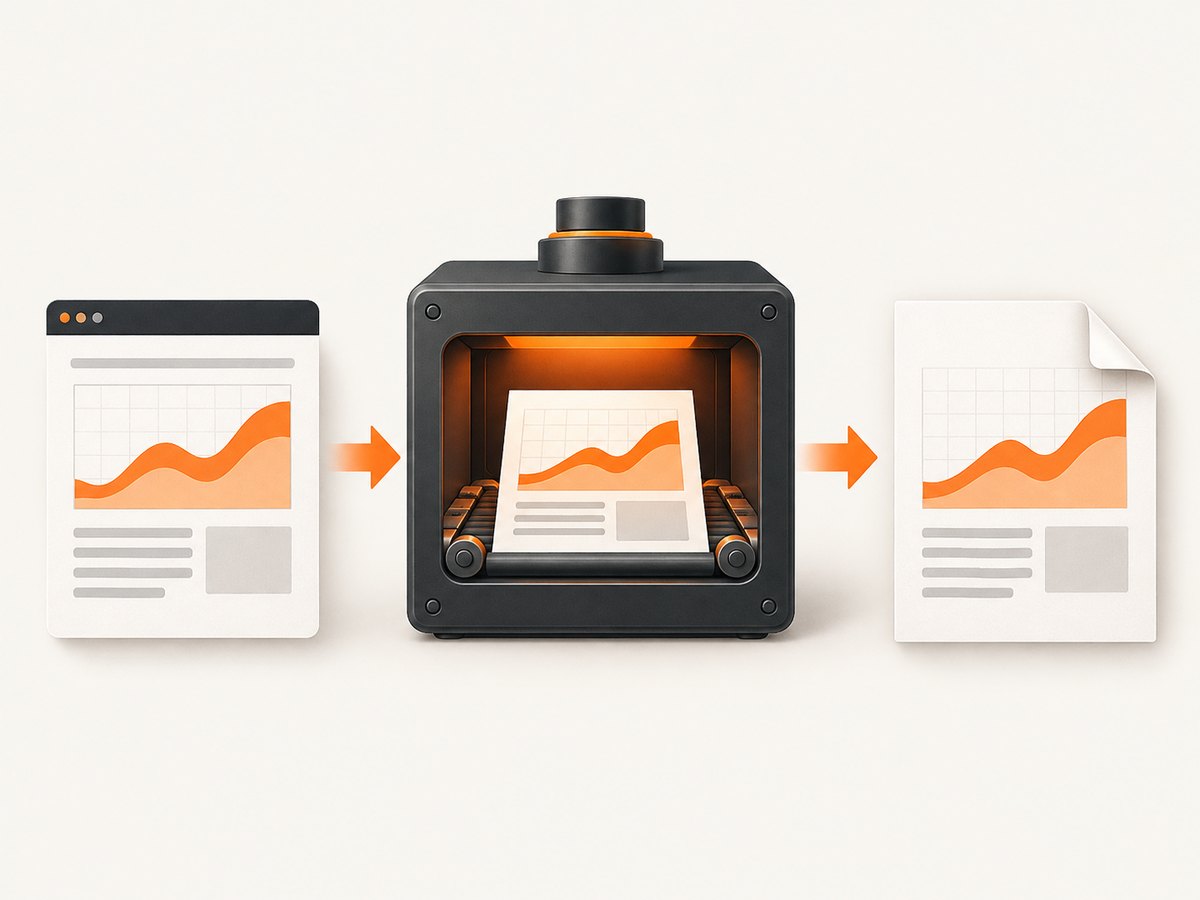
Blurry charts in wkhtmltopdf usually come from a raster image that is too small, automatic shrinking, an undersized chart viewport, or exporting before JavaScript finishes drawing. The most reliable fix is to render charts as SVG, give the chart and PDF page explicit dimensions, control zoom and shrinking, wait for a deterministic ready signal, and validate the result at its intended print size.
wkhtmltopdf is an open-source command-line tool that renders HTML and PDF through the Qt WebKit engine. Its manual describes the PDF command as converting HTML pages with patched Qt WebKit. That older rendering stack is useful and predictable when its layout, loading, and scaling rules are made explicit.
1. Start with a controlled baseline
Save this minimal HTML as chart.html. The explicit SVG dimensions prevent the renderer from guessing the chart size.
<!doctype html>
<html>
<head>
  <meta charset='utf-8'>
  <style>
    @page { size: A4 landscape; margin: 12mm; }
    html, body { margin: 0; padding: 0; }
    .chart { width: 1050px; height: 560px; }
  </style>
</head>
<body>
  <svg class='chart' viewBox='0 0 1050 560' role='img' aria-label='Revenue by month'>
    <rect width='1050' height='560' fill='white'/>
    <!-- Replace this example with output from your chart library. -->
    <polyline points='80,450 250,360 420,390 590,250 760,290 950,130'
      fill='none' stroke='#1769aa' stroke-width='4'/>
    <g fill='#1769aa'>
      <circle cx='80' cy='450' r='6'/>
      <circle cx='250' cy='360' r='6'/>
      <circle cx='420' cy='390' r='6'/>
      <circle cx='590' cy='250' r='6'/>
      <circle cx='760' cy='290' r='6'/>
      <circle cx='950' cy='130' r='6'/>
    </g>
  </svg>
</body>
</html>
Convert it with a wide page, explicit viewport, and no smart shrinking:
wkhtmltopdf \
  --page-size A4 \
  --orientation Landscape \
  --margin-top 12mm --margin-right 12mm \
  --margin-bottom 12mm --margin-left 12mm \
  --viewport-size 1200x800 \
  --disable-smart-shrinking \
  chart.html chart.pdf
Open the PDF at 100% zoom. If labels are readable there, check a printed page as well. A screenshot viewed only at a zoomed-out level can hide clipping, thin strokes, and small type.
2. Prefer SVG for lines, labels, and markers
SVG stores chart geometry and text instead of baking everything into a small bitmap. When your chart library supports SVG output, use it for axes, labels, legends, and data marks. This is an engineering recommendation based on wkhtmltopdf accepting HTML and SVG content; individual SVG features can vary in the Qt WebKit version you use.
If a library can export only PNG or JPEG, render the source at least two times the final displayed pixel dimensions, then downsample once. For a chart displayed at 1050 by 560 CSS pixels, a 2100 by 1120 source gives the rasterizer more information. Avoid repeatedly resizing an already compressed image. Keep text as HTML or SVG when possible.
3. Make page and chart dimensions agree
Quality problems often begin as layout problems. Choose the physical page first, then calculate the usable chart area after margins. Give the chart a matching CSS width and height, and set an SVG viewBox that preserves its aspect ratio.
| Goal | Settings | Why it helps |
|---|---|---|
| Wide time series | --orientation Landscape or --page-width |
Provides horizontal room for labels and legends. |
| Fixed paper format | --page-size A4, Letter, or another supported size |
Creates a known printable area. |
| Custom report sheet | --page-width and --page-height |
Lets CSS pixels map to a deliberate page geometry. |
| Predictable CSS mapping | --disable-smart-shrinking |
Prevents automatic shrinking from changing the pixel-to-DPI relationship. |
| Controlled enlargement | --zoom 1.0 (default is 1) |
Sets the scale explicitly when a different scale is required. |
| More layout context | --viewport-size 1200x800 |
Controls the viewport used while responsive CSS and charts run. |
Smart shrinking is enabled by default in many builds. The manual explains that it makes the pixel/DPI ratio non-constant. Turning it off makes CSS-pixel sizing easier to reason about, but you must provide suitable page dimensions and margins. If the chart is clipped after disabling it, reduce the chart width, increase the page width, or reduce margins.
4. Wait for JavaScript charts deterministically
JavaScript is enabled by default, and the documented --javascript-delay default is 200 milliseconds. That delay is only a timing cushion. It can be too short for a slow API, web font, large dataset, or expensive chart animation.
Use a longer delay for simple pages
wkhtmltopdf \
  --javascript-delay 1500 \
  --page-size A4 --orientation Landscape \
  chart.html chart.pdf
Use window.status for repeatable exports
A status signal is better when rendering time varies. Set it only after data, fonts, and drawing are complete:
<script>
  async function drawChart() {
    const response = await fetch('/data/revenue.json');
    const data = await response.json();
    renderChart(data);             // Your chart library call
    await document.fonts.ready;    // Wait for web fonts when supported
    window.status = 'chart-ready';
  }
  drawChart().catch(() => { window.status = 'chart-error'; });
</script>
wkhtmltopdf \
--window-status chart-ready \
--javascript-delay 5000 \
chart.html chart.pdfKeep a finite delay even with a status value so a broken page does not wait forever. Disable animations in print CSS or configure the chart library to draw one final frame. A chart that is still animating can be captured with missing series or partially painted labels.
5. Use print CSS deliberately
Screen styles often reserve space for toolbars, responsive cards, or hover controls. The --print-media-type option switches from screen media to print media; screen media is the default. Put PDF-specific dimensions, colors, and visibility rules in a print block:
@media print {
  .chart-card { width: 270mm; height: 150mm; }
  .chart-toolbar, .tooltip, .interactive-legend { display: none !important; }
  .chart svg { width: 270mm; height: 150mm; }
  .chart, .chart * { animation: none !important; transition: none !important; }
  .chart { break-inside: avoid; page-break-inside: avoid; }
}
wkhtmltopdf --print-media-type chart.html chart.pdfDo not use a print rule that sets a chart to display: none or reduces its opacity. Check both media modes if the same page is also used interactively.
6. Tune raster images and PDF quality
The current manual documents a default --dpi of 96, --image-dpi of 600, and JPEG --image-quality of 94. These settings affect raster inputs and PDF image encoding; they cannot recreate detail that was absent from the source image.
- Keep source PNG dimensions high enough for the final physical size.
- Avoid
--lowqualitywhen labels or thin lines matter. - Use
--image-quality 94or a deliberately chosen value for JPEG sources. - Use PNG for flat lines, transparent backgrounds, and small text; use JPEG for photographic backgrounds where compression artifacts are acceptable.
- Do not confuse
--dpiwith a chart’s CSS width. DPI changes output interpretation; CSS dimensions determine layout.
Qt’s documentation notes that screen resolution produces lower-quality output than high resolution and is intended for drafts. Treat high-resolution output as a final-export setting, then inspect the actual PDF rather than relying on the option name.
7. Make every asset reachable
Missing fonts, scripts, images, and JSON data can make a chart look blurry or incomplete because the renderer falls back to a different font or captures an empty canvas. Confirm that every URL works from the machine running wkhtmltopdf. For local files, review --enable-local-file-access and any --allow paths required by your build. Capture stderr and investigate failed-resource messages.
Use absolute URLs or a controlled base URL for assets. If a chart depends on an authenticated endpoint, pass the required cookie or header through your application, or generate a self-contained HTML file with data embedded. Avoid relying on a browser session that wkhtmltopdf cannot see.
8. Complete command-line recipes
Local HTML with SVG
wkhtmltopdf \
  --enable-local-file-access \
  --allow /srv/report/assets \
  --page-size A4 \
  --orientation Landscape \
  --viewport-size 1400x900 \
  --disable-smart-shrinking \
  --print-media-type \
  --window-status chart-ready \
  /srv/report/chart.html /srv/report/chart.pdf
Remote page with a timing cushion
wkhtmltopdf \
  --page-size Letter \
  --orientation Landscape \
  --viewport-size 1366x900 \
  --javascript-delay 2000 \
  --no-stop-slow-scripts \
  'https://example.com/report' report.pdf
Python wrapper
import subprocess

cmd = [
    'wkhtmltopdf',
    '--page-size', 'A4',
    '--orientation', 'Landscape',
    '--viewport-size', '1400x900',
    '--disable-smart-shrinking',
    '--print-media-type',
    '--window-status', 'chart-ready',
    'https://example.com/report',
    'report.pdf',
]
subprocess.run(cmd, check=True, timeout=90)
Node.js wrapper
import { execFile } from 'node:child_process';
import { promisify } from 'node:util';
const run = promisify(execFile);

await run('wkhtmltopdf', [
  '--page-size', 'A4',
  '--orientation', 'Landscape',
  '--viewport-size', '1400x900',
  '--disable-smart-shrinking',
  '--print-media-type',
  '--window-status', 'chart-ready',
  'https://example.com/report',
  'report.pdf'
], { timeout: 90_000 });
9. Diagnose common failures
| Symptom | Likely cause | Fix |
|---|---|---|
| Everything is uniformly soft | Small PNG/JPEG source or repeated resizing | Export SVG, or increase source pixels and resize once. |
| Chart is tiny with large margins | Smart shrinking or a narrow page width | Set page dimensions, try --disable-smart-shrinking, and size the chart to the usable area. |
| Right side is cut off | Chart exceeds page width after margins | Use landscape orientation, reduce chart width, or increase custom page width. |
| Labels overlap | Viewport or chart dimensions are too small | Increase both CSS/SVG dimensions and --viewport-size; simplify tick labels. |
| Blank chart | JavaScript or data request had not finished | Use --window-status or a longer --javascript-delay; inspect stderr and network access. |
| Wrong font changes layout | Font file cannot be loaded | Use reachable font URLs, wait for document.fonts.ready, and verify local-file permissions. |
| Colors differ from browser | Print media rules or missing color adjustment | Review @media print and set print colors intentionally. |
| Chart splits across pages | Container is taller than remaining page space | Set break-inside: avoid, reduce height, or insert a page break before the chart. |
| Conversion hangs | Page never sets the requested status or script keeps running | Set success and error statuses, add a finite delay, and use an external process timeout. |
10. Performance, reliability, and cost
SVG usually reduces the need for very large raster files, but complex SVGs can still consume CPU. Disable animation, reduce unnecessary points, and avoid loading data or fonts that the PDF does not use. Reuse a warmed worker process only if your deployment isolates jobs and enforces timeouts; a stuck page should never block the queue.
For reliable batch exports, pin the wkhtmltopdf build, keep a representative chart fixture, record stderr, and compare PDFs at 100% zoom. Retry transient network failures with a limit, but do not retry deterministic JavaScript errors indefinitely. Cache static assets close to the renderer. Cost is mainly your compute, storage, and network usage: larger images and longer JavaScript delays increase all three. Measure conversion time and PDF size on your own workload because the dossier provides no benchmark.
11. Validate the final PDF
- Open a representative page at 100% zoom.
- Print one page on the intended paper size.
- Check thin lines, tick labels, legend order, contrast, and clipped annotations.
- Check a chart with the most data points and the longest labels.
- Check a slow-data case and a missing-data case.
- Confirm page breaks do not divide the chart or its caption.
Or skip the browser setup
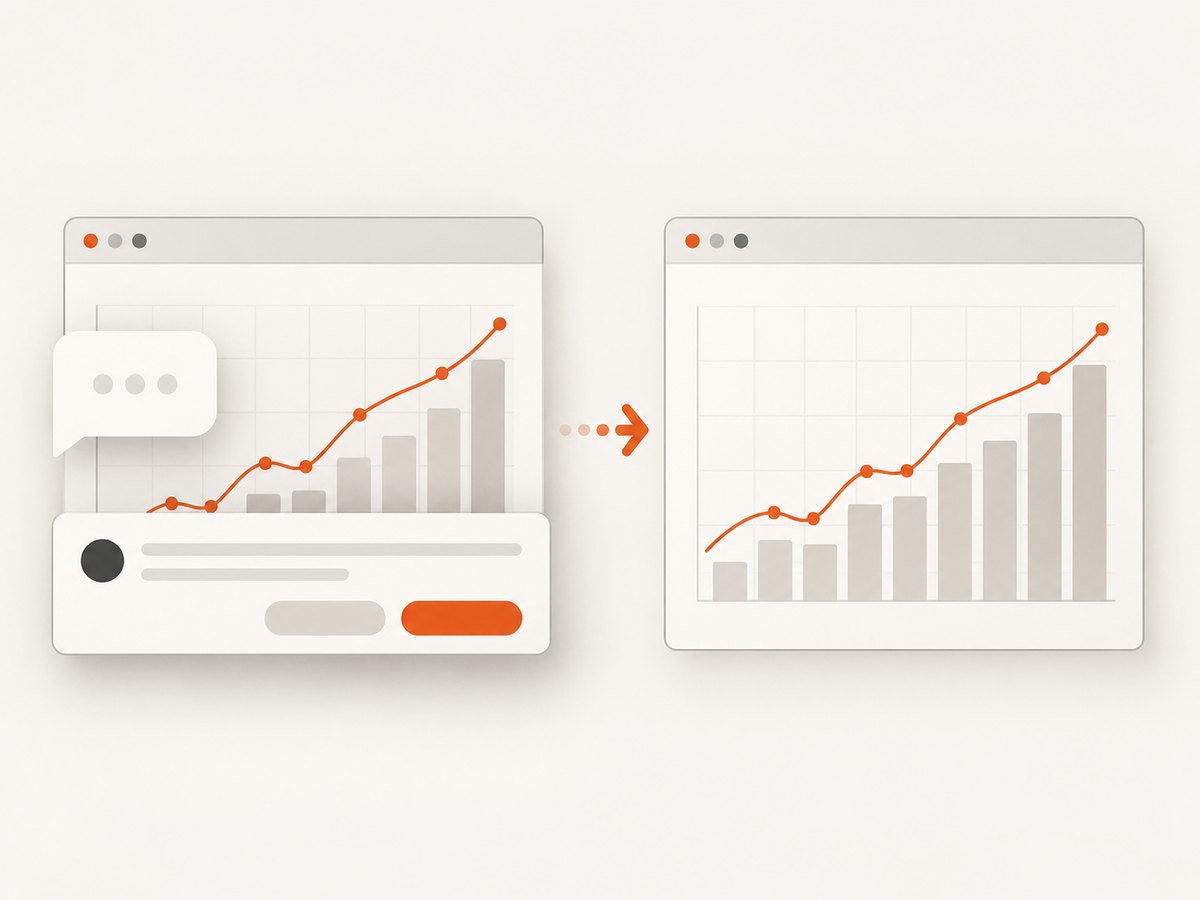
If you need a clean image or PDF from a web page without maintaining a wkhtmltopdf process, ScreenshotNeo provides a single HTTP request. Its capture pipeline accepts consent banners as a visitor and removes more than 60 known consent platforms, newsletter popups, and chat widgets before the shot. You can turn each cleanup step off. Clean shots are the only billable responses; bot checks, CAPTCHAs, blank pages, timeouts, failed loads, and cache hits cost nothing, and response headers identify the page verdict and billing result.
See the ScreenshotNeo API documentation for all options, including full-page capture, CSS selectors, dark mode, device presets, retina scale, PDF paper sizes and margins, custom CSS and JavaScript, click and wait controls, request blocking, headers, cookies, user agents, authorization, timezone, geolocation, transparent backgrounds, resizing, caching, signed links, asynchronous webhooks, bulk capture, usage data, and the OpenAPI specification.
cURL
curl -G 'https://api.screenshotneo.com/v1/shot' \
  -d access_key=YOUR_API_KEY \
  --data-urlencode 'url=https://example.com/report' \
  -o report.webp
Python
import requests
r = requests.get('https://api.screenshotneo.com/v1/shot', params={'access_key': 'YOUR_API_KEY', 'url': 'https://example.com/report'}, timeout=90)
open('report.webp', 'wb').write(r.content)
Node.js
const q = new URLSearchParams({ access_key: 'YOUR_API_KEY', url: 'https://example.com/report' }); const res = await fetch(`https://api.screenshotneo.com/v1/shot?${q}`);An MCP server also lets Claude, Cursor, and other MCP clients call take_screenshot, get_page_info, and capture_pdf. The Free plan includes 1,000 screenshots per month with no card; paid plans start at $5 for 3,000 shots. Create a free ScreenshotNeo account.
FAQ
Does increasing DPI fix an SVG chart?
Usually no. SVG is already resolution-independent. Fix its layout, dimensions, and text sizing first; DPI settings mainly affect raster inputs and output interpretation.
Should I always disable smart shrinking?
No. Disable it when predictable CSS-pixel sizing matters. Keep it enabled when automatic fitting is more useful, then verify that labels and lines remain readable.
Is a fixed JavaScript delay enough?
It can work for a stable page, but window.status is more repeatable when network and chart render times vary.
Why are labels missing only in the PDF?
Common causes are print CSS hiding them, a missing font, clipping at the page edge, or capture before the chart finished drawing. Check those in that order.