How to Improve Website Rendering Performance for Screenshots
Make website screenshots faster and more consistent by profiling the real bottleneck, choosing the right capture size, and stabilizing only what your test needs.

To improve screenshot rendering performance, first find out whether time is being spent loading the page, running JavaScript, laying out and painting content, waiting for the desired state, or encoding and writing the image. Then reduce only the work your screenshot does not need: capture a smaller area, use CSS-pixel output when device-pixel detail is unnecessary, and stabilize dynamic content only when the test expects a stable image. There is no single setting that makes every page faster.
This guide uses Playwright for runnable examples. The same process applies to browser-based visual checks generally: hold the environment and capture settings constant, measure the stages separately, and compare both timing and image fidelity after each change.
1. Define the screenshot you actually need
Before changing code, write down what the output must contain. “Fast” is not meaningful if one run captures a viewport and another captures a full page, or if one includes loaded web fonts and another does not.
| Setting | Choices | Decision |
|---|---|---|
| Browser and host | Browser version, machine or CI runner | Keep them fixed when comparing runs. |
| Viewport | Width and height in CSS pixels | Use the dimensions the screenshot consumer needs. |
| Pixel scale | css or device |
CSS scale gives one output pixel per CSS pixel; device scale uses device pixels and can substantially increase output dimensions on high-DPI setups. [Playwright Page API] |
| Capture scope | Viewport, clipped rectangle, element, or full page | Capture only the region that matters. Full-page is appropriate when below-the-fold content is part of the deliverable. |
| Readiness target | First useful view or fully populated state | Name the content that must be ready: for example, a chart, a product image, or a particular component. |
| Output | PNG, JPEG, or WebP | Choose based on downstream needs and compare output size and fidelity. |
Playwright documents viewport and full-page screenshots, clipping, image type, and the scale option. With scale: 'css', an output pixel corresponds to a CSS pixel. With scale: 'device', output uses device pixels; high-DPI capture can make the image considerably larger. Choose device scale when that pixel detail is needed, not by default. [Playwright Page API]
2. Measure the right stage
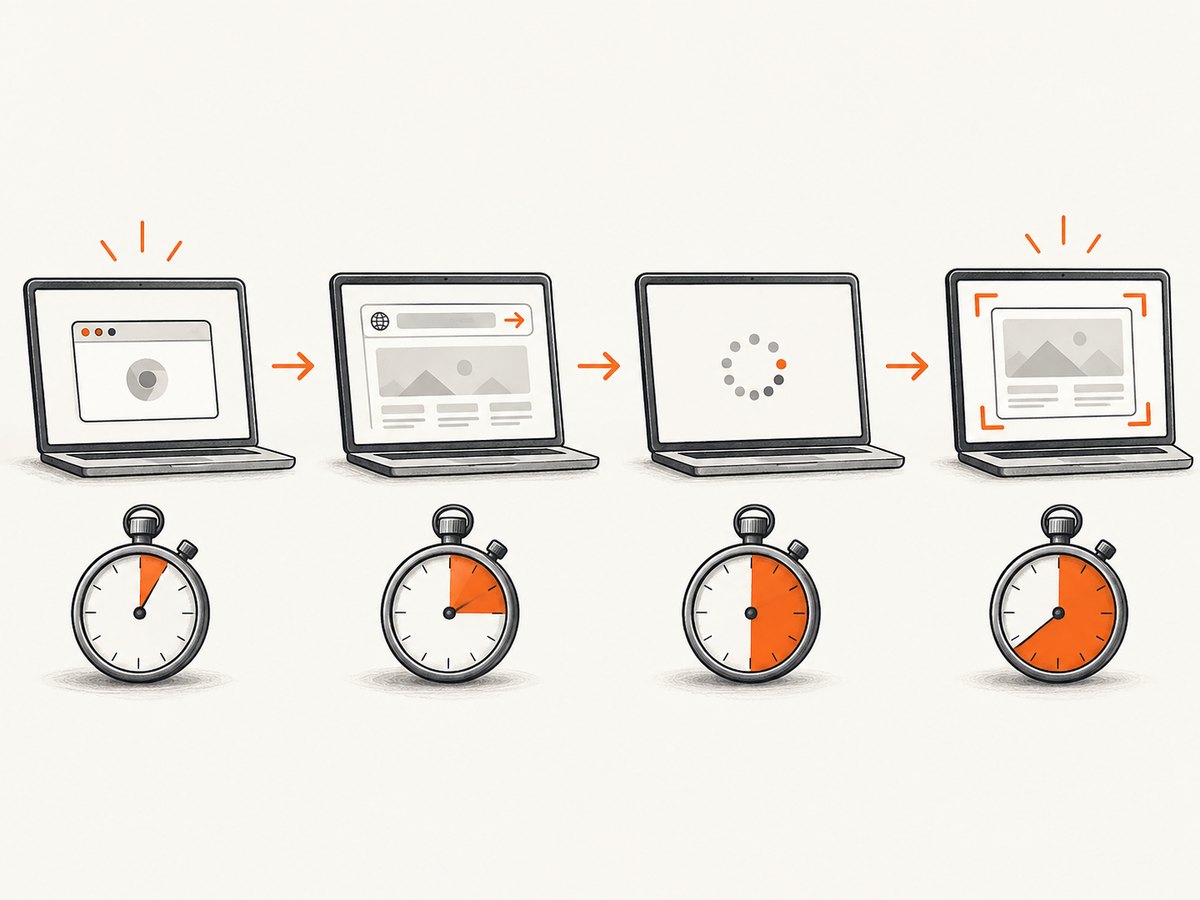
A screenshot’s wall-clock time can include navigation, application readiness, stabilization, browser capture, image encoding, and file I/O. Time these separately in your own harness. A slow result does not by itself prove that screenshot encoding is the bottleneck.
Use Chrome DevTools Performance recordings to inspect main-thread activity, layout, and paint. Performance Insights can surface render-blocking requests, font display, image delivery, forced reflow, large DOMs, and network dependency chains. Treat these as leads to verify in the trace, not a checklist of changes every page needs. [Chrome Performance Insights] [Analyze runtime performance]
Chrome’s Rendering tools can show repaint regions, layout-shift regions, layers and tiles, frame-rendering statistics, and potential scrolling-related listener issues. An overlay is a clue, not proof that the highlighted work is delaying your capture. [Discover issues with rendering performance]
Record a repeatable baseline
- Fix the browser version, machine or runner, viewport, device scale, URL, and application data.
- Choose one capture scope and output format and keep them unchanged.
- Record navigation duration, time to your page-specific readiness condition, screenshot call duration, and file-write duration separately.
- Save the output and inspect it. A quicker image that omits required content is not an improvement.
- Change one variable, repeat, and compare both timing and visual output.
Do not treat a generic page metric as a screenshot deadline. Chrome describes 2.5 seconds or less as a “good” Largest Contentful Paint (LCP) score, but LCP is a page metric, not a guarantee that a screenshot pipeline has reached your required state or finished encoding. [Chrome Performance Insights overview]
3. Capture fewer pixels when possible
The simplest capture-side optimization is often to reduce the work requested. A viewport or clipped region generally produces less output than a full scrollable page. Use full-page capture when the whole page is required; do not make every test pay for content that it never inspects.
Similarly, use CSS-pixel scale for many layout checks and reserve device-pixel scale for consumers that need the extra resolution. Larger images can take more time and space to encode, transfer, store, or compare, but the actual impact depends on the page and environment; measure your own pipeline.
import { chromium } from 'playwright';

const browser = await chromium.launch();
const page = await browser.newPage({
  viewport: { width: 1280, height: 800 },
  deviceScaleFactor: 1,
});

await page.goto('https://example.com');
await page.locator('main').waitFor({ state: 'visible' });

const start = performance.now();
await page.screenshot({
  path: 'viewport.png',
  type: 'png',
  fullPage: false,
  scale: 'css',
});
console.log(`Screenshot call: ${Math.round(performance.now() - start)} ms`);

await browser.close();
Install Playwright in your project and run this as an ES module in an environment where the browsers it needs are installed. Replace the example URL and readiness condition with the state your application requires. For a deliberate full-page capture, use fullPage: true. For a region, use clip: { x, y, width, height } and ensure the rectangle matches the intended output. See the Playwright Page API for the current screenshot options.
4. Wait for the intended state, not an arbitrary delay
Capturing too early can produce an incomplete image; waiting longer than needed wastes time. Identify the application-specific signal that means the content under test is ready: a selector becoming visible, a loading indicator disappearing, or test data reaching a known state. A fixed sleep can be useful for a known timed behavior, but elapsed time alone does not establish that asynchronous work finished.
import { chromium } from 'playwright';

const browser = await chromium.launch();
const page = await browser.newPage({ viewport: { width: 1280, height: 800 } });

await page.goto('https://example.com/dashboard');
await page.locator('[data-testid="dashboard-ready"]').waitFor({ state: 'visible' });
await page.locator('[data-testid="sales-chart"]').waitFor({ state: 'visible' });

await page.screenshot({ path: 'dashboard.png', scale: 'css' });
await browser.close();
The selectors are examples; use stable selectors from your own application. If a chart is visible before its data is complete, wait for a more specific signal, such as the test fixture’s loaded state. If third-party content is not part of the test, excluding or masking it can make the capture less variable, but that changes what the image verifies.
5. Stabilize animation and dynamic regions deliberately
For visual assertions, Playwright’s screenshot assertion waits for two consecutive screenshots to match. Its options can disable CSS animations, transitions, and Web Animations; apply styles; and mask selected elements. These controls help when the intended assertion is a stable snapshot. They suppress or change visual behavior, so do not use them when motion, a live value, or an animation frame is what the test must verify. [Playwright PageAssertions API]
import { test, expect } from '@playwright/test';

test('account page has the expected stable layout', async ({ page }) => {
  await page.goto('https://example.com/account');
  await page.locator('[data-testid="account-ready"]').waitFor();

  await expect(page).toHaveScreenshot('account.png', {
    animations: 'disabled',
    mask: [page.locator('[data-testid="live-clock"]')],
    style: '[data-testid="dynamic-ad"] { visibility: hidden !important; }',
  });
});
Keep masks narrow and purposeful. If the live clock is under test, remove it from the mask. If a screenshot assertion continues to vary, inspect the changing pixels and trace their source: data, timestamps, rotating content, animation, font loading, or layout shifts. Stabilize the underlying test state where practical instead of masking broad sections.
6. Fix page-side bottlenecks shown by the trace
Chrome identifies CSS and JavaScript requests that block initial rendering as resources that may delay first paint. Defer resources not needed for that paint while keeping critical styles and scripts available. Reducing first-paint code to what is needed to show the page can help; inlining CSS is an advanced technique that can introduce bugs, so it is not a default fix. [Render-blocking requests]
Other trace-led changes may include reducing repeated forced synchronous layout, simplifying expensive DOM or style work, improving image delivery, and addressing font loading. Chrome’s documentation demonstrates how interleaved style changes and position reads can force layout. Batch writes and reads where the trace shows that pattern, then record again under the same conditions. [Analyze runtime performance]
Do not remove a font, image, stylesheet, or script simply because it costs time. If it is part of the screenshot’s intended state, optimize its delivery or readiness path while preserving the result. If it is irrelevant to the capture, consider excluding it only when doing so reflects the test’s purpose.
7. Compare fidelity and time after every change
- Did the output retain every required element and state?
- Did the intended region, dimensions, and pixel scale remain fixed?
- Did the change reduce the stage you meant to improve, rather than just move waiting elsewhere?
- Did the image become more stable because the test state is controlled, or because meaningful behavior was hidden?
- Can another run reproduce the result with the same browser, host, data, and settings?
Published documentation does not establish a universal speedup for these interventions. Pages vary in complexity, resource dependencies, and required state. Keep the before-and-after trace and screenshot with your measurements so a performance change can be reviewed alongside its visual effect.
8. Common problems and fixes
| Symptom | Likely cause | What to do |
|---|---|---|
| Screenshot is blank or partly rendered | Capture happened before the app or required content became ready. | Wait on a page-specific readiness selector or state, then verify the resulting image. |
| Capture takes much longer than expected | Full-page scope, high pixel scale, page loading, main-thread work, or image encoding may dominate. | Time stages separately; try the needed smaller scope or CSS scale, then profile the page. |
| Visual test fails on every run | Dynamic values, animation, fonts, images, or layout shifts vary. | Inspect differing regions; control required data and readiness, and narrowly disable, style, or mask only irrelevant changes. |
| Mask does not remove the changing pixels | The selector may not cover the changing element, or the difference may come from another region. | Inspect the diff and locator; mask the actual element or apply a targeted screenshot style. |
| Device-scale output is unexpectedly large | Device pixels produce more output pixels than CSS pixels on high-DPI capture. | Use scale: 'css' when one output pixel per CSS pixel satisfies the consumer. |
| Deferring a resource makes the screenshot worse | The deferred script or stylesheet was needed for the captured first paint. | Keep required first-paint resources available; defer only work proven noncritical for the target state. |
| DevTools highlights paint or layout activity, but timing does not improve | The highlighted activity may not be the limiting stage for this capture. | Correlate trace events with your measured capture stages before changing the page. |
| Results differ between local and CI | Browser, host, viewport, scale, network, or data state differs. | Align those inputs and compare again; do not interpret uncontrolled runs as a reliable benchmark. |
9. Performance, reliability, and cost considerations
For a self-hosted Playwright pipeline, browser execution and CI time are operational costs. Reducing unnecessary capture area or pixel scale can reduce output work, while aggressive waiting, resource blocking, or masking can reduce fidelity or hide failures. There is no general cost or speed number that applies to every pipeline; measure browser time, output size, retries, and storage in your environment.

Reliability improves when readiness is defined by application state and comparisons use a fixed environment. Retries can help with transient infrastructure problems, but they should not make a permanently unstable page appear healthy. Record which run failed and why, and retain enough trace or screenshot output to diagnose it.
Or skip the browser setup
ScreenshotNeo is a website screenshot API and MCP server for developers. Send one GET request with a URL to receive a PNG, JPEG, WebP, or PDF. The API parameters commonly used by other screenshot APIs also work, which can make switching straightforward. See the ScreenshotNeo API docs.
curl -G "https://api.screenshotneo.com/v1/shot" -d access_key=YOUR_API_KEY --data-urlencode url=https://example.com -o shot.webpimport requests
r = requests.get(
"https://api.screenshotneo.com/v1/shot",
params={"access_key": "YOUR_API_KEY", "url": "https://example.com"},
timeout=90,
)
open("shot.webp", "wb").write(r.content)const q = new URLSearchParams({ access_key: 'YOUR_API_KEY', url: 'https://example.com' });
const res = await fetch(`https://api.screenshotneo.com/v1/shot?${q}`);
if (!res.ok) throw new Error(`Screenshot request failed: ${res.status}`);
await Bun.write('shot.webp', new Uint8Array(await res.arrayBuffer()));Replace the example target URL and provide your API key. The Node.js snippet uses Bun’s file writer; in Node.js, write the response bytes with await import('node:fs/promises').then(fs => fs.writeFile('shot.webp', Buffer.from(await res.arrayBuffer()))) after checking res.ok.
- Cookie banners, popups, and chat widgets are removed before the shot; each cleanup step can be turned off.
- Bot checks and CAPTCHAs, blank pages, timeouts, failed loads, and cache hits are never billed. Response headers identify the page verdict and billing status.
- An MCP server provides
take_screenshot,get_page_info, andcapture_pdftools for Claude, Cursor, and other MCP clients. - The free plan includes 1,000 screenshots a month with no card. Paid plans start at $5 for 3,000; all features are on every plan.
Create a free ScreenshotNeo account to get 1,000 screenshots a month with no card.
FAQ
Should I use a screenshot benchmark as my page’s performance target?
Use your own capture requirement and stage timings. A page metric such as LCP does not specify when your screenshot’s required content is ready or when its image has been encoded.
Is a full-page screenshot always slower?
It requests more page area than a viewport capture, but the effect depends on the page and capture stack. Measure both with the same page state and environment if the choice matters.
Should I disable all animation in visual regression tests?
Only when motion is outside the test’s purpose. Preserve animation when its appearance or timing is part of what you need to validate.
Can I make a screenshot deterministic by masking the whole page?
A broad mask may hide the differences the test exists to catch. Mask only known, irrelevant dynamic regions and keep the rest of the image meaningful.