An Introduction to Prometheus and Grafana
Learn how Prometheus collects metrics, how Grafana visualizes them, and how to build dashboards, alerts, exporters, and reliable monitoring.
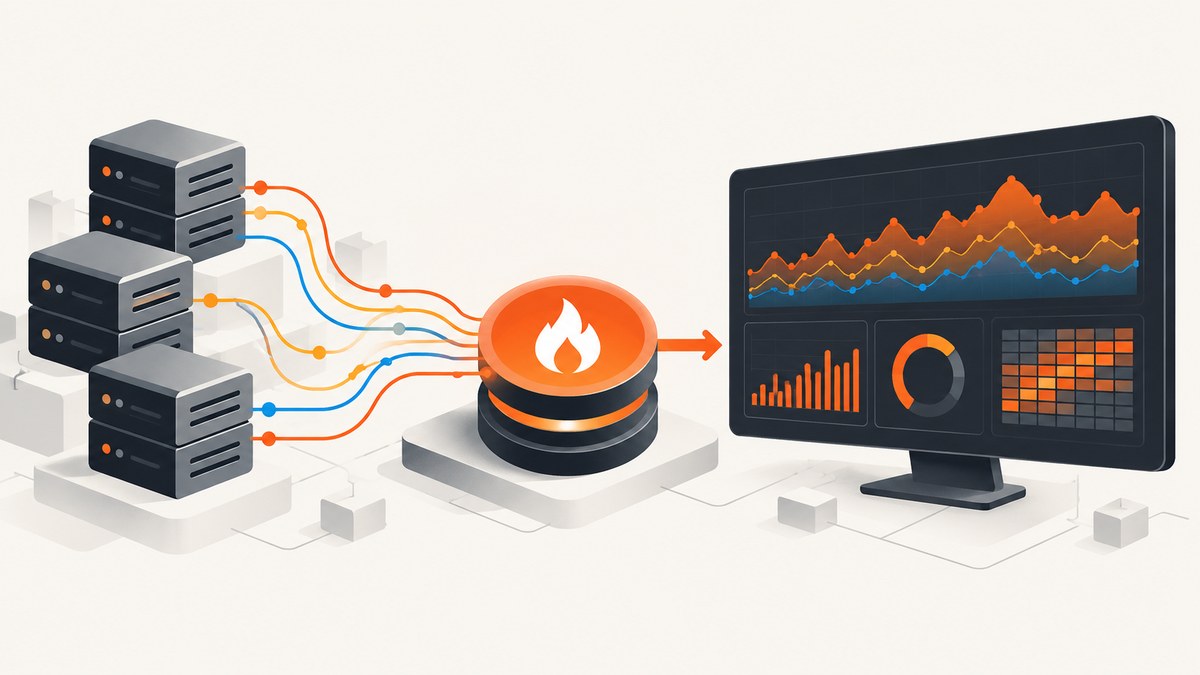
Prometheus collects and stores time-series metrics; Grafana queries those metrics and turns them into dashboards and alerts. Prometheus normally pulls a target’s /metrics endpoint over HTTP, evaluates PromQL queries and alert rules, and stores samples in its time-series database. Grafana connects to Prometheus as a data source, then renders panels, variables, annotations, and dashboards.
This guide builds the complete path: expose a metric, scrape it, query it with PromQL, visualize it in Grafana, and add alerting through Alertmanager. It also explains exporters, service discovery, metric types, performance decisions, failure modes, and a practical ScreenshotNeo option for documenting dashboards or capturing monitoring pages.
1. Prometheus and Grafana in one architecture
Prometheus is an open-source systems monitoring and alerting toolkit. Each monitored target exposes metrics, usually at an HTTP endpoint. Prometheus periodically scrapes that endpoint and writes samples identified by a metric name plus a set of labels. PromQL reads those series for dashboards, recording rules, and alerts. See the Prometheus overview.
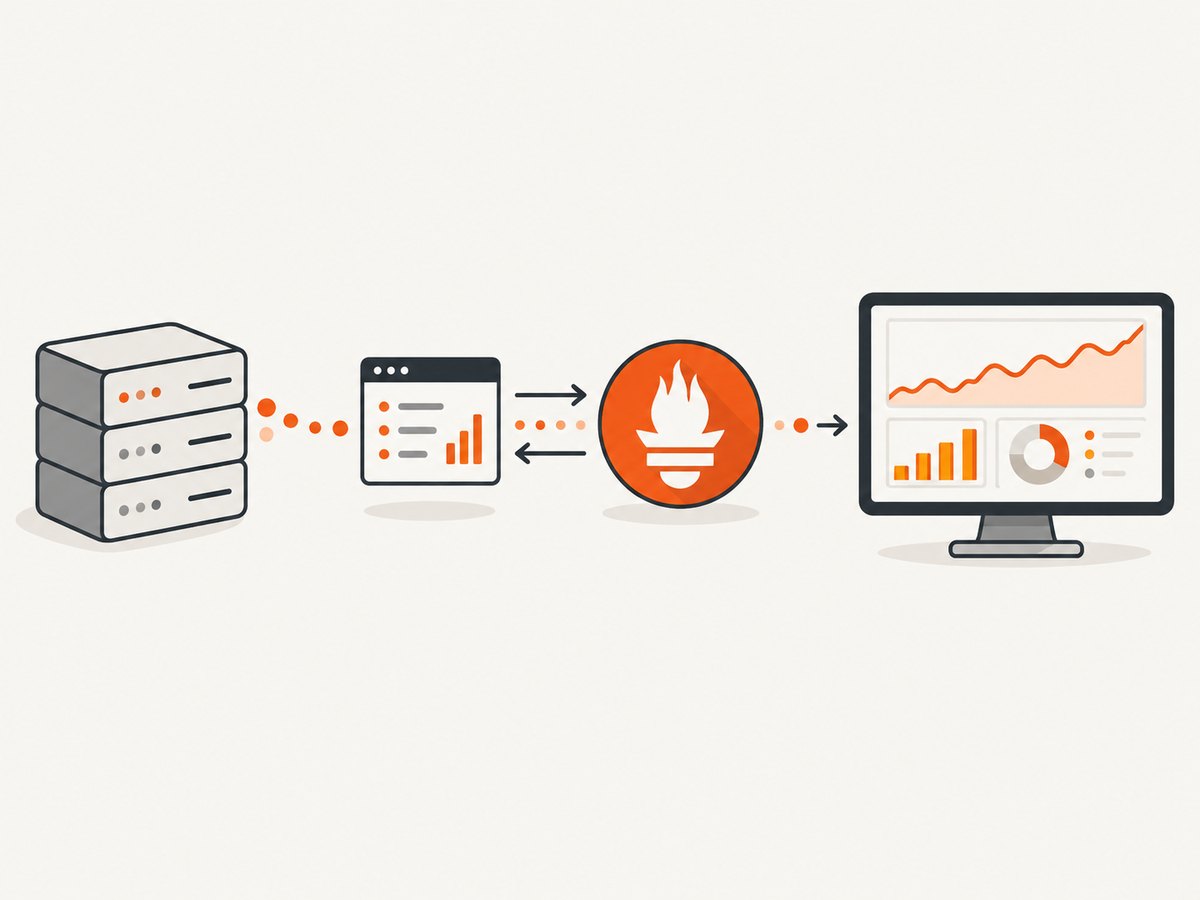
Grafana is the visualization and exploration layer. Add Prometheus as a data source, select a time range, and build panels from PromQL. Grafana supports dashboard variables based on label names, label values, metric names, series, or query results. A multi-value variable becomes a regular-expression pattern, so queries should use =~ when the variable can contain more than one value. The Grafana Prometheus data-source documentation covers these behaviors.
| Component | Responsibility | Typical failure |
|---|---|---|
| Instrumented application | Exposes counters, gauges, histograms, or summaries | Missing labels, incorrect metric type, endpoint unavailable |
| Exporter | Translates an existing system’s statistics into Prometheus format | Exporter cannot reach its source or exposes stale data |
| Prometheus | Scrapes, stores, queries, and evaluates rules | Target down, scrape timeout, storage pressure |
| Alertmanager | Routes, groups, silences, and deduplicates alerts | Wrong route, muted notification, invalid receiver |
| Grafana | Queries Prometheus and displays panels and dashboards | Datasource URL or variable query is wrong |
2. Run a small Prometheus and Grafana stack
For learning, run both services locally with Docker Compose. Create prometheus.yml:
global:
  scrape_interval: 15s
  evaluation_interval: 15s

scrape_configs:
  - job_name: prometheus
    static_configs:
      - targets: ["prometheus:9090"]

  - job_name: demo-app
    metrics_path: /metrics
    static_configs:
      - targets: ["host.docker.internal:8000"]
On Linux, host.docker.internal may require an extra host mapping. If the application runs in another Compose service, use that service name and port instead. Start the services with:
docker run -d --name prometheus \
  -p 9090:9090 \
  -v "$PWD/prometheus.yml:/etc/prometheus/prometheus.yml:ro" \
  prom/prometheus

docker run -d --name grafana \
  -p 3000:3000 \
  grafana/grafana
Open Prometheus at http://localhost:9090 and Grafana at http://localhost:3000. In Grafana, add a Prometheus data source whose URL is http://host.docker.internal:9090 when Grafana runs in a container and Prometheus runs on the host. When both containers share a Docker network, use http://prometheus:9090.
3. Expose application metrics
Direct instrumentation gives you metrics close to the code that produces them. Official Prometheus client libraries exist for languages including Go, Java, Python, and Ruby. The following Python service exposes a request counter, an in-progress gauge, and a request-duration histogram:
from prometheus_client import Counter, Gauge, Histogram, start_http_server
import random
import time

requests_total = Counter(
    "demo_requests_total",
    "Total HTTP requests",
    ["method", "status"],
)
requests_in_progress = Gauge(
    "demo_requests_in_progress",
    "Requests currently being processed",
)
request_duration_seconds = Histogram(
    "demo_request_duration_seconds",
    "Request duration in seconds",
    ["route"],
)

start_http_server(8000)

while True:
    requests_in_progress.inc()
    started = time.time()
    try:
        time.sleep(random.uniform(0.02, 0.2))
        requests_total.labels(method="GET", status="200").inc()
    finally:
        request_duration_seconds.labels(route="/demo").observe(time.time() - started)
        requests_in_progress.dec()
Install the dependency with pip install prometheus-client, run the file, and check http://localhost:8000/metrics. In a real web framework, update counters in request middleware and use bounded label values. Never use an unbounded label such as a user ID, request ID, or full URL path; every unique label combination creates another time series.
Metric types
- Counter: a value that increases, such as completed requests or processed jobs. Use
rate()orincrease()to calculate change over time. - Gauge: a value that can rise or fall, such as memory usage, queue depth, or active connections.
- Histogram: observations placed into configurable buckets, useful for request-duration and size distributions. Histograms support aggregating buckets across instances.
- Summary: an observation count and sum, useful for aggregate calculations such as average duration. Quantiles from summaries are calculated at the source and are not generally aggregatable across instances.
4. Use exporters for systems you do not own
An exporter translates metrics from a system that cannot be instrumented directly. Common examples include MySQL, Kafka, JMX, HAProxy, and NGINX exporters. Prometheus scrapes the exporter, while the exporter queries the underlying system.
Use direct instrumentation when you control the application and need business or request context. Use an exporter when the system already exposes statistics through a database, protocol, or management endpoint. Check exporter permissions, source reachability, and scrape cost. A single exporter target can expose many series, so inspect its output before adding it to production.
5. PromQL: turn samples into useful answers
PromQL operates on instant vectors and range vectors. Start with a raw metric:
demo_requests_totalFilter by labels:
demo_requests_total{status="200"}Calculate per-second request throughput over the selected Grafana range:
sum by (method) (rate(demo_requests_total[$__rate_interval]))Grafana recommends $__rate_interval for rate queries. It chooses a window large enough to capture at least four scrape samples. Set Grafana’s Prometheus scrape interval to match the actual Prometheus configuration; otherwise rate graphs can be misleading.
For a histogram, calculate the 95th percentile across instances:
histogram_quantile(
  0.95,
  sum by (le) (
    rate(demo_request_duration_seconds_bucket[$__rate_interval])
  )
)
Other useful patterns include:
# Current queue depth
my_queue_depth

# Error ratio
sum(rate(http_requests_total{status=~"5.."}[$__rate_interval]))
/
sum(rate(http_requests_total[$__rate_interval]))

# Memory in GiB
node_memory_MemTotal_bytes / 1024 / 1024 / 1024
6. Build a Grafana dashboard
- Open Connections, add a Prometheus data source, and set its URL.
- Use Explore to run a raw metric query before creating a panel.
- Create a dashboard and add a time-series panel for request rate.
- Add a stat panel for current in-progress requests and a histogram-based latency panel.
- Create a variable named
jobwith the querylabel_values(up, job). - Reference it with
job=~"$job"so multi-select values work. - Save the dashboard and export its JSON to version control.
Community dashboards can speed up setup, while dashboards built from scratch give you control over names, units, thresholds, and ownership. Keep panels focused: one question per panel, explicit units, and a useful default time range.
7. Alerts and Alertmanager
Prometheus evaluates alerting rules and sends firing alerts to Alertmanager. Alertmanager handles notification routing, grouping, silencing, and aggregation. A minimal rule file is:
groups:
  - name: demo
    rules:
      - alert: DemoTargetDown
        expr: up{job="demo-app"} == 0
        for: 5m
        labels:
          severity: critical
        annotations:
          summary: Demo application is unreachable
          description: Prometheus has failed to scrape demo-app for five minutes.
Add the rule file to Prometheus with:
rule_files:
  - /etc/prometheus/alerts.yml
Configure an Alertmanager URL in Prometheus:
alerting:
  alertmanagers:
    - static_configs:
        - targets: ["alertmanager:9093"]
Use a for duration to avoid paging on a single transient scrape failure. Put routing policy, receivers, and maintenance silences in Alertmanager. Test an alert end to end, including the notification destination and any grouping delay.
8. Service discovery, labels, and security
Static targets work for a small lab. Production environments often use service discovery for Kubernetes, cloud instances, files, or DNS. Discovery updates the target list; relabeling can keep only the targets and labels you need. Keep labels stable and bounded, and avoid embedding secrets in labels.
Protect metrics endpoints when they contain sensitive operational data. Restrict network access, use authentication or a proxy where required, and give exporters only the permissions they need. Treat Grafana dashboard access as an operational permission because panels can reveal infrastructure details.
9. Performance, reliability, and cost decisions
- Scrape interval: shorter intervals improve freshness but increase requests, storage, and query work. Choose an interval that matches the incident response you need.
- Cardinality: the number of unique label combinations is a primary cost driver. Remove unbounded labels and review new instrumentation before deployment.
- Query shape: aggregate early with
sum by, limit dashboard time ranges, and prefer recording rules for expensive, repeatedly used expressions. - Retention: set retention according to investigation needs and disk capacity. Monitor Prometheus storage and compaction.
- Scrape failures: alert on
up == 0, scrape duration, and missing series. A green Grafana page does not prove that every target is healthy. - High availability: run redundant Prometheus servers with consistent configuration when monitoring availability matters, and ensure notification routing does not create duplicate pages.
10. Troubleshooting checklist
| Symptom | Cause | Fix |
|---|---|---|
| Target is missing from Prometheus | Configuration was not reloaded or discovery returned no targets | Check Status → Targets, validate YAML, reload Prometheus, and inspect discovery logs. |
up == 0 |
DNS, port, firewall, TLS, authentication, or application failure | Fetch the endpoint from the Prometheus host and compare the target address and path. |
| Grafana says “no data” | Wrong data source, time range, labels, or metric name | Run the query in Explore, widen the time range, and remove filters one at a time. |
| Rate graph is noisy or empty | Range window is shorter than the scrape cadence | Use $__rate_interval and match Grafana’s configured interval to Prometheus. |
| Dashboard becomes slow | High-cardinality labels or expensive unaggregated queries | Aggregate by the labels you need, shorten the range, and add recording rules. |
| Alert never fires | Expression is false, rule file is not loaded, or the for period has not elapsed |
Check Alerts, validate the expression in Prometheus, and inspect rule status. |
| Alert fires but no notification arrives | Alertmanager route, receiver, silence, or grouping configuration | Inspect Alertmanager’s alerts and silences, then send a test notification. |
11. Or skip the browser setup
If you need a clean image or PDF of a Prometheus or Grafana page for a runbook, release note, or incident record, ScreenshotNeo provides a website screenshot API. It accepts a URL and returns PNG, JPEG, WebP, or PDF. Before capture it accepts cookie banners and removes more than 60 known consent platforms, newsletter popups, and chat widgets. Bot checks, blank pages, timeouts, failed loads, and cache hits are not billed, and response headers identify the page verdict and billing result.

See the ScreenshotNeo API documentation for all options. A basic call is:
curl -G "https://api.screenshotneo.com/v1/shot" -d access_key=YOUR_API_KEY --data-urlencode url=https://stripe.com -o shot.webpimport requests
r = requests.get("https://api.screenshotneo.com/v1/shot", params={"access_key": "YOUR_API_KEY", "url": "https://stripe.com"}, timeout=90)
open("shot.webp", "wb").write(r.content)const q = new URLSearchParams({ access_key: 'YOUR_API_KEY', url: 'https://stripe.com' });
const res = await fetch(`https://api.screenshotneo.com/v1/shot?${q}`);For monitoring pages, relevant options include full-page capture with lazy images loaded, a CSS element selector, dark mode, device presets or custom viewports, retina scale, custom CSS and JavaScript, click actions, hidden selectors, waits for a selector, delay or network idle, request blocking, custom headers and cookies, timezone and geolocation, transparent backgrounds, resizing, cache TTL, signed image links, asynchronous jobs with signed webhooks, bulk capture of up to 100 URLs per call, and PDF page settings. ScreenshotNeo also offers an MCP server with take_screenshot, get_page_info, and capture_pdf for Claude, Cursor, and other MCP clients.
There is a free plan with 1,000 screenshots per month and no card. Paid plans start at $5 for 3,000 screenshots, and every feature is available on every plan. Create a free ScreenshotNeo account.
12. FAQ
Does Grafana store metrics?
Grafana normally queries a data source such as Prometheus. Prometheus stores the time-series samples; Grafana stores dashboard definitions and visualization settings.
Should I push metrics to Prometheus?
Prometheus is designed around pulling targets. A push gateway can be appropriate for short-lived batch jobs, but long-running services should normally expose a scrape endpoint.
When should I use a histogram instead of a summary?
Use a histogram when you need aggregatable latency distributions across instances. Use a summary when source-side quantiles are sufficient and cross-instance aggregation is not required.
Can Grafana alert without Prometheus?
Grafana supports alerting with several data sources, but this guide’s alert flow uses Prometheus rules followed by Alertmanager. Keep the ownership and notification path explicit.
What should I learn next?
Follow this sequence: scrape a simple target, inspect metric types, write PromQL, create a Grafana dashboard, add alert rules, and then configure service discovery. For a structured follow-up, the Grafana Prometheus learning resources and the book Prometheus: Up & Running cover PromQL, exporters, Grafana, alerting, Kubernetes, service discovery, and security.


