Converting JavaScript Graphs and Charts to an Image
Save JavaScript charts as PNG, JPEG, WebP, or SVG with Plotly, Highcharts, or Chart.js. Choose browser export or server-side rendering.

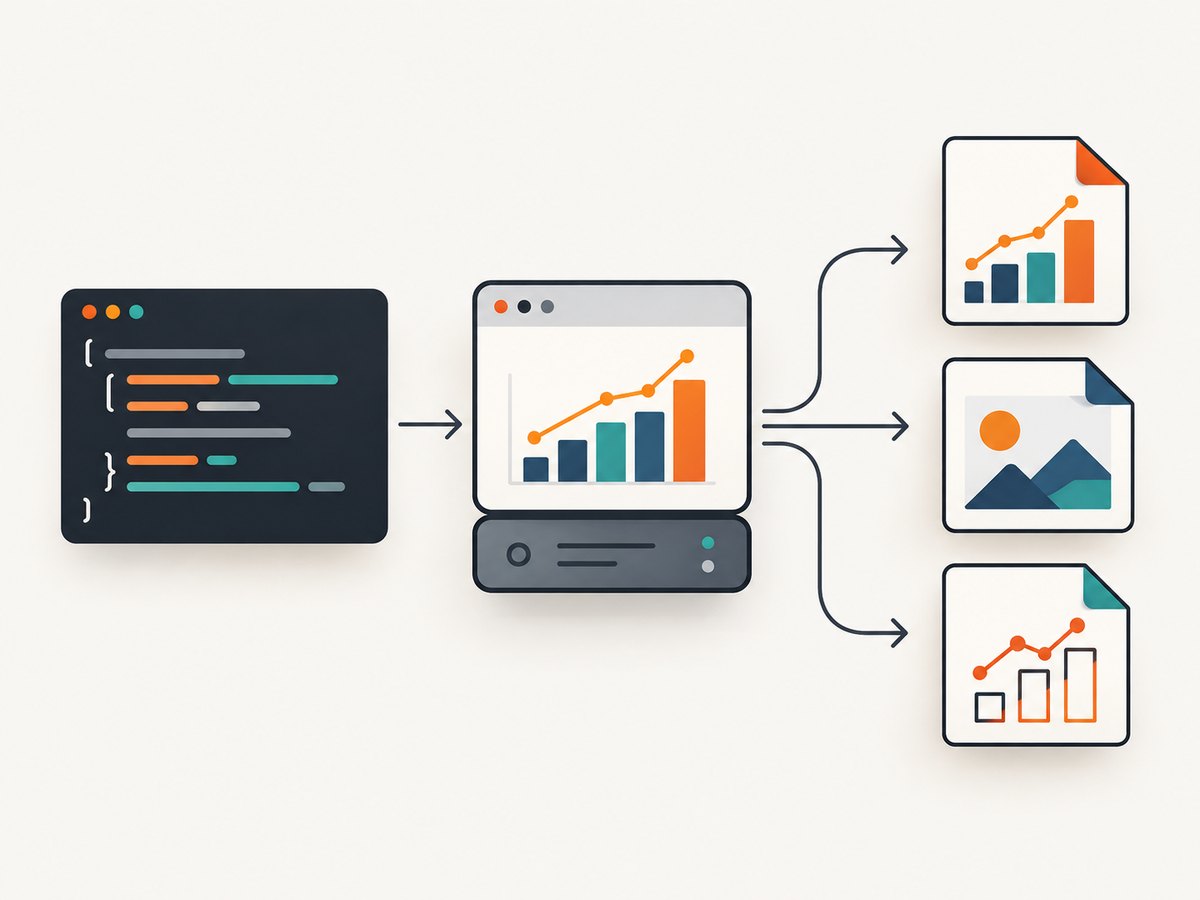
To convert a JavaScript graph or chart to an image, start with the chart library’s export API when it provides one. Plotly.js offers Plotly.toImage for an image data URL and Plotly.downloadImage for a browser download. Highcharts can export PNG, JPEG, and SVG locally by default from version 12.3.0. For server rendering, Highcharts provides a Node.js export server, and Chart.js can render in Node.js with a canvas implementation such as node-canvas or skia-canvas.
Choose a raster format (PNG, JPEG, or WebP) when a consumer expects a conventional image. Choose SVG when scalable vector output is useful, while remembering that some chart content can remain raster. This guide covers browser exports, server rendering, resolution, privacy, troubleshooting, and an API option for capturing a rendered chart as part of a web page.
1. Choose the export method
| Situation | Recommended method | Watch for |
|---|---|---|
| An existing Plotly chart in a browser | toImage or downloadImage |
WebGL traces may be raster inside SVG. |
| An existing Highcharts chart | Exporting module; local PNG, JPEG, and SVG in 12.3.0+ | Version and fallback settings determine whether export stays local. |
| Highcharts batch/server output | Highcharts Node.js export server or CLI | Check runtime and deployment requirements. |
| Chart.js server rendering | Chart.js with node-canvas or skia-canvas | Render from chart configuration and data in Node.js. |
| A chart displayed in a web page, regardless of library | Capture the rendered page or a chart element | Wait for the chart to finish rendering and load its fonts/data. |
Library export is usually the shortest path for an existing chart because the library already knows its dimensions, rendering state, and export settings. Page capture is useful when the desired output includes surrounding HTML, custom page styling, or a chart that has no suitable export API.
2. Export a Plotly.js chart
Plotly’s JavaScript static image export supports PNG, JPEG, WebP, and SVG. toImage returns a promise for a data URL; downloadImage triggers a download. The first argument is the chart’s DOM element, commonly obtained by its ID. See the Plotly static image export documentation for the current API details.
Download a PNG from the browser
<div id="chart" style="width: 800px; height: 500px"></div>
<button id="save">Save chart</button>
<script src="https://cdn.plot.ly/plotly-3.0.1.min.js"></script>
<script>
  const data = [{
    x: ["Jan", "Feb", "Mar"],
    y: [12, 19, 15],
    type: "bar"
  }];
  const layout = { title: "Quarterly activity" };

  Plotly.newPlot("chart", data, layout).then(() => {
    document.querySelector("#save").addEventListener("click", () => {
      Plotly.downloadImage("chart", {
        format: "png",
        filename: "activity-chart",
        width: 1600,
        height: 1000,
        scale: 1
      });
    });
  });
</script>
The example sets the export dimensions explicitly. Adjust them for the target use: a report may need a larger image than a thumbnail. The exact supported options can vary by Plotly version, so check its documentation when changing format or sizing behavior.
Get an image data URL instead
async function chartPngDataUrl() {
  const element = document.getElementById("chart");
  return await Plotly.toImage(element, {
    format: "png",
    width: 1600,
    height: 1000
  });
}

const dataUrl = await chartPngDataUrl();
// Use dataUrl as an image source, or send it to an endpoint you control.
A data URL is convenient for client-side display or download flows. For a large chart or many exports, consider the memory cost of keeping encoded image strings in JavaScript; download directly when the user just needs a file.
Plotly format and SVG notes
- Use PNG for crisp lines and text on transparent or solid backgrounds.
- Use JPEG when a lossy format is acceptable and the image is photographic or does not need transparency.
- Use WebP when the destination supports it and compact raster output is useful.
- Use SVG for vector workflows, but Plotly notes that WebGL traces can appear as raster content inside an SVG. An SVG container does not guarantee every plotted point is vector.
3. Export a Highcharts chart
Highcharts’ exporting module supports client-side export. Starting with version 12.3.0, exporting.js handles PNG, JPEG, and SVG locally by default without requiring offline-exporting.js. Earlier versions and unsupported browser cases can have different paths. Review the client-side export guide and the export module overview for version-specific options.
Basic browser example
<div id="container"></div>
<script src="https://code.highcharts.com/highcharts.js"></script>
<script src="https://code.highcharts.com/modules/exporting.js"></script>
<script>
  Highcharts.chart("container", {
    title: { text: "Monthly signups" },
    xAxis: { categories: ["Jan", "Feb", "Mar"] },
    series: [{ name: "Signups", data: [29, 71, 106] }],
    exporting: {
      enabled: true,
      filename: "monthly-signups",
      sourceWidth: 1200,
      sourceHeight: 700,
      scale: 2
    }
  });
</script>
With the exporting module present, Highcharts provides export controls that let users select available output formats. You can also trigger export through the chart’s exporting API when building a custom button or job flow. The export overview documents a default scale of 2; scale controls output resolution relative to the chart’s rendered size. Set source dimensions and scale deliberately to avoid unexpectedly huge files or blurry output.
PDF is a separate route
Local PDF export is opt-in and requires offline-exporting.js and third-party libraries. Highcharts says PDF export does not support images and will fall back to the export server. Confirm the current library’s PDF requirements before treating it like PNG or SVG export; see the client-side export documentation.
Control data sent outside the browser
Highcharts documents that its public export service receives the generated chart SVG and returns an image. From 12.3.0, PNG, JPEG, and SVG are local by default, but fallback behavior can depend on browser support and configuration. If chart data must remain within your infrastructure, verify the deployed version and actual export route. Local export or a self-hosted server are options described by Highcharts. See its FAQ on export-service data flow.
4. Render Highcharts on a server or in a batch
For scheduled jobs, reports, or bulk generation, Highcharts documents a Node.js export server that accepts chart configurations or chart SVG and can produce PNG, JPEG, PDF, or SVG. Its command-line tool supports batch conversion. This can move rendering out of a user’s browser and into a repeatable job, but deployment requirements and runtime compatibility should be checked against the current server-side rendering guide.
# Consult the Highcharts server-side guide for installation and CLI options.
# A typical workflow is:
# 1. Install and configure the documented Node.js export server.
# 2. Store a chart configuration or SVG input for each job.
# 3. Invoke the CLI with the input and desired output format.
# 4. Check the process exit status and confirm the output file exists.
CLI flags and package setup can change, so use the official guide’s commands for the exact version you deploy rather than copying a guessed command. For batches, use bounded concurrency: each render consumes CPU and memory, and starting every chart simultaneously can exhaust a worker. Keep inputs and outputs uniquely named, retry only transient failures, and record a job identifier with the failure cause.
5. Render Chart.js in Node.js
Chart.js documents server rendering through a canvas implementation such as node-canvas or skia-canvas. The chart configuration and data are rendered in Node.js, then the canvas can produce a PNG buffer. Follow the current Chart.js Node.js guide for installation and platform prerequisites.
const { ChartJSNodeCanvas } = require("chartjs-node-canvas");
const fs = require("node:fs/promises");

async function main() {
  const width = 1200;
  const height = 700;
  const renderer = new ChartJSNodeCanvas({ width, height });
  const configuration = {
    type: "bar",
    data: {
      labels: ["Jan", "Feb", "Mar"],
      datasets: [{ label: "Signups", data: [29, 71, 106] }]
    },
    options: {
      responsive: false,
      animation: false,
      plugins: { title: { display: true, text: "Monthly signups" } }
    }
  };

  const png = await renderer.renderToBuffer(configuration, "image/png");
  await fs.writeFile("monthly-signups.png", png);
}

main().catch(error => {
  console.error(error);
  process.exitCode = 1;
});
Install and configure the canvas package according to the Chart.js instructions for your operating system. In server rendering, specify fixed dimensions and disable animation so the result is deterministic. Test fonts and any plugins in the same runtime image used in production; browser-installed fonts and APIs are not automatically available to Node.js.
6. Capture a rendered chart as a page image
Sometimes the deliverable should show the chart exactly as it appears in a web application, including a title, legend, annotations, or neighboring HTML. A browser screenshot can capture a full page or one element. The capture must happen after the chart has rendered and after required fonts and data have loaded.
Playwright example
const { chromium } = require("playwright");

(async () => {
  const browser = await chromium.launch({ headless: true });
  try {
    const page = await browser.newPage({ viewport: { width: 1440, height: 900 } });
    await page.goto("https://example.com/dashboard", { waitUntil: "networkidle" });
    await page.locator("#chart").waitFor({ state: "visible" });
    await page.locator("#chart").screenshot({ path: "chart.png" });
  } finally {
    await browser.close();
  }
})();
Replace the example URL and selector with your application’s real page and chart container. If the page continuously polls or uses long-lived network connections, networkidle may never occur; wait for a chart-ready selector or application signal instead. For very tall charts, full-page capture can consume substantial memory. An element capture keeps the output focused.
7. Or skip the browser setup
If the chart is already rendered on a reachable page, ScreenshotNeo can capture the page or a CSS-selected chart element through one API request. It is a website screenshot API and MCP server for developers. The one-call flow is useful when you do not want to maintain browser binaries, rendering workers, or screenshot orchestration. See the ScreenshotNeo API documentation for capture parameters.
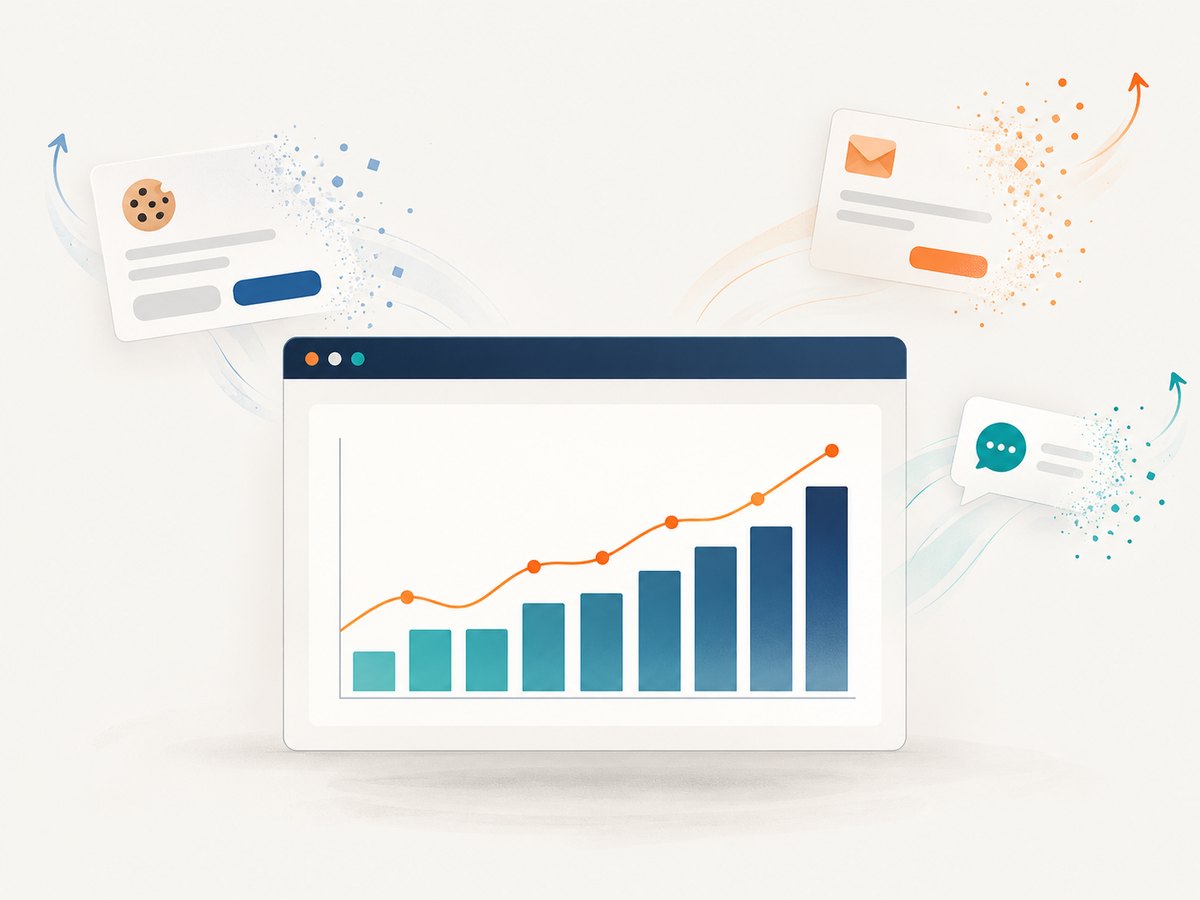
curl -G "https://api.screenshotneo.com/v1/shot" -d access_key=YOUR_API_KEY --data-urlencode url=https://example.com/dashboard -o shot.webpScreenshotNeo removes cookie and consent banners, newsletter popups, and chat widgets before capture; each cleanup step can be turned off. Bot checks, blank pages, timeouts, failed loads, and cache hits cost nothing, and the response identifies the page verdict and billing status in headers. Its MCP server provides take_screenshot, get_page_info, and capture_pdf tools for Claude, Cursor, and other MCP clients. The free plan includes 1,000 shots per month without a card; paid plans start at $5 for 3,000 shots. All features are available on every plan. Learn more at ScreenshotNeo.
import requests

r = requests.get("https://api.screenshotneo.com/v1/shot", params={"access_key": "YOUR_API_KEY", "url": "https://example.com/dashboard"}, timeout=90)
open("shot.webp", "wb").write(r.content)
const q = new URLSearchParams({ access_key: 'YOUR_API_KEY', url: 'https://example.com/dashboard' });
const res = await fetch(`https://api.screenshotneo.com/v1/shot?${q}`);
if (!res.ok) throw new Error(`Screenshot request failed: ${res.status}`);
const bytes = Buffer.from(await res.arrayBuffer());
await import('node:fs/promises').then(fs => fs.writeFile('shot.webp', bytes));To capture just the chart, set the CSS selector option documented by ScreenshotNeo; for a sharper output, use the viewport or device-scale options appropriate to the destination. A page screenshot records what the browser rendered. It does not replace a chart library’s export when you specifically need vector output or the chart’s underlying data representation.
Create a free ScreenshotNeo account for 1,000 screenshots a month with no card.
8. Quality, performance, reliability, and cost
Choose resolution and format for the destination
- PNG: a dependable choice for charts with thin lines, labels, and transparency needs.
- JPEG: useful when lossy compression is acceptable; avoid it when crisp text or transparency matters.
- WebP: a raster choice when supported by the downstream system.
- SVG: useful for vector scaling and editing, subject to each library’s handling of raster traces and embedded assets.
Highcharts documents a default export scale of 2. Increasing dimensions or scale makes larger output and uses more memory. Pick the smallest output that meets the actual display or print requirement. Avoid repeatedly upscaling a small raster export; render at the intended size.
Make output repeatable
- Wait for chart data and fonts before exporting.
- Use fixed dimensions and disable animation in automated rendering.
- Set locale, time zone, and data range explicitly if labels depend on them.
- Use a stable chart configuration and record its version with generated artifacts.
- For jobs, apply timeouts, bounded parallelism, and retries for transient failures only.
- Check the output file type and nonzero size before marking a job successful.
Cost and privacy tradeoffs
Browser-side exports avoid a separate rendering service for supported formats, but the user’s device performs the work. Server rendering adds infrastructure and operational costs, especially for large batches, while making output generation easier to centralize. A public export service may transmit chart SVG; Highcharts documents this data flow and local or self-hosted alternatives. For page screenshot APIs, account for the service’s billing rules and avoid sending sensitive page URLs or credentials without reviewing its documentation and your own data requirements.
9. Troubleshooting
| Symptom | Likely cause | Fix |
|---|---|---|
| Export button does nothing | Exporting module missing, chart not initialized, or handler called before render completion. | Load the required module and invoke export after chart creation resolves. |
| Highcharts export unexpectedly uses a server | Older version, unsupported browser path, or fallback configuration. | Check Highcharts version and fallback settings; test the actual deployment route. |
| PDF export omits images or falls back | Local PDF has different dependencies and image support limits. | Use the documented PDF dependency path and review the current limitations. |
| Plotly SVG has fuzzy sections | A WebGL trace is represented as raster content within the SVG. | Use a raster format at sufficient dimensions, or choose a non-WebGL trace if vector output is essential. |
| Chart screenshot is blank | Capture ran before data or chart rendering completed. | Wait on a chart-ready selector or app event; check data requests and console errors. |
| Text differs between browser and server | Fonts or plugins differ in the Node runtime. | Install required fonts in the rendering environment and verify plugins are registered. |
| Server memory spikes | Oversized output, full-page captures, data URLs retained in memory, or too many parallel jobs. | Reduce dimensions, capture only the chart element, stream or write buffers promptly, and limit concurrency. |
| Canvas package installation fails | Native dependencies or platform setup are missing. | Follow the Chart.js guide for node-canvas or skia-canvas prerequisites for the target platform. |
| Output has clipped labels | Export dimensions or chart margins are too small for labels and legends. | Increase source dimensions or adjust chart layout, then inspect the output at its target size. |
10. Frequently asked questions
Can I convert a chart without taking a screenshot?
Yes. Use the chart library’s export API where available. Plotly and Highcharts provide chart export paths, and Chart.js can render from configuration in Node.js.
Is SVG always a vector image?
No. An SVG can contain raster sections. Plotly specifically notes that WebGL traces may be raster in SVG output.
Which approach is best for many charts?
Use a server-side job designed for batch work, such as Highcharts’ documented Node.js export server and CLI, or render Chart.js configurations in Node.js. Keep concurrency bounded and validate each output.
Can I export a chart if I only have its URL?
If the chart is visible on a page you can access, capture the rendered page or chart element after it loads. A screenshot captures appearance; it does not provide the original chart data or editable chart configuration.


