15 JavaScript Table Libraries for Data Presentation
Compare 15 JavaScript table libraries by architecture, framework fit, workflow, customization, and licensing—and choose one for your data presentation needs.

Choosing a JavaScript table library starts with a more useful question than “Which one is best?”: how much of the table interface should the library provide, and what will people do with the data? A headless engine gives your team control over markup and styling. An HTML-table enhancer adds interactions to existing content. A data grid supplies a ready-made interface. A spreadsheet-like component is designed for editing and data entry.
This guide compares 15 options by architecture, framework fit, workflow, customization, and licensing boundaries. There is no neutral, same-workload benchmark across all 15, so no library is declared objectively fastest or best. If your application also needs screenshots of table views for documentation, reports, or agent workflows, [ScreenshotNeo](https://screenshotneo.com) is a separate website screenshot API and MCP server; it does not replace a table library.
1. Start with the kind of table you are building
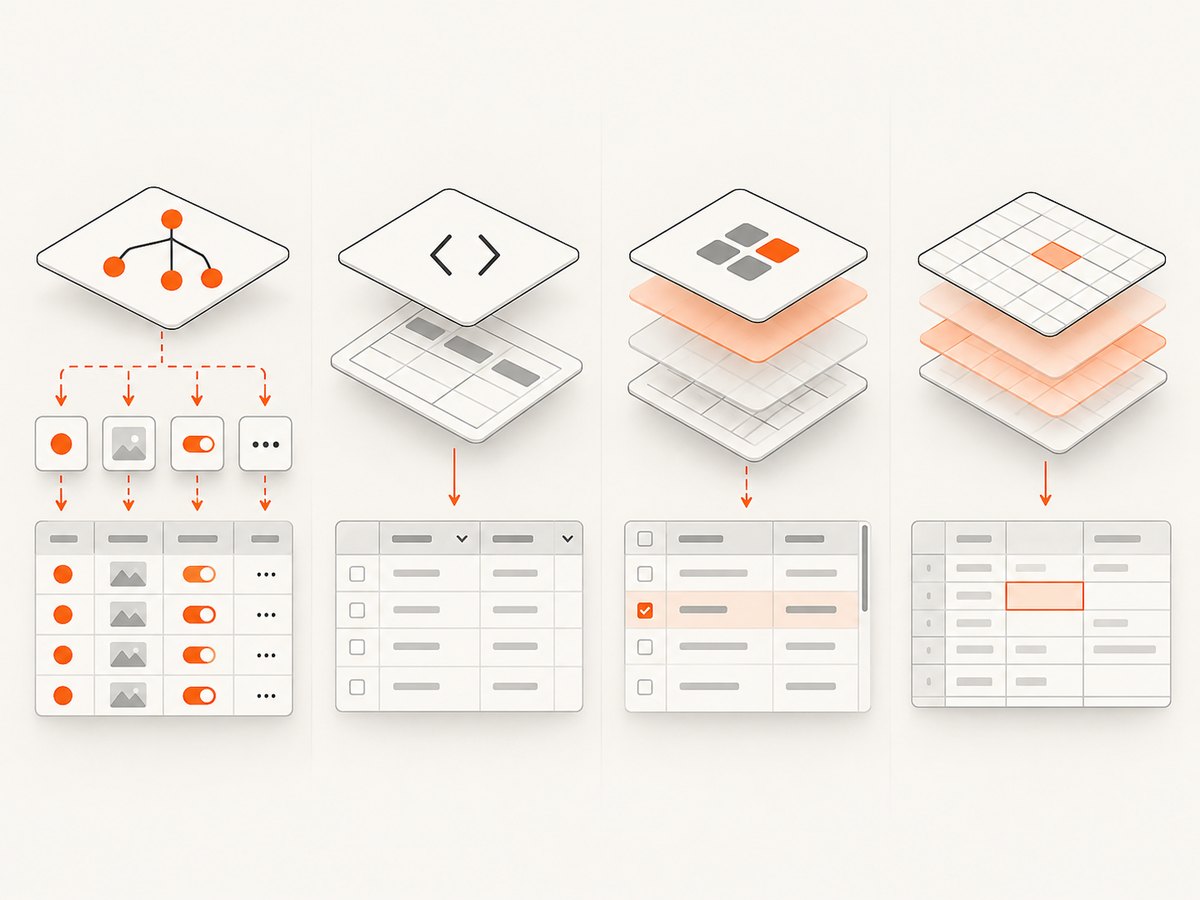
“Table library” covers several different implementation models. Decide which model matches your product before comparing feature checklists.
| Architecture | What the library supplies | Good fit when | Tradeoff |
|---|---|---|---|
| Headless table logic | State, processing, and APIs; your app renders the UI | You need design control or an existing component system | You own markup, styles, accessibility details, and interaction presentation |
| HTML table enhancement | Interactions layered onto semantic table markup | Your data is already represented as an HTML table | Fit depends on how far the existing structure can support the desired interactions |
| Prebuilt data grid | A substantial interactive interface with configurable columns and behaviors | You want working grid interactions without building every control | Styling, framework, and commercial feature boundaries may shape the implementation |
| Spreadsheet-like editor | Grid interactions oriented toward entering or manipulating tabular data | Editing and data-entry workflows are central | It may be more interface than a read-only display needs |
| UI suite with a grid | A grid as part of a broader component library | Your team is also evaluating a wider UI suite | Evaluate the suite’s framework fit and licensing as well as the grid |
TanStack’s documentation describes headless UI as providing logic, state, processing, and APIs without supplying markup, styles, or prebuilt implementations. That distinction explains why headless and prebuilt libraries cannot be compared only by counting built-in features: one is a foundation, the other can be a configured interface. [TanStack Table overview](https://tanstack.com/table/latest/docs/overview)
2. The 15 libraries at a glance
| Library | Architecture and fit | Check before choosing |
|---|---|---|
| TanStack Table | Headless table engine with adapters for multiple frameworks, plus direct JavaScript use through @tanstack/table-core. |
How much UI your team is prepared to build and maintain. |
| AG Grid | Prebuilt JavaScript grid with framework integrations and a free MIT Community edition. | Separate Enterprise licensing applies to some capabilities; confirm the exact feature tier. |
| DataTables | Enhances HTML tables with sorting, filtering, paging, extensions, and styling integrations. | Whether its enhancement model fits your starting markup and interface. |
| Handsontable | Spreadsheet-like data grid for editable tabular workflows. | Whether users need to manipulate data rather than primarily scan it; review current licensing. |
| MUI X Data Grid | React-first grid with UI, styling, and Material UI integration. | Community is MIT-licensed; advanced features require Pro or Premium commercial licensing. |
| Tabulator | Plain-JavaScript grid, usable with React; documents sorting, filtering, inline editing, grouping, pagination, and virtual DOM rendering. | Validate the specific framework integration and workload; virtual rendering is not a performance guarantee. |
| RevoGrid | Web Component-based grid with frontend integrations; documents virtual rows and columns, editing, selection, sorting, and filtering. | Its core is MIT-licensed, and separate Pro licensing exists. Check which tier includes needed features. |
| Syncfusion React Data Grid | React grid with column definitions and a structured quick start. | It documents license-key registration; inspect applicable terms before adoption. |
| Grid.js | Advanced JavaScript table plugin. | Check current framework support, features, maintenance, and API details in its documentation. |
| React Data Grid (Comcast) | Customizable React data-grid component maintained in the Comcast repository. | Check repository activity and current API details before committing. |
| KendoReact Grid | React grid from Progress Telerik, in a commercial component-suite context. | Verify current edition, pricing, and licensing directly; these can change. |
| DevExtreme DataGrid | DevExpress DataGrid component with React getting-started documentation. | Check framework fit and licensing in the context of the broader component suite. |
| SlickGrid | JavaScript grid and spreadsheet project with a public repository. | Confirm the maintained distribution, wrapper, and support status of the variant you plan to use. |
| Webix | JavaScript UI library that includes data-grid functionality. | Check current grid details and licensing if evaluating the broader library. |
| DHTMLX Grid | JavaScript DataGrid/DataTable widget. | Validate current features and licensing for your deployment. |
This is a shortlist, not a universal ranking. Documentation depth and product scope differ, and feature availability may change. Follow each project’s current official documentation before deciding.
3. How to choose: a practical decision path
- Choose the workflow. Is the table read-only, sortable and filterable, editable inline, or spreadsheet-like? If users primarily enter and manipulate cells, examine Handsontable and editable grid options. If they mainly scan records, a lighter presentation or enhancement approach may be enough.
- Set the UI ownership boundary. If your team needs its own markup and visual system, consider headless TanStack Table. If you want an existing grid UI to configure, compare AG Grid, MUI X, Tabulator, RevoGrid, and the suite-based grids against the exact interactions you need.
- Match your rendering environment. React-only choices include MUI X and Comcast React Data Grid. TanStack documents adapters for React, Preact, Vue, Solid, Svelte, Angular, Ember, Lit, Alpine, and others. RevoGrid uses a Web Component core; Tabulator offers plain JavaScript and React integration. Confirm the current adapter and version support for your stack.
- Check data and interaction shape. Record row and column counts, how often values update, whether sorting and filtering run locally or remotely, whether users select ranges, and how pagination works. These details determine architecture and test needs.
- Map required features to license tiers. Write down the features that are must-haves, then verify which edition supplies each one. AG Grid separates Community and Enterprise capabilities; MUI X separates Community, Pro, and Premium; RevoGrid has separate Pro licensing; Syncfusion documents license registration. Verify terms for all commercial suite options.
- Prototype with representative data. Implement the same columns, row volume, update pattern, and key interactions in the finalists. Measure on the browsers and devices your users rely on.
4. Runnable starting points
These small examples establish the two common starting models: rendering an existing semantic table with DataTables, and using TanStack Table’s React adapter for app-owned UI. Package APIs evolve, so check the linked current quick starts for your installed version.
DataTables: enhance an existing HTML table
The official npm package shown in the documentation is datatables.net-dt. This example assumes a project with a bundler that handles CSS imports and an HTML table already in the page.
npm install datatables.net-dt// main.js
import DataTable from 'datatables.net-dt';
import 'datatables.net-dt/css/dataTables.dataTables.css';
new DataTable('#orders');<table id="orders">
<thead>
<tr><th>Order</th><th>Customer</th><th>Total</th></tr>
</thead>
<tbody>
<tr><td>A-102</td><td>Mina Patel</td><td>$48.00</td></tr>
<tr><td>A-103</td><td>Sam Rivera</td><td>$76.50</td></tr>
</tbody>
</table>Start with semantic headers and rows. Add extensions or styling integration only when the product needs them. DataTables also documents a browser CDN route; follow its current installation guide if you do not bundle through npm. [DataTables installation](https://datatables.net/manual/installation)
TanStack Table: own the React markup
TanStack’s React quick start uses @tanstack/react-table. This component renders a basic table from local data; it intentionally leaves visual styling to the application.
npm install @tanstack/react-tableimport * as React from 'react';
import {
flexRender,
getCoreRowModel,
useReactTable,
} from '@tanstack/react-table';
const data = [
{ order: 'A-102', customer: 'Mina Patel', total: 48 },
{ order: 'A-103', customer: 'Sam Rivera', total: 76.5 },
];
const columns = [
{ accessorKey: 'order', header: 'Order' },
{ accessorKey: 'customer', header: 'Customer' },
{ accessorKey: 'total', header: 'Total' },
];
export function OrdersTable() {
const table = useReactTable({
data,
columns,
getCoreRowModel: getCoreRowModel(),
});
return (
<table>
<thead>
{table.getHeaderGroups().map(group => (
<tr key={group.id}>
{group.headers.map(header => (
<th key={header.id}>
{header.isPlaceholder
? null
: flexRender(header.column.columnDef.header, header.getContext())}
</th>
))}
</tr>
))}
</thead>
<tbody>
{table.getRowModel().rows.map(row => (
<tr key={row.id}>
{row.getVisibleCells().map(cell => (
<td key={cell.id}>
{flexRender(cell.column.columnDef.cell, cell.getContext())}
</td>
))}
</tr>
))}
</tbody>
</table>
);
}This is a core-row-model example, not a full sorting, filtering, or pagination implementation. Add the relevant state and row models for those behaviors using the current TanStack docs. If you choose direct JavaScript rather than React, the TanStack core is available separately as @tanstack/table-core. [TanStack React quick start](https://tanstack.com/table/latest/docs/quick-start)
5. Performance, scale, and reliability
Do not select a library from a vendor performance claim or the presence of “virtual” in a feature list. Virtual rows or columns can reduce the number of rendered elements, but they do not tell you how the full application behaves under your data, updates, cell renderers, browser, and device.
Benchmark the workload you will ship
- Use representative row and column counts, including long text and realistic cell types.
- Measure initial render, sort and filter response, scrolling, edit latency, and update frequency.
- Test local processing and remote data paths separately; server-side sorting and filtering have different network and backend costs.
- Repeat on the oldest supported device and browser, not only a development workstation.
- Include custom cell rendering, selection, grouping, and other interactions you expect to enable.
For reliability, test empty results, malformed or missing values, slow data responses, failed requests, and rapid successive updates. Decide which layer owns sorting and filtering so the client and server do not apply conflicting rules. Keep stable row identity where the chosen library expects it, and verify that edits and selection remain associated with the correct record after sorting or refreshing.
6. Licensing and maintenance checklist
- Identify the exact package, wrapper, or edition you will deploy; names can cover multiple distributions.
- Confirm whether every needed feature is in the open-source/community tier or requires a paid license.
- Check attribution, redistribution, deployment, and license-key requirements in the current official terms.
- Review release history, issue handling, migration guidance, and framework-version compatibility.
- Estimate total ownership: implementation time for headless UI, migration work, paid tiers, and maintenance of custom behavior.
For example, AG Grid’s Community edition is MIT-licensed while Enterprise is separately licensed; MUI X’s Community components are MIT-licensed, with advanced features in commercial Pro or Premium plans. Syncfusion documents license-key registration. These are meaningful boundaries, but the exact terms and feature maps should be confirmed from the vendor before adoption. [AG Grid installation](https://www.ag-grid.com/javascript-data-grid/getting-started/), [MUI X licensing](https://mui.com/x/introduction/licensing/), [Syncfusion React Data Grid](https://ej2.syncfusion.com/react/documentation/grid/getting-started)
7. Common problems and fixes
| Symptom | Likely cause | What to check |
|---|---|---|
| A headless table appears unstyled or lacks controls | Expected: a headless engine provides logic, not a prebuilt UI. | Render headers, cells, controls, and styles in your app, or choose a prebuilt grid. |
| The HTML table enhancement shows no useful rows | Markup, selector, or initialization timing does not match the page. | Confirm the table exists when initialization runs and that its header and body structure is valid. |
| Rows or columns misalign after adding a grid | Conflicting CSS, width constraints, or incompatible container sizing. | Inspect the grid’s required styles, parent dimensions, and responsive layout behavior. |
| Sorting a page of remote data gives unexpected results | Only the current page may be sorted locally. | Decide whether sorting is client-side or server-side and send the sort state to the responsible layer. |
| Editing changes the wrong record after sorting | Application state may use a visible row index instead of a stable record identity. | Use stable keys or IDs and test edits after sort, filter, and refresh. |
| A required capability is unavailable | It may belong to a commercial tier or a different product edition. | Map the specific feature to the current licensing matrix before implementation. |
| A “virtual” grid still feels slow | Heavy cell rendering, frequent state changes, layout work, or data processing may dominate. | Profile the actual interaction, simplify renderers, reduce unnecessary updates, and compare finalists on the same dataset. |
| Package example fails after installation | Docs may target a different release, framework adapter, module system, or stylesheet path. | Use the current official quick start for the exact package and version in your project. |
8. Or skip the browser setup
If you need a screenshot of a rendered table view, ScreenshotNeo can capture a URL with one GET request. It is a separate service from the table libraries above. Cookie banners, popups, and chat widgets are removed before the shot; bot checks, blank pages, and failed loads are never billed. An MCP server lets AI agents use screenshots, and 1,000 screenshots a month are free with no card; paid plans start at $5 for 3,000.
Here is a cURL call; the [ScreenshotNeo docs](https://screenshotneo.com/docs/) cover the API. Replace the URL with a publicly reachable page and provide your API key.
curl -G "https://api.screenshotneo.com/v1/shot" \
  -d access_key=YOUR_API_KEY \
  --data-urlencode url=https://example.com/dashboard \
  -o table-view.webp
Use the image parameter for PNG, JPEG, or WebP output, or request PDF when you need a document. For private or authenticated pages, consult the docs for supported request options. Each response includes X-Page-Verdict and X-Billed headers so you can tell what happened and whether a shot was billed. Free signup: [get 1,000 screenshots a month with no card](https://screenshotneo.com/account/sign-up/).
9. Frequently asked questions
Which option should I start with if I already have an HTML table?
Look first at DataTables, which is designed to enhance HTML tables with interactions. Confirm that the existing markup and required extensions suit your use case.
Can I use TanStack Table without React?
Yes. Its documentation lists multiple framework adapters and direct JavaScript use through @tanstack/table-core. Choose the adapter or core package that matches your rendering setup.
Which library is best for spreadsheet-style data entry?
Handsontable is explicitly aimed at spreadsheet-like editable workflows. Also compare the editing and licensing details of grid products against the precise operations your users need.
Is a virtualized grid automatically faster?
No. Virtual rendering is one technique. Benchmark with your own data, cell renderers, interactions, target browsers, and devices.
Do I need a commercial license for a production table?
That depends on the product, edition, features, and applicable terms. Verify the current license for the exact capabilities and deployment you plan to use.


