Load Testing with Puppeteer
Use Puppeteer to measure realistic browser journeys, collect useful performance metrics, and understand when to add protocol-level load generation.
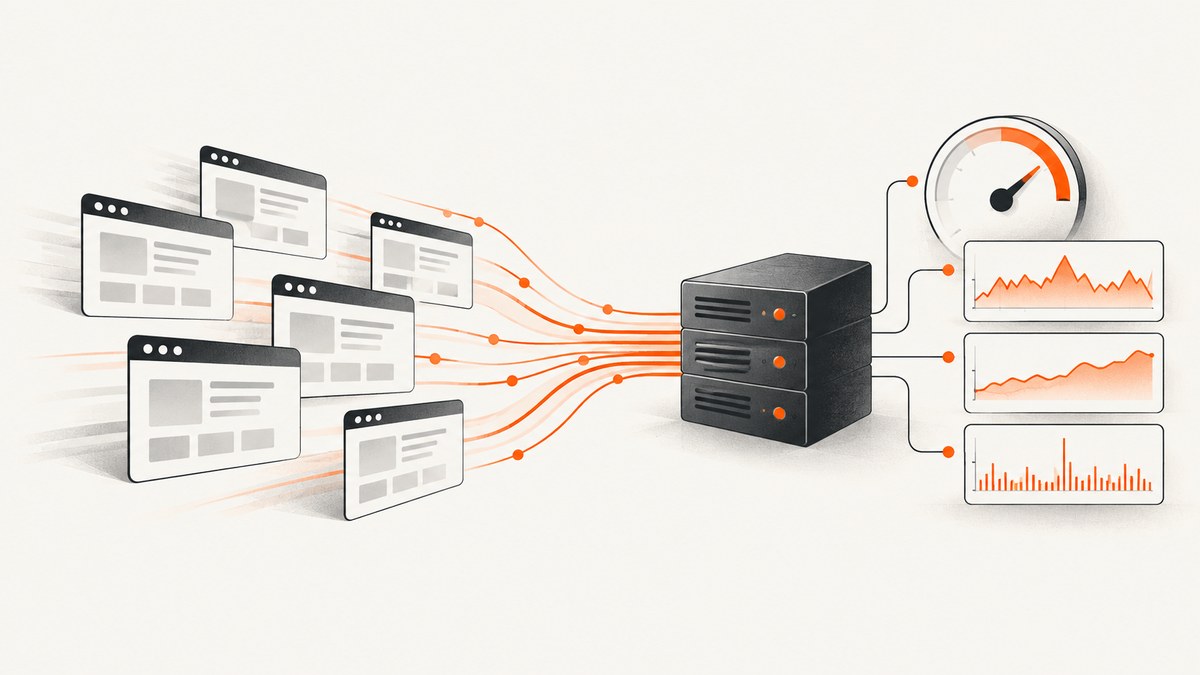
Puppeteer can load test a website by automating realistic journeys in Chrome or Firefox and recording navigation, interaction, request, browser, and user experience metrics. It is a good way to measure what a real page does, but it is not a complete distributed load generator: browsers consume substantial CPU and memory, so use protocol-level virtual users for most high-volume traffic and a smaller Puppeteer cohort for browser fidelity.
This guide shows a runnable Node.js setup, how to control concurrency, collect metrics, add Web Vitals, shape spike and soak tests, interpret results, and troubleshoot common failures. For production-scale runs, calibrate your test workers and correlate browser observations with server-side telemetry.
1. What Puppeteer can and cannot measure
Puppeteer is a JavaScript library that controls Chrome or Firefox through the Chrome DevTools Protocol or WebDriver BiDi. It runs headless by default and can capture a timeline trace. The basic test journey is straightforward: launch a browser, create a page, navigate, perform user actions, collect measurements, and close or reuse the browser. See the Puppeteer getting started guide and Puppeteer documentation.
A browser test answers questions such as: Does the checkout journey still work under load? Does the menu become sluggish? How do layout, JavaScript, and rendering change? It does not cheaply simulate thousands of independent users. A browser page runs scripts, lays out a DOM, downloads assets, and paints pixels. Artillery’s operational guidance is to budget at least one vCPU per concurrent headless browser instance as a starting point; actual capacity depends on the app and worker. See Artillery’s browser engine limits.
| Question | Best fit |
|---|---|
| Does a critical user journey render and behave correctly? | Puppeteer browser journeys |
| How does the service respond to very high request volume? | Protocol-level load generation |
| How does frontend experience change while the backend is busy? | Hybrid: protocol traffic plus a smaller browser cohort |
Do not equate the number of open Puppeteer pages with the same number of real users. Browser CPU, memory, network, cache, and third-party activity all change the load profile.
2. Install and run a single Puppeteer journey
Start by capturing one reliable baseline journey. This runnable example visits a page, waits for a visible page state, records the journey duration and Puppeteer browser metrics, then closes the browser even if navigation fails.
npm init -y
npm install puppeteer
// journey.mjs
import puppeteer from 'puppeteer';

const target = process.env.TARGET_URL ?? 'https://example.com';
const browser = await puppeteer.launch({ headless: true });

try {
  const page = await browser.newPage();
  const failures = [];
  page.on('requestfailed', request => {
    failures.push({ url: request.url(), error: request.failure()?.errorText });
  });

  const started = performance.now();
  const response = await page.goto(target, {
    waitUntil: 'domcontentloaded',
    timeout: 30_000,
  });

  if (!response || !response.ok()) {
    throw new Error(`Navigation failed: HTTP ${response?.status() ?? 'no response'}`);
  }

  // Replace this with a selector or interaction from the journey you need to measure.
  await page.locator('body').wait();
  const journeyMs = performance.now() - started;
  const browserMetrics = await page.metrics();

  console.log(JSON.stringify({
    url: page.url(),
    status: response.status(),
    journeyMs,
    browserMetrics,
    failedRequests: failures,
  }, null, 2));
} finally {
  await browser.close();
}
TARGET_URL=https://your-site.example node journey.mjsUse a journey-specific end condition. For a product page, that might be the product title becoming visible; for a search flow, wait for the result list; for checkout, wait for the confirmation state. A navigation event alone may finish before the meaningful content appears.
3. Add controlled concurrency without unbounded browsers
For a small controlled cohort, reuse one browser process and cap the number of active pages. The following example runs a fixed number of journeys in parallel and gives every journey its own page and result. It is an example harness, not a distributed load generator; increase concurrency only after measuring runner capacity.
// cohort.mjs
import puppeteer from 'puppeteer';

const target = process.env.TARGET_URL ?? 'https://example.com';
const users = Number(process.env.USERS ?? 4);
const runs = Number(process.env.RUNS ?? 12);
if (!Number.isInteger(users) || users < 1 || !Number.isInteger(runs) || runs < 1) {
  throw new Error('USERS and RUNS must be positive integers');
}

const browser = await puppeteer.launch({ headless: true });
const results = [];
let next = 0;

async function worker() {
  while (true) {
    const id = next++;
    if (id >= runs) return;
    const page = await browser.newPage();
    const start = performance.now();
    try {
      const response = await page.goto(target, {
        waitUntil: 'domcontentloaded', timeout: 30_000,
      });
      if (!response || !response.ok()) {
        throw new Error(`HTTP ${response?.status() ?? 'no response'}`);
      }
      await page.locator('body').wait();
      results.push({ id, ok: true, status: response.status(), ms: performance.now() - start,
        metrics: await page.metrics() });
    } catch (error) {
      results.push({ id, ok: false, ms: performance.now() - start, error: String(error) });
    } finally {
      await page.close();
    }
  }
}

try {
  await Promise.all(Array.from({ length: Math.min(users, runs) }, worker));
} finally {
  await browser.close();
}

const good = results.filter(r => r.ok).map(r => r.ms).sort((a, b) => a - b);
const percentile = p => good.length ? good[Math.min(good.length - 1, Math.ceil(p * good.length) - 1)] : null;
console.log(JSON.stringify({
  requestedRuns: runs,
  succeeded: good.length,
  failed: results.length - good.length,
  p50Ms: percentile(0.50),
  p95Ms: percentile(0.95),
  results,
}, null, 2));
This simple harness intentionally keeps browser creation outside the loop. In a longer-running test, also control pacing, data, cookies, and cache behavior. A burst of identical requests from one page context can create an unrealistic cache profile. Use unique accounts or records when appropriate, and avoid repeatedly mutating shared test data.
4. Choose the right measurements
Record more than “page loaded.” `load` and `DOMContentLoaded` are lifecycle events, not complete measures of user experience or bottlenecks. Grafana k6’s browser metrics guidance cautions that relying on load events alone does not identify critical performance problems. Collect journey duration and status alongside browser and frontend metrics.
| Signal | What it helps identify | Collection idea |
|---|---|---|
| HTTP status and failed requests | Availability, dependency or network failures | Navigation response and request event listeners |
| Journey duration and percentiles | Slow-tail user experience | Start/end markers around the complete interaction |
| TaskDuration, ScriptDuration | Main-thread and script work | await page.metrics() |
| JSHeapUsedSize | JavaScript heap pressure | Puppeteer Metrics |
| LayoutDuration, Nodes | Layout work and DOM growth | Puppeteer Metrics |
| LCP, CLS, INP, FCP, TTFB | Frontend loading, stability, interaction and server response experience | Collect Web Vitals in the page or a load testing tool that supports browser metrics |
Puppeteer’s Page Metrics interface includes browser internals such as task and script duration, layout duration, style recalculation, DOM node count, document and frame counts, and JavaScript heap size. These are useful diagnostic signals, but they are not substitutes for user-focused metrics or server-side monitoring.
For Web Vitals and custom Performance API measures, use an appropriate collector. Artillery documents browser metrics including Web Vitals and HTTP/step metrics; k6 documents browser Web Vitals and custom Performance API measurements. Sources: Artillery browser engine and k6 browser metrics.
5. Make the test representative
- Write down the journey. Mark its start and meaningful completion, including inputs and expected state.
- Use realistic pacing. Add think time between actions and vary the time between journey starts. Instant looping can overload one part of a service differently from real traffic.
- Vary test data. Use suitable distinct accounts, search terms, or item IDs. Repeating one cached URL does not represent a varied workload.
- Decide cache behavior. State whether the test models warm or cold browser caches. Keep that choice consistent between runs.
- Control third-party requests. Exclude third-party traffic unless you have permission to load it. Otherwise your test may affect systems you do not operate and contaminate results.
- Set boundaries. Use test accounts, avoid production writes unless explicitly approved, and agree on a stop condition with the service owner.
- Measure the runner. Track its CPU and memory. If the worker saturates, the test measures the generator as much as the site.
When authentication matters, establish a test session in the same way a user does or load authorized test cookies. Preserve the relevant state per virtual user; sharing one session can serialize or distort flows. Keep secrets out of committed scripts and logs.
6. Select a test shape
| Test | Purpose | Practical setup |
|---|---|---|
| Baseline | Know normal latency and runner cost | One or a few journeys at low concurrency |
| Ramp or stress | Find where latency, errors, or saturation change | Increase traffic gradually and define stop thresholds |
| Spike | Observe sudden bursts, startup, readiness, and autoscaling | Artillery describes spike tests as typically under 30 minutes |
| Soak | Reveal leaks and resource-pool exhaustion | Artillery describes common soak runs as 6–12 hours, often 10–20% above baseline |
These durations are documented operational guidance, not universal requirements. Choose duration and load based on your objectives, system recovery characteristics, and safe test window. For each run, retain configuration, build/version, test data setup, results, and backend dashboards so comparisons remain meaningful.
7. Scale with a hybrid test
For high volume, let protocol-level virtual users generate most traffic and run a smaller browser cohort against critical journeys. This combines scale with realistic rendering and interaction checks. Grafana k6 describes browser and protocol testing as complementary, and its guidance covers hybrid approaches; Artillery offers browser engine metrics and distributed execution while noting browser workers’ resource demands.
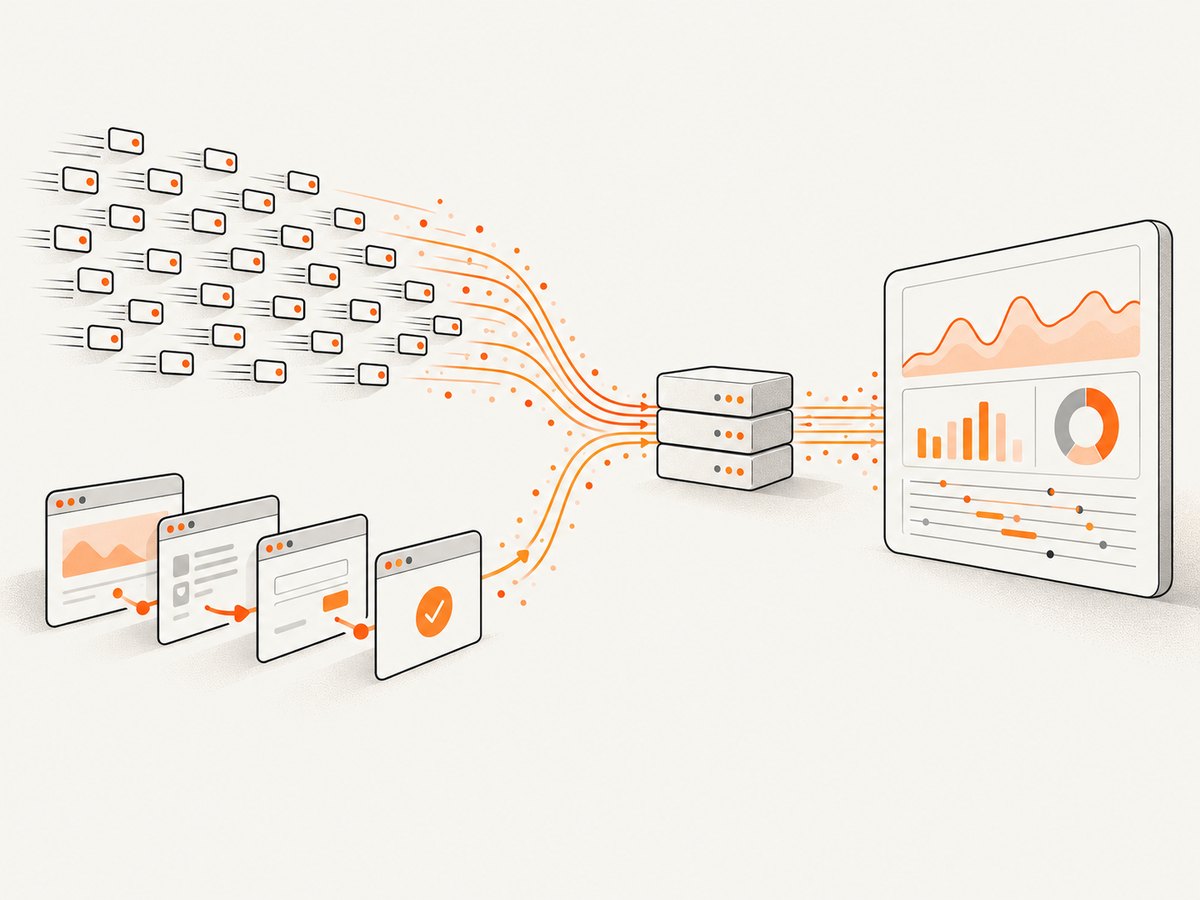
Choose a tool or shape by comparing browser fidelity, resource use per virtual user, Web Vitals support, distributed regions, data and cookie controls, third-party request handling, CI thresholds, monitoring integrations, and report retention. Calibrate one worker at low load first, establish where the generator saturates, then distribute workers and increase traffic gradually. One vCPU per browser is a starting estimate, not a capacity guarantee.
8. Use Puppeteer with Lighthouse for audits
A load journey and a Lighthouse audit answer related but different questions. Lighthouse can audit a page after Puppeteer has established custom state, such as authentication or navigation to a specific page. The Lighthouse documentation describes launching Chrome with Puppeteer, passing a Puppeteer page to Lighthouse, and reading the result; it also documents connecting to an existing Chrome instance. See Lighthouse with Puppeteer.
Keep audits to a controlled cohort: Lighthouse work adds resource cost and can interfere with throughput measurements. Use load tests to characterize performance under traffic, and run audits in a repeatable environment to inspect page quality.
9. Troubleshooting
| Symptom | Likely cause | Fix |
|---|---|---|
| Navigation timeout | Slow page, long-lived requests, overloaded target, or too strict a wait condition | Choose a meaningful readiness condition, set a justified timeout, and inspect failed/unfinished requests. Avoid treating timeout as success. |
| Browser crashes or pages hang as concurrency rises | Worker CPU or memory saturation | Lower concurrency, monitor the runner, use more workers, or move the bulk load to protocol-level traffic. |
| Results vary widely between runs | Changing data, cache state, pacing, third-party dependencies, or runner contention | Control those inputs, repeat runs, report percentiles and errors, and compare equivalent test windows. |
| HTTP failures appear only during the test | Target capacity, rate limits, test data conflicts, or dependency bottleneck | Correlate timestamps with server logs and monitoring; verify the load is authorized and data is isolated. |
| Journey reports success but the feature is broken | Test waits only for navigation and never asserts the expected page state | Wait for a feature-specific selector and assert content or state before recording success. |
| Metrics point to a slow browser but server looks healthy | Frontend script/layout work, local runner pressure, or network/third-party delay | Compare browser metrics, Web Vitals, request timings, and runner telemetry; isolate third-party traffic with permission. |
10. Performance, reliability, and cost notes
Browser instances consume CPU and memory, so the cost of a browser-heavy test includes worker compute, setup time, and result storage. Control concurrency and avoid launching a fresh browser for each iteration. Reuse a browser process where appropriate, but create isolated pages and session state for independent journeys. Keep traces and verbose logs only when they answer a diagnostic question.
Reliability comes from repeatable inputs and honest failure handling. Count timeouts and failed navigations as failures, preserve run metadata, use timeouts at each meaningful wait, and close pages and browsers in cleanup paths. Establish thresholds from service objectives and baseline variability rather than copying a generic number. Always correlate browser findings with server-side metrics; browser timing alone cannot determine whether the application, runner, network, or a dependency caused a slowdown.
11. Or skip the browser setup
If your task is to capture a website screenshot as part of a workflow, ScreenshotNeo offers a one-request screenshot API and an MCP server. It is not a load generator or a substitute for the Puppeteer journey above; it can handle screenshot capture without you maintaining browser setup. See the ScreenshotNeo API documentation.
curl -G "https://api.screenshotneo.com/v1/shot" -d access_key=YOUR_API_KEY --data-urlencode url=https://stripe.com -o shot.webpimport requests
r = requests.get("https://api.screenshotneo.com/v1/shot", params={"access_key": "YOUR_API_KEY", "url": "https://stripe.com"}, timeout=90)
open("shot.webp", "wb").write(r.content)const q = new URLSearchParams({ access_key: 'YOUR_API_KEY', url: 'https://stripe.com' });
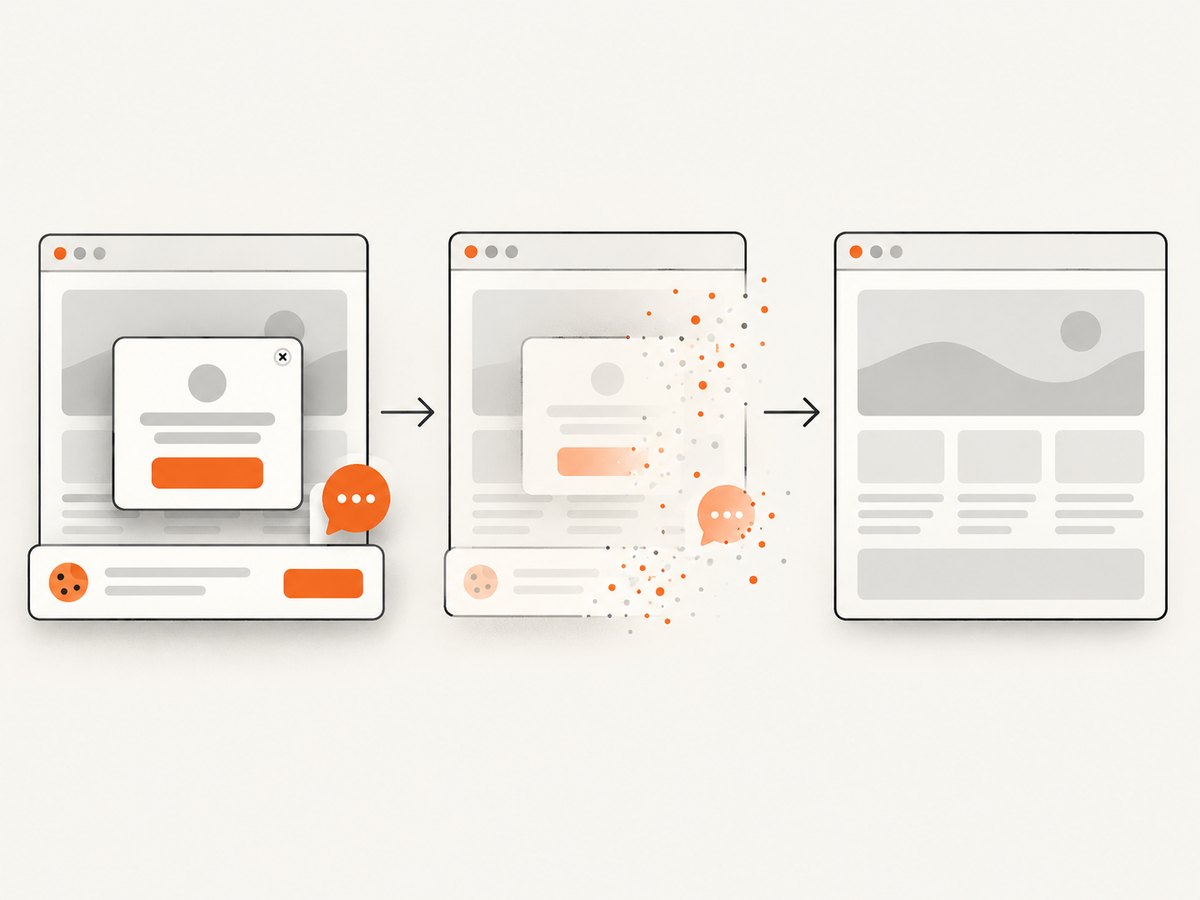
const res = await fetch(`https://api.screenshotneo.com/v1/shot?${q}`);- Cookie banners are accepted and removed, along with supported newsletter popups and chat widgets, before the shot.
- Bot checks, blank pages, timeouts, failed loads, and cache hits are not billed; response headers report the page verdict and billing status.
- An MCP server lets AI agents use screenshot tools, including
take_screenshot,get_page_info, andcapture_pdf. - The free plan includes 1,000 screenshots per month with no card; paid plans start at $5 for 3,000. Every feature is on every plan.
Create a free ScreenshotNeo account for 1,000 screenshots a month with no card.
12. Frequently asked questions
Can Puppeteer simulate thousands of concurrent users?
It can control many pages, but browser resource use makes that an expensive way to generate very high traffic. Use protocol-level load for most virtual users and reserve browsers for key journeys.
Should I use networkidle for every navigation?
No. Pages with analytics, polling, or persistent requests may never become idle. Wait for the state that means the tested journey is ready.
Is a screenshot enough to prove the page is fast?
No. A screenshot is a visual artifact. For performance conclusions, collect timings, Web Vitals, browser metrics, request outcomes, and server telemetry.
Can I run this against a third-party site?
Only when you have permission and the test will not create disruptive traffic. Prefer a controlled environment or the service owner’s approved test window.


