How to Find the Mean, Median, and Mode in Python
Learn how to calculate mean, median, and mode in Python with the statistics module, handle ties and empty data, and avoid common mistakes.

Python’s standard-library statistics module calculates the mean, median, and mode without requiring third-party packages. For ordinary numeric data, import the module and call statistics.mean(), statistics.median(), and statistics.mode().
import statistics

data = [2, 4, 4, 6, 8]

print("Mean:", statistics.mean(data))
print("Median:", statistics.median(data))
print("Mode:", statistics.mode(data))
This prints:
Mean: 4.8
Median: 4
Mode: 4
The mean is the arithmetic average, the median is the middle value after sorting, and the mode is the most frequently occurring value. The rest of this guide explains exactly how each function behaves, including even-sized datasets, tied modes, empty input, non-numeric values, precision, and production concerns.
Use Python’s statistics module
The module is included with Python, so installation is not required. You can use qualified names:
import statistics

values = [2, 4, 4, 6, 8]
mean_value = statistics.mean(values)
median_value = statistics.median(values)
mode_value = statistics.mode(values)
Or import the functions directly:
from statistics import mean, median, mode

values = [2, 4, 4, 6, 8]

print(mean(values))
print(median(values))
print(mode(values))
Qualified names such as statistics.mean make it clearer where each function comes from in larger programs. Direct imports are convenient in small scripts.
How the mean works
The mean adds every numeric observation and divides the total by the number of observations:
import statistics

scores = [70, 80, 90]
print(statistics.mean(scores))  # 80
The function accepts integer and floating-point values and returns the arithmetic average. A mean can be a value that never appears in the input. For example, the mean of [1, 2] is 1.5.
Use the mean when every value should contribute to the summary and extreme values are meaningful. A very large or very small observation can pull the mean toward itself, so the median may describe a skewed dataset better.
Mean with decimals and exact values
For normal measurements, floats are usually sufficient:
import statistics

prices = [19.99, 24.50, 31.25]
print(statistics.mean(prices))
If decimal rounding matters, use decimal.Decimal values rather than converting a rounded result after the calculation:
from decimal import Decimal
import statistics

prices = [Decimal("19.99"), Decimal("24.50"), Decimal("31.25")]
print(statistics.mean(prices))
How the median works
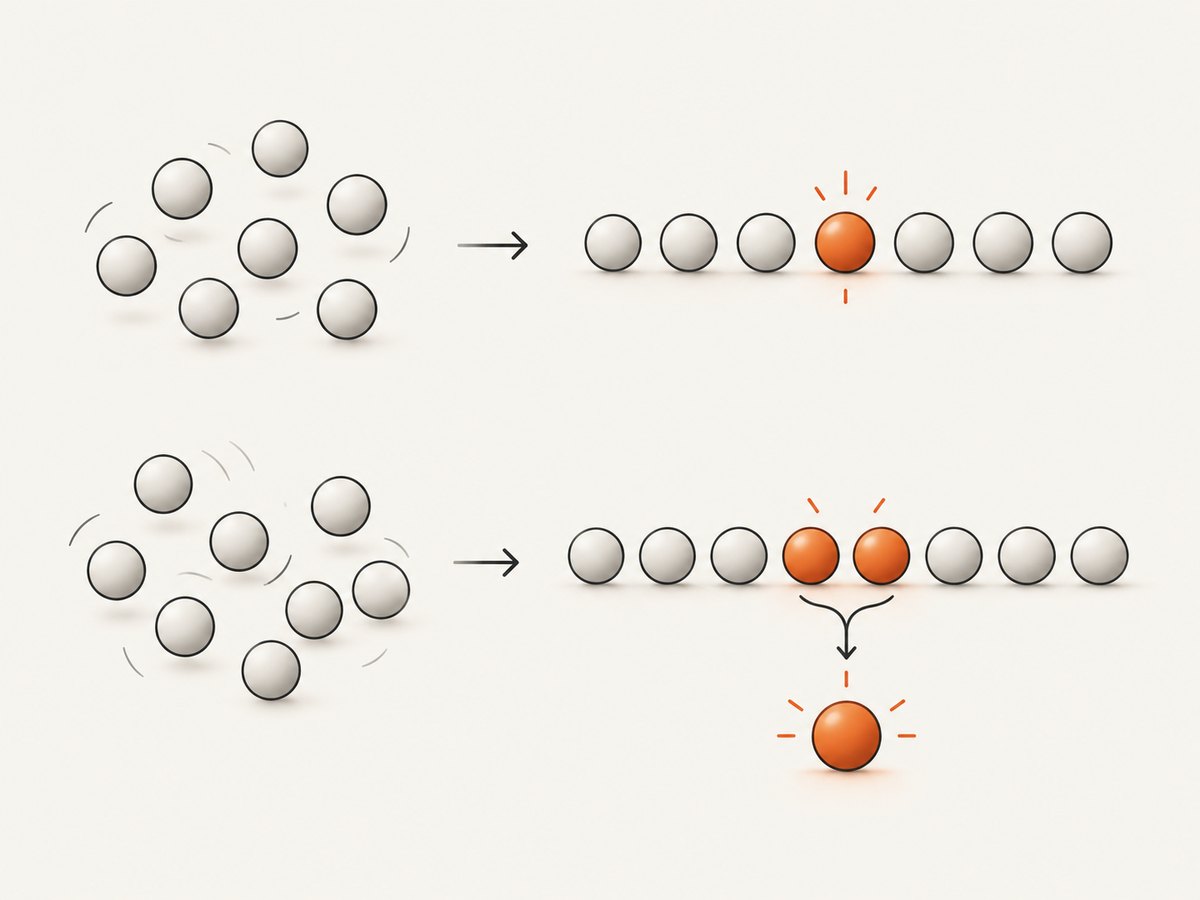
The median is the middle position after the values are ordered. Python’s median() handles both odd and even numbers of observations.
Odd number of values
import statistics

values = [9, 2, 7, 4, 5]
print(statistics.median(values))  # 5
After ordering, the data is [2, 4, 5, 7, 9], so 5 is the middle value. You do not need to sort the list yourself; median() performs the required ordering internally.
Even number of values
With an even number of observations, Python averages the two central values:
import statistics

values = [1, 3, 5, 7]
print(statistics.median(values))  # 4.0
The two central values are 3 and 5, and their average is 4.0. That result does not have to be an observed item.
For ordinal data where averaging is not meaningful, use median_low() or median_high():
import statistics

values = [1, 3, 5, 7]
print(statistics.median_low(values))   # 3
print(statistics.median_high(values))  # 5
median_low() selects the lower middle observation and median_high() selects the higher one. These are useful when the result must be one of the original values, such as a ranked category.
How the mode works
The mode is the value that occurs most often:
import statistics

votes = ["red", "blue", "red", "green", "red"]
print(statistics.mode(votes))  # red
Unlike mean and median, mode() also works with nominal, non-numeric values such as strings. It is appropriate for categories, labels, survey responses, and other values where arithmetic has no meaning.
Several tied modes
A dataset can have multiple values tied for the highest frequency. In Python 3.8 and later, mode() returns the first tied value encountered in the input:
import statistics

values = ["cat", "dog", "dog", "cat"]
print(statistics.mode(values))  # cat
Use multimode() when every tied mode matters:
import statistics

values = ["cat", "dog", "dog", "cat", "bird"]
print(statistics.multimode(values))  # ['cat', 'dog']
multimode() returns tied modes in order of first appearance. If you support Python versions older than 3.8, check that version’s documentation: older behavior for multiple modes differed.
Handling empty data safely
mean(), median(), and mode() raise statistics.StatisticsError when the input is empty. Check before calculating or catch the exception at a user-facing boundary.
import statistics

values = []

if not values:
    print("No data to summarize")
else:
    print("Mean:", statistics.mean(values))
    print("Median:", statistics.median(values))
    print("Mode:", statistics.mode(values))
For a reusable function, make the empty-data policy explicit:
import statistics


def summarize(values):
    if not values:
        return {"mean": None, "median": None, "mode": None}

    return {
        "mean": statistics.mean(values),
        "median": statistics.median(values),
        "mode": statistics.mode(values),
    }

print(summarize([2, 4, 4, 6, 8]))
print(summarize([]))
multimode([]) is different: it returns an empty list rather than raising StatisticsError.
Choosing the right statistic
| Statistic | Use it to answer | Input | Important behavior |
|---|---|---|---|
| Mean | What is the arithmetic average? | Numeric values | Sensitive to extreme values |
| Median | What is the middle position? | Ordered numeric values | Even counts average the two middle values |
| Mode | Which value appears most often? | Numeric or nominal values | Returns one first-encountered winner on a tie |
| Multimode | Which values share the highest frequency? | Any hashable values | Returns all tied modes |
For a distribution with outliers, report both mean and median when readers need context. For categories, report the mode or all modes; a mean of category labels is not meaningful.
Complete example with validation
The following script validates that input exists, calculates all three measures, and reports tied modes:
import statistics


def describe(values):
    if not values:
        raise ValueError("values must contain at least one item")

    return {
        "count": len(values),
        "mean": statistics.mean(values),
        "median": statistics.median(values),
        "mode": statistics.mode(values),
        "all_modes": statistics.multimode(values),
    }

numbers = [2, 4, 4, 6, 8]
summary = describe(numbers)

for name, value in summary.items():
    print(f"{name}: {value}")
Keep validation near the boundary where data enters your program. That makes empty lists, malformed records, and unexpected types easier to diagnose than allowing an exception deep inside a reporting step.
Performance, reliability, and data preparation
For small and medium in-memory lists, the standard-library functions are usually the simplest reliable choice. Median calculation requires ordering the observations, so it generally costs more than a single pass through the data. If your input is very large, avoid repeatedly calculating a median inside a loop; collect the required values and calculate once, or use a data-processing system designed for streaming quantiles.
Do not silently coerce bad input. Strings such as "10" are not numeric observations for mean() or median(). Convert and validate deliberately:
raw = ["10", "20", "30"]
values = [float(item) for item in raw]
For reproducible reports, record the number of observations and the filtering rules alongside the result. A mean calculated after dropping missing values answers a different question from a mean calculated after treating missing values as zero.
Troubleshooting common errors
StatisticsError: mean requires at least one data point
Cause: The iterable is empty.
Fix: Check if values before calling the function, or catch statistics.StatisticsError and return a clear validation message.
StatisticsError: no unique mode
Cause: This can occur on older Python versions when multiple values tie.
Fix: Use statistics.multimode() when all winners are needed, or use Python 3.8+ behavior where mode() returns the first encountered winner.
TypeError while calculating mean or median
Cause: The data contains incompatible types, such as strings mixed with numbers.
Fix: Normalize values before calculation and reject records that cannot be converted safely.
The median is a decimal that was not in the list
Cause: The input has an even number of observations, so Python averages the two central values.
Fix: Use median_low() or median_high() when the result must be an observed item.
The mode is not the value you expected
Cause: There is a tie, and mode() selects the first tied value encountered.
Fix: Inspect statistics.multimode(values) and decide whether your application needs a tie-breaking rule.
Or skip the browser setup
If your Python workflow also needs screenshots of charts, reports, or source pages, ScreenshotNeo provides a single website screenshot API request. It accepts the consent banner like a visitor and removes more than 60 known consent platforms, newsletter popups, and chat widgets before capture. Bot checks, blank pages, timeouts, failed loads, and cache hits are not billed, and response headers identify the page verdict and whether the shot was billed.
See the ScreenshotNeo documentation for the complete API reference. This is a direct call; no browser automation setup is required.
cURL
curl -G "https://api.screenshotneo.com/v1/shot" -d access_key=YOUR_API_KEY --data-urlencode url=https://stripe.com -o shot.webpPython
import requests

r = requests.get("https://api.screenshotneo.com/v1/shot", params={"access_key": "YOUR_API_KEY", "url": "https://stripe.com"}, timeout=90)
open("shot.webp", "wb").write(r.content)
Node.js
const q = new URLSearchParams({ access_key: 'YOUR_API_KEY', url: 'https://stripe.com' });
const res = await fetch(`https://api.screenshotneo.com/v1/shot?${q}`);
ScreenshotNeo also supports full-page captures with lazy images loaded, CSS element capture, dark mode, device presets, custom viewports, retina scale, PDFs, custom CSS and JavaScript, clicks, selector waits, delays, network-idle waits, request blocking, headers, cookies, user agents, authorization, timezone, geolocation, transparent backgrounds, resizing, configurable caching, signed links, asynchronous jobs, signed webhooks, bulk capture for up to 100 URLs per call, a usage API, and an OpenAPI specification. Existing parameter names used by other screenshot APIs work as well, which can reduce migration changes.
An MCP server provides take_screenshot, get_page_info, and capture_pdf tools for Claude, Cursor, and other MCP clients. Plans include 1,000 screenshots per month free with no card; paid plans start at $5 for 3,000 shots. Only clean shots are billed, so failed captures do not consume paid usage.
Sign up for the free ScreenshotNeo plan to get 1,000 screenshots each month with no card.
Frequently asked questions
Do I need to install a package?
No. statistics is part of Python’s standard library.
Can mode process strings?
Yes. Mode is the one measure in this module intended for nominal, non-numeric data as well as numbers.
Should I sort the list before calling median?
No. median() performs the ordering needed for its calculation. Sorting yourself is only useful if you also need the ordered data.
How do I get every mode?
Call statistics.multimode(values). It returns all values tied for the highest frequency.
What should an API return for an empty dataset?
Choose a documented policy, such as a validation error or null fields. Do not treat missing data as zero unless that is the intended meaning.
Where is the official reference?
See the Python statistics library documentation for current function signatures, supported types, exceptions, and version notes. The API’s original design is documented in PEP 450.


