How to Monitor JavaScript and CSS Request Status with Selenium Python
Use Selenium’s Chrome DevTools Protocol events to see which JavaScript and CSS requests returned HTTP errors, failed to load, or came from cache.
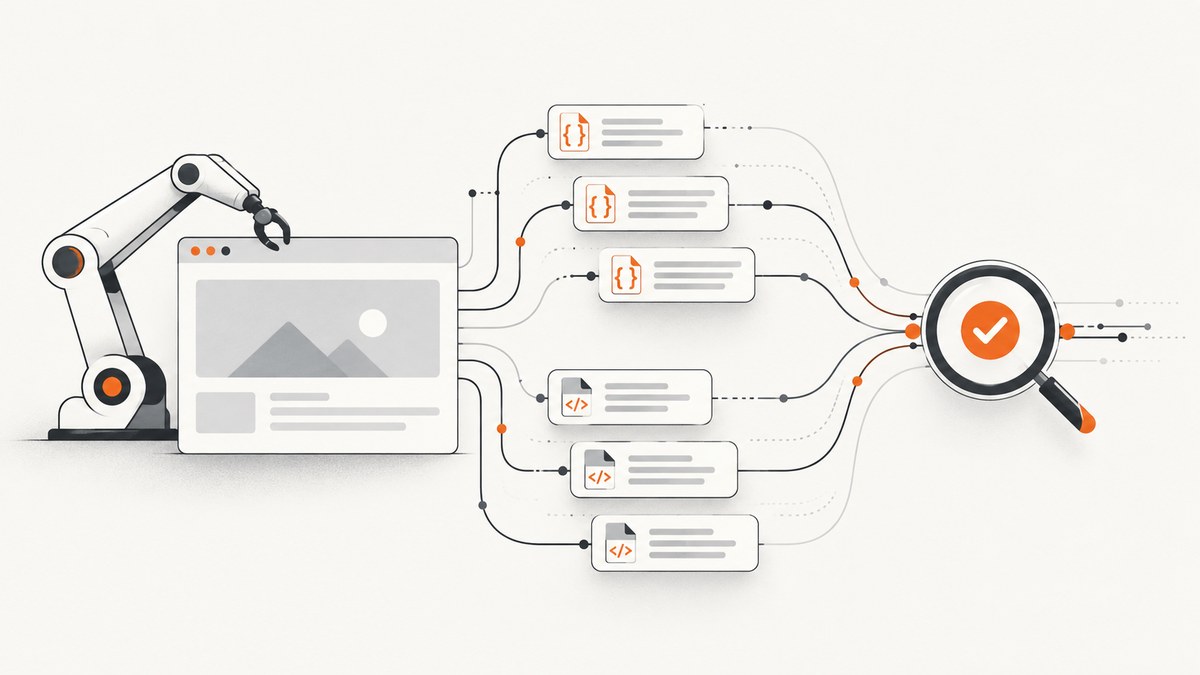
To monitor JavaScript and CSS request status with Selenium Python, enable Chrome DevTools Protocol (CDP) Network instrumentation before navigating, collect the Network events, and correlate them by requestId. Use responseReceived to read HTTP status, loadingFinished to identify completed transfers, and loadingFailed to capture browser-level failures. Filter by CDP resource type Script or Stylesheet; filename suffixes alone miss extensionless and dynamically generated assets.
This guide shows a runnable Selenium 4 pattern using Chrome’s performance log, how to interpret the event stream, how to turn it into a useful report and test assertion, and what to do when collection or classification goes wrong. CDP collection details can vary by Selenium and Chrome version, so the event-reading code is isolated from the reporting logic.
1. What you can and cannot learn from request status
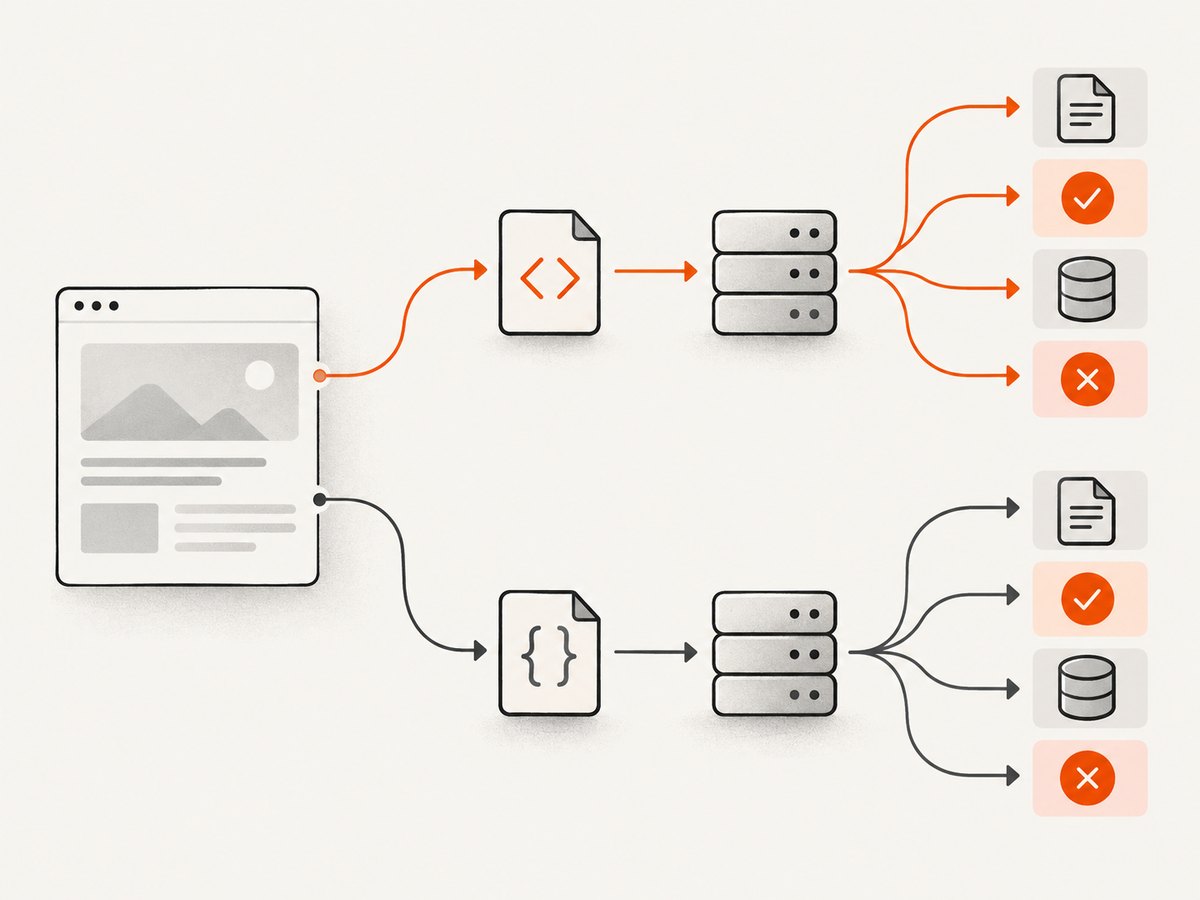
A browser request has more than one useful outcome. An HTTP response with status 404 is different from a connection failure, a request canceled during navigation, and an asset served from cache. Capture these separately rather than reducing every event to a single “loaded” boolean.
| Signal | What it tells you |
|---|---|
responseReceived |
A response arrived. Its response object includes the HTTP status, URL, MIME type, headers, and other metadata. |
loadingFinished |
The browser finished loading the request. Record encoded data length when available. |
loadingFailed |
The browser could not complete the load. The event may include error text, cancellation state, or a blocked reason. |
requestServedFromCache |
The request was served from cache. Preserve that fact in the report. |
requestWillBeSent |
The request began. This is the earliest place to capture URL, initiator, and request metadata. |
These are distinct events, not a guaranteed one-line record. The response and finish events generally refer to the same request using the same CDP requestId. A failed request may never have a response. Requests can also be redirected, producing lifecycle events that need careful handling if you require a full redirect history. See the [CDP Network protocol](https://chromedevtools.github.io/devtools-protocol/tot/Network/) for event definitions and fields.
CDP reports resource types such as Script and Stylesheet. These are better filters than checking whether a URL ends in .js or .css, since URLs may have query strings, omit extensions, or be generated dynamically. MIME type can be a useful secondary clue, but it should not replace the protocol type: servers sometimes return incorrect or generic MIME types.
2. Install Selenium and configure Chrome performance logging
Install Selenium in the Python environment used by your test runner:
python -m pip install seleniumSelenium Manager can manage a compatible ChromeDriver in standard Selenium setups. If your environment pins Chrome and ChromeDriver separately, ensure they are compatible and available to the process. The sample uses local Chrome in headless mode; remove the headless argument if you want to watch the browser.
Performance logging is a compatibility approach for receiving CDP events through Selenium’s browser log interface. Configure it before creating the driver, then enable the Network domain before calling get(). Selenium documents execute_cdp_cmd as its command bridge for CDP commands. See [Selenium WebDriver’s Python API](https://www.selenium.dev/selenium/docs/api/py/webdriver_remote/selenium.webdriver.remote.webdriver.html) and [Chrome DevTools Network instrumentation](https://chromedevtools.github.io/devtools-protocol/tot/Network/).
3. Complete runnable Python example
Save the following as monitor_assets.py and run python monitor_assets.py. It enables Network collection before navigation, drains performance log entries after the page load, filters relevant requests, joins their events by request ID, and prints a JSON report. The script retains HTTP errors, browser failures, cache state, and completed requests rather than hiding useful context.
import json
import time
from collections import defaultdict
from selenium import webdriver
from selenium.webdriver.chrome.options import Options

TARGET = "https://example.com"
NETWORK_EVENTS = {
    "Network.requestWillBeSent",
    "Network.responseReceived",
    "Network.loadingFinished",
    "Network.loadingFailed",
    "Network.requestServedFromCache",
}


def make_driver():
    options = Options()
    options.add_argument("--headless=new")
    options.add_argument("--window-size=1440,1000")
    options.set_capability("goog:loggingPrefs", {"performance": "ALL"})
    driver = webdriver.Chrome(options=options)
    # Set a larger buffer if the page makes many requests.
    driver.execute_cdp_cmd("Network.enable", {
        "maxTotalBufferSize": 10000000,
        "maxResourceBufferSize": 5000000,
    })
    return driver


def read_network_events(driver):
    records = defaultdict(lambda: {
        "request_id": None,
        "url": None,
        "resource_type": None,
        "initiator": None,
        "status": None,
        "mime_type": None,
        "cache": False,
        "finished": False,
        "encoded_data_length": None,
        "error_text": None,
        "canceled": False,
        "blocked_reason": None,
        "elapsed_ms": None,
        "events": [],
    })
    started_at = {}

    for entry in driver.get_log("performance"):
        try:
            message = json.loads(entry["message"])["message"]
        except (KeyError, TypeError, json.JSONDecodeError):
            continue
        method = message.get("method")
        if method not in NETWORK_EVENTS:
            continue
        params = message.get("params", {})
        request_id = params.get("requestId")
        if not request_id:
            continue

        record = records[request_id]
        record["request_id"] = request_id
        record["events"].append(method)

        if method == "Network.requestWillBeSent":
            request = params.get("request", {})
            record["url"] = request.get("url")
            record["initiator"] = params.get("initiator", {}).get("type")
            started_at[request_id] = time.monotonic()
            record["resource_type"] = params.get("type")

        elif method == "Network.responseReceived":
            response = params.get("response", {})
            record["url"] = response.get("url") or record["url"]
            record["status"] = response.get("status")
            record["mime_type"] = response.get("mimeType")
            record["resource_type"] = params.get("type") or record["resource_type"]
            if response.get("fromDiskCache") or response.get("fromServiceWorker"):
                record["cache"] = True

        elif method == "Network.requestServedFromCache":
            record["cache"] = True

        elif method == "Network.loadingFinished":
            record["finished"] = True
            record["encoded_data_length"] = params.get("encodedDataLength")
            if request_id in started_at:
                record["elapsed_ms"] = round(
                    (time.monotonic() - started_at[request_id]) * 1000, 1
                )

        elif method == "Network.loadingFailed":
            record["error_text"] = params.get("errorText")
            record["canceled"] = params.get("canceled", False)
            record["blocked_reason"] = params.get("blockedReason")
            if request_id in started_at:
                record["elapsed_ms"] = round(
                    (time.monotonic() - started_at[request_id]) * 1000, 1
                )

    # The protocol type is authoritative for this filter when available.
    # URL suffix and MIME checks serve as fallbacks for unusual event streams.
    selected = []
    for record in records.values():
        url = (record["url"] or "").split("?", 1)[0].lower()
        mime = (record["mime_type"] or "").lower()
        is_asset = (
            record["resource_type"] in {"Script", "Stylesheet"}
            or url.endswith(".js")
            or url.endswith(".css")
            or "javascript" in mime
            or mime == "text/css"
        )
        if is_asset:
            selected.append(record)
    return selected


driver = make_driver()
try:
    driver.get(TARGET)
    # get() waits for the configured page-load strategy, not necessarily every
    # late script, stylesheet, SPA request, or lazy resource. Give async work a
    # bounded settling interval, then drain the current log.
    time.sleep(2)
    report = read_network_events(driver)
    print(json.dumps(report, indent=2))
finally:
    driver.quit()
The elapsed value above is measured when Python drains the log, so it is an approximate observation interval, not a precise browser transfer duration. For precise timing, use the CDP timestamps in event parameters and account for their clock semantics; the report’s main purpose is to make status and failure diagnosis straightforward.
4. Read the report and decide what fails the test
For an HTTP failure, look for status such as 404 or 500. A non-2xx status is still an HTTP response: it normally appears on responseReceived, and the load may also later emit loadingFinished. Do not classify every completed load as successful without inspecting the status.
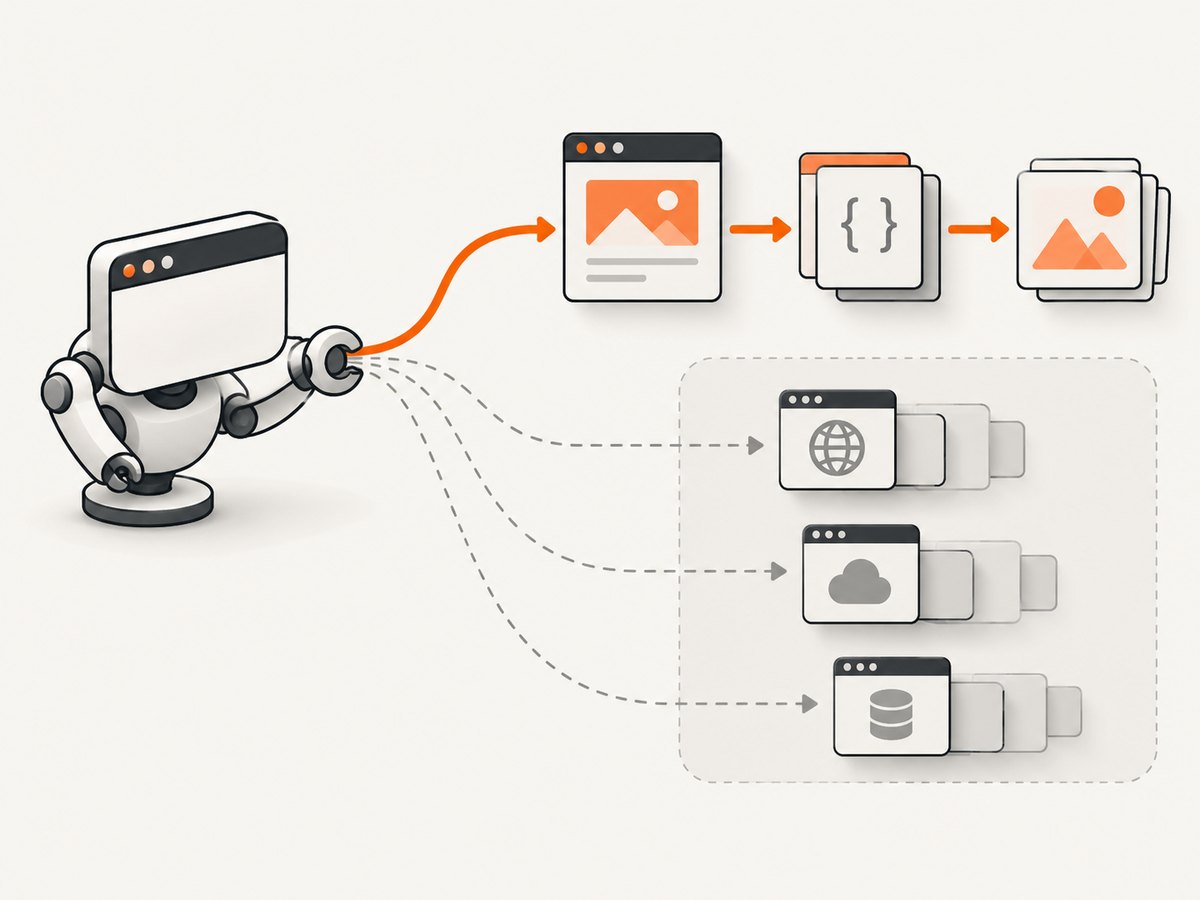
For a browser failure, inspect error_text, canceled, and blocked_reason. A CSP block, network disconnection, DNS failure, or cancellation may have no HTTP status because no usable response was received. Whether a cancellation is a defect depends on the test: navigation can cancel in-flight requests by design.
Use an explicit policy. A practical page-health test often fails only on failed required first-party JavaScript and CSS, while allowing expected 404s for optional resources or third-party analytics. Maintain an allowlist for known optional hosts or URLs, and report excluded requests so the policy remains reviewable. Chrome DevTools’ Network panel exposes the same core concepts—status, type, initiator, size, and time—and can help manually confirm an issue before encoding the assertion. See [Chrome DevTools Network reference](https://developer.chrome.com/docs/devtools/network?authuser=2&hl=en).
from urllib.parse import urlparse

FIRST_PARTY_HOST = "example.com"


def is_required_first_party_failure(record):
    host = urlparse(record.get("url") or "").hostname or ""
    if host != FIRST_PARTY_HOST and not host.endswith("." + FIRST_PARTY_HOST):
        return False
    status = record.get("status")
    http_error = status is not None and status >= 400
    browser_error = bool(record.get("error_text")) and not record.get("canceled")
    return http_error or browser_error


failures = [r for r in report if is_required_first_party_failure(r)]
if failures:
    raise AssertionError(json.dumps(failures, indent=2))
This sample treats all first-party script and stylesheet errors as failures. For a production suite, refine it with required URL patterns and explicit exceptions; a first-party optional widget can fail without making the page unusable.
5. Capture requests after navigation and on single-page apps
driver.get() returns according to Selenium’s page-load strategy. The default waits for a load event, but JavaScript can continue issuing requests afterward. A fixed sleep is simple but can be slow or flaky. Prefer a condition tied to the application when possible, such as waiting for a known page-ready selector, a route transition, or a test-specific state. Then drain the performance log.
For interactions, keep Network instrumentation enabled and read logs after each meaningful action:
driver.find_element("css selector", "button.load-more").click()
# Wait for an application-specific result, then collect newly buffered entries.
new_records = read_network_events(driver)
Performance logs are buffered and draining them consumes the current entries. If the page emits many events, collect at checkpoints so the buffer does not overflow and records remain associated with the action that caused them. A request initiated before a checkpoint may complete after it, so keep a request-ID store across drains if you need to join an entire lifecycle spanning multiple checkpoints.
6. Options and compatibility choices
Resource identification
Prefer protocol resource types Script and Stylesheet. Keep URL extension and MIME fallbacks only for environments where type data is missing. A stylesheet can be served from a URL without “.css”; an endpoint ending in “.js” may return a redirect or HTML error page. Preserve the observed type, MIME type, and final URL to diagnose these cases.
Performance log versus session APIs
The example uses Chrome performance logging because it can be read through driver.get_log("performance") after configuring the capability. The exact event-capture API varies with Selenium and browser versions. Selenium also documents a Python CDP connection/session module, which offers a session-oriented path. Keep event parsing behind a small adapter so the reporting and assertion code can be reused if collection changes.
Selenium’s documentation says its direct CDP methods are expected to be removed as WebDriver BiDi is implemented. Treat CDP as a Chrome-specific implementation choice and plan a migration boundary if your test suite must span browsers. See [Selenium’s CDP Network feature documentation](https://www.selenium.dev/documentation/webdriver/bidi/cdp/network/) and [Python CDP module API](https://www.selenium.dev/selenium/docs/api/py/selenium_webdriver_common_bidi/selenium.webdriver.common.bidi.cdp.html).
Network buffer sizing
Network.enable accepts buffer options such as maxTotalBufferSize and maxResourceBufferSize. Larger buffers can help on pages with many or large resources but use more browser memory. Start with defaults, raise limits only when evidence shows events or bodies are being dropped, and collect logs regularly on chatty applications. These buffers do not replace draining Selenium’s performance log.
Cache and service workers
Preserve cache metadata rather than assuming cache means success or failure. CDP response metadata can indicate disk cache or service-worker delivery; a separate cache event may also be present. If the test specifically measures a cold network load, decide deliberately whether to clear browser cache or use a fresh browser profile. That changes the scenario being tested, so do not clear cache in a test intended to represent a returning user.
7. Troubleshooting
| Symptom | Likely cause | Fix |
|---|---|---|
get_log("performance") is empty |
Performance logging capability was not enabled, or Network was enabled after navigation. | Set goog:loggingPrefs before driver creation; call Network.enable before get(). |
| JavaScript or CSS is missing from the report | Filtering only by extension, or the event’s resource type was not retained. | Prefer CDP type Script/Stylesheet; retain MIME and URL fallbacks and inspect raw events. |
| HTTP 404 does not appear as a browser failure | A 404 is an HTTP response, not necessarily a failed network transfer. | Check responseReceived.response.status for status codes; use loadingFailed for transport or browser errors. |
| Requests after a click are absent | The log was read before the interaction, the buffer overflowed, or the code only captured initial page load. | Keep Network enabled, perform the action, wait for its result, and drain logs at checkpoints. |
| Some failures have no URL or status | The request may have been blocked or canceled before a response, or its initiating event was missed. | Retain records by request ID, capture from before navigation, and inspect error and blocked-reason fields. |
| Events appear duplicated or redirected URLs confuse the report | Redirects and repeated requests can share lifecycle context; grouping only by URL loses distinctions. | Group by request ID and retain event order and URL changes. Include redirect response data if redirect auditing matters. |
| Collection behaves differently after an upgrade | CDP support and Selenium’s logging/session APIs can vary by version. | Pin versions for stable CI, isolate the event adapter, and consult Selenium’s current API documentation before changing collection. |
| Test fails on analytics or widget errors | The assertion policy treats every external request as required. | Scope failures to required first-party assets and maintain a documented allowlist for optional dependencies. |
8. Performance, reliability, and cost
Network event collection adds data handling and log parsing, but it does not require a separate request per asset. The largest practical costs usually come from browser startup, the page’s own network activity, and retaining excessive event detail. Keep the report to fields your test uses, drain logs at deliberate checkpoints, and set bounded waits rather than sleeping for a long time on every page.
For repeatable CI results, pin browser and Selenium versions where your environment allows, run with a predictable viewport and network environment, and separate deterministic first-party dependencies from third-party services. A third-party outage should not silently look like an application regression if that dependency is intentionally optional. Conversely, do not allowlist a required script merely to quiet a flaky test.
CDP instrumentation itself does not incur a hosted API charge. Compute and infrastructure costs are those of the machines running your Selenium browsers. For large suites, account for parallel browser memory and startup capacity; increasing Network buffers also increases potential memory use.
9. When this method is the right fit
Use Selenium plus CDP when the question is whether a browser session loaded a particular script or stylesheet while exercising the page. It gives you request lifecycle detail in the context of navigation, clicks, and client-side routing. It is especially useful for regression checks where a missing asset breaks rendered behavior.
If you only need a static screenshot and do not need to inspect the browser request stream, a managed capture endpoint can avoid maintaining a browser and driver. ScreenshotNeo is a website screenshot API and MCP server from [ScreenshotNeo](https://screenshotneo.com). Its screenshot API returns an image or PDF; it is not a replacement for Selenium’s per-request status report.
Or skip the browser setup
For a screenshot without installing ChromeDriver, make one GET request. See the [ScreenshotNeo API documentation](https://screenshotneo.com/docs/) for the available capture options.
curl -G "https://api.screenshotneo.com/v1/shot" -d access_key=YOUR_API_KEY --data-urlencode url=https://stripe.com -o shot.webpimport requests
r = requests.get("https://api.screenshotneo.com/v1/shot", params={"access_key": "YOUR_API_KEY", "url": "https://stripe.com"}, timeout=90)
open("shot.webp", "wb").write(r.content)const q = new URLSearchParams({ access_key: 'YOUR_API_KEY', url: 'https://stripe.com' });
const res = await fetch(`https://api.screenshotneo.com/v1/shot?${q}`);ScreenshotNeo accepts cookie and consent banners and removes more than 60 known consent platforms, newsletter popups, and chat widgets before capture; each step can be turned off. Bot checks, blank pages, failed loads, timeouts, and cache hits are not billed, and response headers identify the page verdict and billing status. Its MCP server lets AI agents use take_screenshot, get_page_info, and capture_pdf. The free plan includes 1,000 screenshots a month with no card; paid plans start at $5 for 3,000 screenshots, and every feature is on every plan.
Sign up for 1,000 free screenshots a month with no card.
10. FAQ
Can Selenium tell me which JavaScript URL returned 404?
Yes. Match the request’s responseReceived event by requestId, retain its URL, and inspect response.status. A 404 may still be followed by loadingFinished.
Does a successful HTTP status prove the script executed?
No. Network status says what happened during retrieval. It does not prove the browser parsed or executed the code successfully. Add browser-console checks or application behavior assertions when execution matters.
Can I use this with Firefox?
This implementation uses Chrome DevTools Protocol and Chrome’s performance log. It is Chrome-specific. Selenium’s WebDriver BiDi direction is the cross-browser migration path to evaluate as browser support develops.
Why does my CSS request have status 200 but the page still look unstyled?
The stylesheet may contain invalid rules, be overridden, fail to apply due to policy or media conditions, or return content with an unexpected MIME type. Check the response body and browser console in addition to request status.


