How to Monitor Linux Servers with Prometheus and Grafana
Set up Node Exporter, Prometheus, and Grafana to collect Linux metrics, build dashboards, troubleshoot gaps, and configure reliable alerts.

Direct answer: run Node Exporter on every Linux host, configure Prometheus to scrape each host’s /metrics endpoint (normally port 9100), then add Prometheus as Grafana’s data source. Verify the target is healthy before importing dashboards. This gives you a practical monitoring path for CPU, memory, disks, filesystems, network traffic, and many kernel metrics.
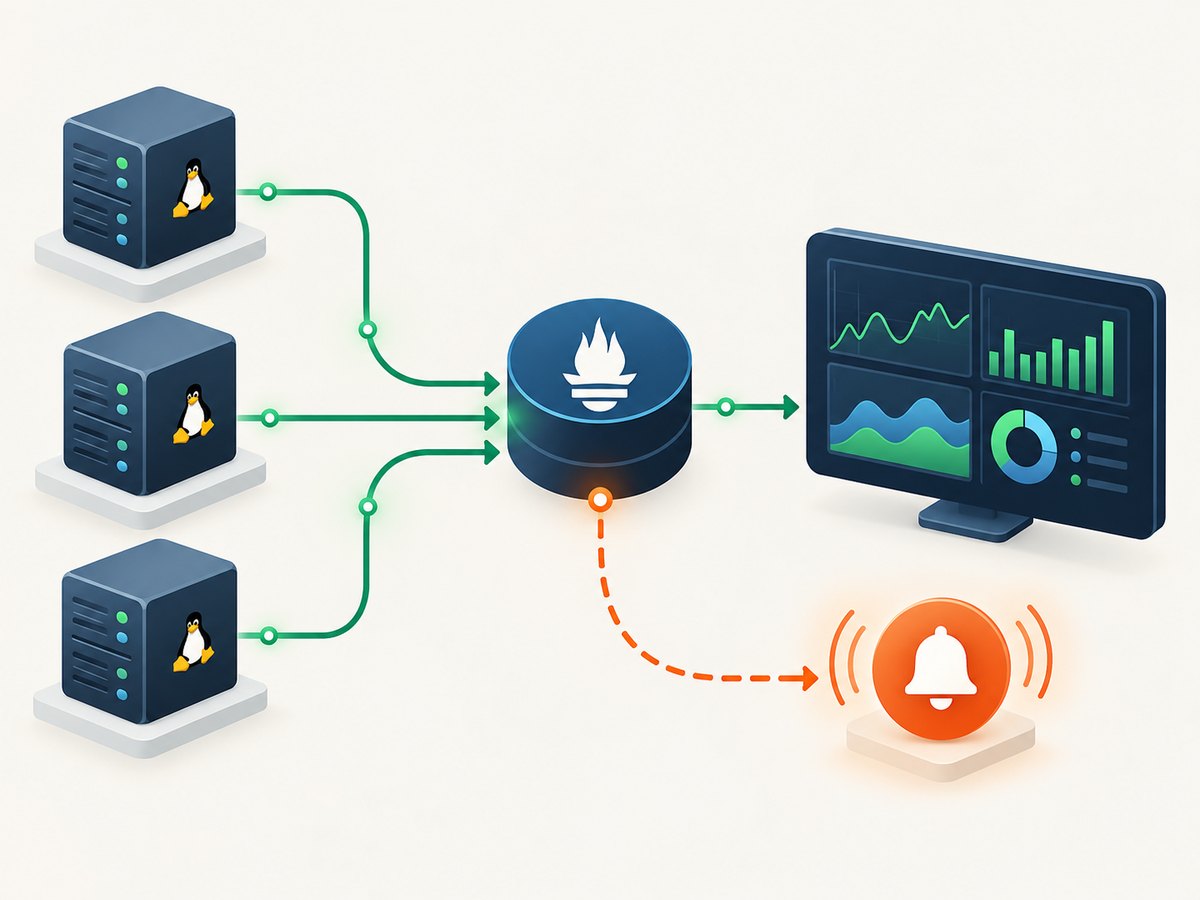
The architecture is simple:
- Node Exporter runs on the Linux server and exposes host metrics over HTTP.
- Prometheus periodically scrapes that endpoint and stores time-series samples.
- Grafana queries Prometheus and turns those samples into dashboards, panels, and alerts.
Prometheus describes Node Exporter as exposing “a wide variety of hardware- and kernel-related metrics.” The official guide uses a 15-second scrape interval as an example; treat that as a starting point, not a universal production setting. See the Prometheus Node Exporter guide for the current installation instructions.
1. Choose an installation layout
For one server, you can install all three components directly on Linux. For a small lab or homelab, Docker Compose keeps the services reproducible. For a fleet, run Node Exporter on each host and centralize Prometheus and Grafana on a monitoring node. A managed destination such as Grafana Cloud is another option when you do not want to operate long-term metrics storage; Grafana documents a Docker Compose setup that forwards metrics to its hosted service.

| Layout | Advantages | Responsibility |
|---|---|---|
| All services on one Linux host | Few moving parts and simple localhost URLs | You maintain binaries, storage, upgrades, and access control |
| Docker Compose | Repeatable configuration and easy local testing | You must configure host namespaces, mounts, networks, and persistent volumes |
| Central Prometheus plus exporters on many hosts | One query endpoint for the fleet | Routing, firewall rules, target discovery, and retention planning |
| Hosted Grafana and metrics storage | Less storage and dashboard administration | Configure authentication, remote write, and network egress |
2. Install Node Exporter on a Linux host
Node Exporter is distributed as a static binary for multiple operating systems and architectures. Use the current release shown on the Prometheus downloads page rather than copying an old version number into automation.
Binary installation
After downloading the Linux archive for your architecture, unpack it, place the binary in a system path, and run it as a dedicated unprivileged account. A systemd unit makes restarts and boot startup predictable:
[Unit]
Description=Prometheus Node Exporter
After=network-online.target

[Service]
User=node_exporter
Group=node_exporter
ExecStart=/usr/local/bin/node_exporter
Restart=on-failure

[Install]
WantedBy=multi-user.target
Save this as /etc/systemd/system/node_exporter.service, create the node_exporter user, reload systemd, enable the service, and start it. The exact archive and service-management commands vary by distribution, so keep the binary download step tied to the current upstream release.
Verify the exporter before configuring Prometheus
curl http://localhost:9100/metrics
curl -s http://localhost:9100/metrics | grep '^node_' | head
You should receive plain-text metric samples whose names commonly begin with node_. If the connection is refused, check that the process is running and listening on port 9100. If a remote Prometheus will scrape this host, bind and firewall the port deliberately; do not expose it publicly without access controls.
3. Configure Prometheus to scrape Linux hosts
Create a Prometheus configuration with a global scrape interval and a target for each exporter. The official single-host example is:
global:
  scrape_interval: 15s

scrape_configs:
  - job_name: node
    static_configs:
      - targets: ['localhost:9100']
When Prometheus runs on another machine, replace localhost:9100 with the exporter host’s reachable DNS name or address. For several servers, add targets under static_configs:
scrape_configs:
  - job_name: linux-nodes
    static_configs:
      - targets:
          - server-a.example.net:9100
          - server-b.example.net:9100
        labels:
          environment: production
Static configuration is adequate for a small fleet. Larger environments can use service discovery appropriate to their platform, but the important rule remains the same: the address must be reachable from the Prometheus process, and each target must expose a compatible metrics endpoint.
Run Prometheus with Docker Compose
services:
  prometheus:
    image: prom/prometheus:latest
    ports:
      - "9090:9090"
    volumes:
      - ./prometheus.yml:/etc/prometheus/prometheus.yml:ro
      - prometheus-data:/prometheus
    command:
      - --config.file=/etc/prometheus/prometheus.yml
      - --storage.tsdb.path=/prometheus

volumes:
  prometheus-data:
Prometheus recommends a named Docker volume for production data because it simplifies data management during upgrades. Pin an image version in a controlled environment, back up configuration, and plan retention so the database does not consume the host disk.
Validate scraping
Open Prometheus at http://prometheus-host:9090, choose Status → Targets, and confirm the Node Exporter target is UP. You can also query:
up{job="node"}
node_uname_info
node_filesystem_avail_bytes
An up value of 1 means the last scrape succeeded; 0 means Prometheus could not scrape the endpoint. Resolve this before working on Grafana.
4. Connect Grafana to Prometheus
Grafana includes a built-in Prometheus data source. In Grafana, open Connections → Data sources → Add data source → Prometheus, enter the Prometheus server URL, and select Save & test. In a non-container installation on the same machine, that URL may be http://localhost:9090.
Container networking causes a common mistake: localhost inside the Grafana container means the Grafana container itself, not the Prometheus container. With Compose, use the service name, such as http://prometheus:9090, when both services share a network. Grafana documents TLS and certificate settings for deployments that need protected communication; use them when Prometheus is reached across a network you do not fully trust.
Explore a metric before importing a dashboard
Use Explore and run a simple query:
rate(node_cpu_seconds_total{mode="system"}[1m])This returns the average rate of CPU time spent in system mode over the preceding minute. Other useful starter queries from the Node Exporter guide include:
node_filesystem_avail_bytes
rate(node_network_receive_bytes_total[1m])
The first is available filesystem space in bytes; the second is average received network traffic over one minute. These are query examples, not universal alert thresholds. Interpret them with labels such as instance, device, and mountpoint.
5. Build useful Linux dashboards
You can create panels from PromQL or import Grafana’s Node Exporter Full dashboard, ID 1860, as shown in Grafana’s Linux-host tutorial. Imported panels are not guaranteed to work unchanged: Grafana notes that some panels require metrics or collectors that are not enabled in every Node Exporter configuration.
Whether you import or build your own, check these dimensions:
- CPU: display utilization by host and, when useful, by mode. Avoid treating a single short spike as an incident.
- Memory: show available memory and swap activity together. A low free-memory number alone can be misleading because Linux uses available page cache.
- Filesystems: group by mountpoint and exclude pseudo-filesystems that are not capacity concerns. Alert on sustained low available bytes or percentage.
- Disk I/O: inspect throughput, operations, and saturation alongside application latency.
- Network: graph receive and transmit rates per interface and distinguish physical interfaces from virtual bridges.
- System health: include load, uptime, and exporter scrape status so a blank panel is not mistaken for a healthy host.
6. Add alerting deliberately
Prometheus’s FAQ points to Alertmanager for sending alerts through email, integrations, and webhooks. A complete alerting design has three parts: an expression that detects a condition, a duration that prevents one-sample noise, and a notification route.
For example, an alert rule can detect a failed scrape:
groups:
  - name: node-exporter
    rules:
      - alert: NodeExporterDown
        expr: up{job="node"} == 0
        for: 5m
        labels:
          severity: critical
        annotations:
          summary: "Node Exporter is unreachable"
          description: "Prometheus cannot scrape {{ $labels.instance }} for five minutes."
Load the rule file through Prometheus’s rule configuration and validate it with Prometheus’s rule page. Configure Alertmanager separately, then send a test notification. Grafana can display Prometheus rules as data-source-managed rules; that is different from Grafana-managed alerting. Decide which system owns each rule to avoid duplicate notifications and confusing edits.
7. Docker-specific host monitoring details
Running Node Exporter in a container can accidentally monitor the container rather than the host. The Node Exporter project documents the need for host namespaces and bind mounts for host filesystems. A Compose deployment therefore needs deliberate settings for the host PID namespace, root filesystem path, and read-only mounts. Review the current Node Exporter README for the exact flags and mount layout for your runtime.
Keep Prometheus data on a named or bind-mounted volume, keep configuration read-only inside the container, and place Prometheus and Grafana on a private network. Expose port 9090 or 3000 through a reverse proxy or access-controlled network rather than directly to the public internet.
8. Performance, reliability, and cost considerations
Scrape frequency and cardinality
A shorter scrape interval gives fresher graphs but creates more samples and network traffic. Start with the documented 15-second example, then measure query latency and storage growth. Avoid adding high-cardinality labels such as request IDs or unrestricted filenames. Keep labels stable so dashboards remain queryable.
Storage and retention
Prometheus stores time series locally by default. Set retention based on disk capacity and the history your operators actually use. Monitor Prometheus’s own disk usage and protect the data directory from accidental deletion. If you need long-term retention or multiple regional Prometheus servers, evaluate a hosted or remote-storage design; Grafana’s Docker Compose guide documents sending metrics to Grafana Cloud, but hosted pricing and availability should be checked separately.
Reliability checks
- Alert when
upis zero for a sustained period. - Monitor Prometheus and Grafana process health independently of the dashboards they serve.
- Keep exporter, Prometheus, and Grafana configuration in version control.
- Test a restore of Prometheus configuration and any required dashboard provisioning.
- Use network policies or firewalls so only Prometheus can reach exporter ports.
9. Troubleshooting checklist
| Symptom | Likely cause | Fix |
|---|---|---|
| Exporter connection refused | Service stopped, wrong port, or local firewall | Check the process, listen address, systemd logs, and port 9100. |
| Target is DOWN in Prometheus | Prometheus cannot resolve or reach the target | Test the URL from the Prometheus host or container; replace localhost with a reachable hostname. |
| Grafana data-source test fails | Container-local localhost or incorrect port | Use the Prometheus service name and port 9090 on the shared network. |
| Dashboard panels show “No data” | Missing collectors, label mismatch, or wrong time range | Run the panel query in Explore, inspect emitted metrics, and adapt the panel or enable the required collector. |
| Filesystem values look wrong | Pseudo-filesystems or duplicate mounts included | Filter by filesystem type and mountpoint appropriate to your hosts. |
| Prometheus disk fills | Retention too long or excessive cardinality | Reduce retention, remove unnecessary labels, and add disk-usage monitoring. |
| Alerts never arrive | Rule not loaded, Alertmanager route missing, or notification failure | Check the rules page, Alertmanager status, route matchers, and send a deliberate test notification. |
Or skip the browser setup
If your monitoring workflow also needs screenshots of status pages, dashboards, or incident views, ScreenshotNeo provides a website screenshot API and MCP server. One GET request returns a PNG, JPEG, WebP, or PDF. The DIY browser setup is unnecessary:
curl -G "https://api.screenshotneo.com/v1/shot" -d access_key=YOUR_API_KEY --data-urlencode url=https://grafana.example.com/d/node-overview -o dashboard.webpimport requests
r = requests.get("https://api.screenshotneo.com/v1/shot", params={"access_key": "YOUR_API_KEY", "url": "https://grafana.example.com/d/node-overview"}, timeout=90)
open("dashboard.webp", "wb").write(r.content)const q = new URLSearchParams({ access_key: 'YOUR_API_KEY', url: 'https://grafana.example.com/d/node-overview' });
const res = await fetch(`https://api.screenshotneo.com/v1/shot?${q}`);
See the ScreenshotNeo API documentation for authentication and options. Cookie banners, newsletter popups, and chat widgets are removed before the shot. Bot checks, blank pages, failed loads, timeouts, and cache hits are not billed, and response headers identify the page verdict and billing result. You can wait for a selector, network idle, or a delay; set a viewport or device preset; capture a CSS element or a full page; apply custom CSS or JavaScript; provide headers, cookies, user agents, authorization, timezone, and geolocation; block requests; resize images; cache with your chosen TTL; create signed links; run asynchronous jobs with signed webhooks; capture up to 100 URLs per bulk call; and use the MCP server’s take_screenshot, get_page_info, and capture_pdf tools from Claude, Cursor, or another MCP client.
ScreenshotNeo includes 1,000 screenshots per month free with no card. Paid plans start at $5 for 3,000 screenshots, and every feature is available on every plan. Create a free ScreenshotNeo account.
10. FAQ
Can Node Exporter monitor Windows servers?
Node Exporter is intended for Linux and other Unix-like hosts. Use an exporter designed for the operating system you need to monitor.
Do I need Grafana to use Prometheus?
No. Prometheus has a basic expression browser. Grafana is the practical choice for production dashboards and richer visualization.
Why is my CPU graph above 100 percent?
Per-core and aggregate CPU queries have different meanings. Decide whether you want utilization per core or normalized utilization across all cores, then aggregate and scale the PromQL expression accordingly.
Should every server expose port 9100 to the internet?
No. Restrict access to the Prometheus host or monitoring network with firewall rules, private routing, or an authenticated proxy.
Can I use an imported dashboard without changing it?
Sometimes, but verify its queries and required collectors first. Grafana warns that some Node Exporter Full panels do not work when the exporter is configured without the metrics they expect.


