How to Monitor Puppeteer Performance and Errors
Capture browser errors, failed requests, HTTP statuses, timings, metrics, and traces to diagnose Puppeteer runs with actionable monitoring.

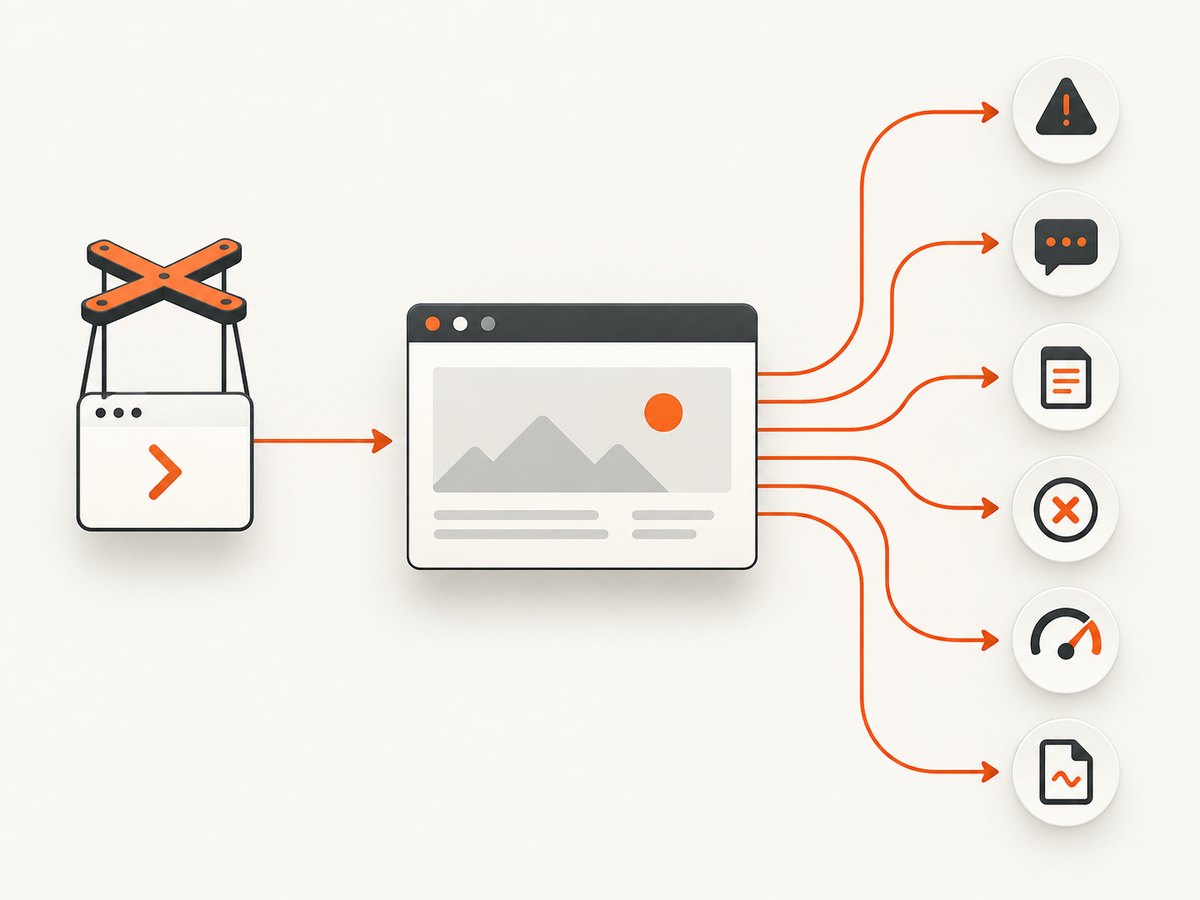
Use several signals together. A reliable Puppeteer monitor records Node-side elapsed time and outcome, browser JavaScript errors, console messages, HTTP response statuses, failed network requests, and periodic page metrics. Add listeners before navigation or the action under test, classify failures separately, and capture a trace when aggregate timings show a regression that metrics cannot explain.
Puppeteer exposes page events such as pageerror, console, requestfailed, requestfinished, response, and metrics. Its page.metrics() method reports cumulative browser measurements, while your Node application must measure the end-to-end operation itself. These signals answer different questions and should not be collapsed into one score.
1. Decide what a monitored run means
Start by defining the scenario and its success condition. “Checkout smoke test,” “capture product page,” and “export invoice PDF” need different checkpoints and acceptable timings. Give every run a unique identifier and record:
- Scenario name and target URL (redacted if it contains secrets).
- Puppeteer, Node, and browser versions.
- Run start and end times, elapsed milliseconds, and final outcome.
- Whether the browser was cold or reused, and the viewport, device, locale, and network settings.
- Errors grouped as harness exceptions, page errors, console errors, HTTP errors, request failures, browser disconnects, or performance regressions.
Keep the run record in your normal logs or metrics backend. Puppeteer provides the events and measurements; it does not provide a complete monitoring service.
2. Attach listeners before navigation
Listeners registered after page.goto() can miss the very errors you need. The following Node.js script creates structured records, measures the complete journey, samples metrics at checkpoints, and saves a trace on demand.
import puppeteer from 'puppeteer';
import crypto from 'node:crypto';

const runId = crypto.randomUUID();
const target = process.env.TARGET_URL || 'https://example.com';
const started = performance.now();
const events = [];
const record = (type, data = {}) => {
  events.push({ runId, type, at: new Date().toISOString(), ...data });
};

const browser = await puppeteer.launch({headless: true});
const page = await browser.newPage();

// Register before any navigation or action.
page.on('pageerror', error => {
  record('pageerror', {message: error.message, stack: error.stack});
});
page.on('console', message => {
  record('console', {
    level: message.type(),
    text: message.text(),
    location: message.location()
  });
});
page.on('requestfailed', request => {
  record('requestfailed', {
    url: request.url(),
    method: request.method(),
    resourceType: request.resourceType(),
    errorText: request.failure()?.errorText ?? null
  });
});
page.on('requestfinished', request => {
  record('requestfinished', {
    url: request.url(), method: request.method(),
    resourceType: request.resourceType()
  });
});
page.on('response', response => {
  record('response', {
    url: response.url(),
    status: response.status(),
    statusText: response.statusText(),
    resourceType: response.request().resourceType()
  });
});
page.on('metrics', metrics => {
  record('metrics-event', metrics.metrics);
});

const sampleMetrics = async checkpoint => {
  const metrics = await page.metrics();
  record('metrics-sample', {checkpoint, metrics});
  return metrics;
};

let outcome = 'ok';
try {
  await page.goto(target, {waitUntil: 'networkidle2', timeout: 45_000});
  await sampleMetrics('after-navigation');
  // Replace this with the action your scenario actually tests.
  await page.waitForSelector('body', {timeout: 10_000});
  await sampleMetrics('after-checkpoint');
} catch (error) {
  outcome = 'failed';
  record('harness-error', {
    name: error.name, message: error.message, stack: error.stack
  });
} finally {
  const elapsedMs = performance.now() - started;
  record('run-complete', {outcome, elapsedMs});
  console.log(JSON.stringify({runId, outcome, elapsedMs, events}, null, 2));
  await browser.close();
}
The response listener sees HTTP status codes. A 404 or 503 may still proceed to requestfinished; it is an unsuccessful response, not necessarily a transport failure. A request that breaks before a normal response lifecycle emits requestfailed. Store both fields independently. request.failure() can return no detail, so treat errorText as optional.
3. Measure the right performance values
Call await page.metrics() at consistent checkpoints. The Metrics API reports values such as:
| Metric | Unit | Use |
|---|---|---|
ScriptDuration |
Seconds | Trend JavaScript execution work. |
TaskDuration |
Seconds | Trend total main-thread task time. |
LayoutDuration |
Seconds | Find increasing layout work. |
RecalcStyleDuration |
Seconds | Find expensive style recalculation. |
JSHeapUsedSize, JSHeapTotalSize |
Bytes | Spot heap growth or memory pressure. |
Nodes, event listener counters |
Counts | Detect DOM or listener accumulation. |
Timestamp |
Monotonic time | Order samples; do not treat as wall-clock time. |
These values are cumulative browser measurements (or point-in-time counters), not the duration of one user-visible operation. Compute operation latency with performance.now() around the Node-side navigation or action. Compare the same scenario, browser version, viewport, and warm/cold condition; otherwise a performance alert may describe environmental change rather than a regression.
Useful checkpoints
- Immediately after page creation, to establish a baseline.
- After navigation settles, such as
networkidle2or an application-specific selector. - After the key interaction, for example form submission or PDF preparation.
- Before closing the page, to detect growth during a long workflow.
Store deltas between samples for trend analysis, but retain the raw checkpoint and environment labels. Avoid logging every console message as a high-cardinality metric; keep structured logs and aggregate counts by level, URL origin, and error class.
4. Trace a regression you cannot explain
When elapsed time or metrics regress without identifying the cause, record a Chrome trace. Puppeteer can write a trace for inspection in Chrome DevTools or a timeline viewer. Only one trace can be active per browser, so start and stop it around the scenario you want to diagnose.
await page.tracing.start({
  path: `trace-${runId}.json`,
  screenshots: false
});
try {
  await page.goto(target, {waitUntil: 'networkidle2'});
  await page.click('#checkout');
  await page.waitForSelector('#confirmation');
} finally {
  await page.tracing.stop();
}
Trace files can contain URLs, timing data, and page activity. Retain them deliberately, restrict access, and apply your project’s data-retention rules. A trace is a diagnostic artifact, not a replacement for summarized metrics or run outcomes.
5. Classify failures so alerts are actionable
| Category | Typical signal | First response |
|---|---|---|
| Harness exception or timeout | Thrown Node error, navigation timeout | Check selector readiness, timeout budget, and browser logs. |
| Page JavaScript error | pageerror |
Group by message and source location; fix the application exception. |
| Console diagnostic | console event |
Classify error, warning, and info; suppress known noise. |
| HTTP error | response.status() >= 400 |
Record status, URL origin, and request type; a response may still finish. |
| Transport failure | requestfailed |
Inspect optional failure().errorText, resource type, and network conditions. |
| Browser/protocol failure | Disconnected target or pending protocol calls | Capture protocol logs, restart the browser, and check resource limits. |
| Performance regression | Higher Node elapsed time or metric deltas | Compare matched runs, then capture a trace. |
Forwarding browser output and enabling protocol logging can help when page listeners are insufficient. The official Puppeteer debugging guide documents protocol logging, pending-protocol inspection, and browser-output forwarding: Puppeteer debugging guide.
6. Troubleshooting common monitoring problems
No errors appear in the log
Cause: listeners were attached after navigation, or the page emitted a signal before your code subscribed. Fix: create listeners immediately after newPage(), before goto(), clicks, or form actions. Also verify that your logger flushes before the process exits.
A 503 is reported as a successful run
Cause: goto() can resolve when the server returns an HTTP response, even if its status is unsuccessful. Fix: inspect the main document response and fail the scenario explicitly:
const response = await page.goto(target, {waitUntil: 'domcontentloaded'});
if (!response || response.status() >= 400) {
  throw new Error(`HTTP status ${response?.status() ?? 'none'}`);
}
A failed request has no error text
Cause: Puppeteer does not guarantee a populated failure detail. Fix: record a nullable value and use URL, method, resource type, timing, and surrounding console messages for diagnosis.
Metrics look high on every run
Cause: metrics are cumulative and include earlier page work. Fix: sample at the same checkpoints, compare deltas, and label cold versus warm browser runs. Do not call TaskDuration the latency of a click unless you measured that click separately.
The monitor itself slows the scenario
Cause: excessive logging, repeated full metric serialization, screenshots, or tracing on every run. Fix: sample metrics at stable checkpoints, aggregate noisy console output, and enable traces only for failures or a controlled diagnostic percentage. Keep the monitored and unmonitored modes documented.
The browser disconnects or hangs
Cause: browser crashes, exhausted memory, protocol congestion, or orphaned pages. Fix: close pages in finally, cap concurrent tabs, record browser and protocol errors, inspect pending protocol operations, and restart a corrupted browser process. Preserve the run ID across retries so retries do not hide the original failure.
7. Reliability, performance, and cost practices
- Use bounded timeouts. Set navigation, selector, and action timeouts separately so one stalled resource does not consume the whole worker.
- Control concurrency. More tabs increase CPU, memory, and network contention. Alert on queue time as well as page time.
- Retry selectively. Retry transient transport or browser failures with a limit and backoff. Do not blindly retry deterministic selector errors or HTTP 4xx responses.
- Separate evidence from aggregates. Keep counts and latency histograms for dashboards; retain representative structured events and traces for investigation.
- Redact sensitive data. URLs, headers, console text, and traces can contain tokens or personal information. Remove authorization values before persistence.
- Budget observability overhead. Listener registration is cheap, while verbose logs and traces can be expensive. Measure worker CPU, memory, storage, and network impact in your own environment.
- Compare like with like. Pin browser/Puppeteer versions for a test period and annotate upgrades, viewport changes, locale changes, and third-party dependency changes.
Puppeteer controls Chrome or Firefox through the DevTools Protocol or WebDriver BiDi; exact APIs can vary by installed version. Check the documentation for your version before depending on a newer signature. The references used here cover versions 25.9.0 through 25.12.0.
8. Or skip the browser setup
If your goal is a dependable screenshot rather than browser instrumentation, ScreenshotNeo provides a website screenshot API. It accepts one GET request and returns PNG, JPEG, WebP, or PDF. Before capture it accepts cookie and consent banners like a visitor, then removes more than 60 known consent platforms, newsletter popups, and chat widgets. Each step can be disabled.

Only clean shots are billed. Bot checks or CAPTCHAs, blank pages, timeouts, failed loads, and cache hits cost nothing, and the response identifies the result with X-Page-Verdict and X-Billed headers.
See the ScreenshotNeo API documentation for all options. A minimal request is:
curl -G "https://api.screenshotneo.com/v1/shot" \
  -d access_key=YOUR_API_KEY \
  --data-urlencode url=https://stripe.com \
  -o shot.webp
import requests
r = requests.get(
"https://api.screenshotneo.com/v1/shot",
params={"access_key": "YOUR_API_KEY", "url": "https://stripe.com"},
timeout=90,
)
r.raise_for_status()
open("shot.webp", "wb").write(r.content)
const q = new URLSearchParams({
  access_key: 'YOUR_API_KEY',
  url: 'https://stripe.com'
});
const res = await fetch(`https://api.screenshotneo.com/v1/shot?${q}`);
if (!res.ok) throw new Error(`HTTP ${res.status}`);
const image = Buffer.from(await res.arrayBuffer());
await import('node:fs/promises').then(fs => fs.writeFile('shot.webp', image));
Options cover full-page captures with lazy images loaded, CSS-element capture, dark mode, 12 device presets or custom viewports, retina scale, PDF paper size/margins/landscape/page ranges, HTML/CSS rendering, custom CSS and JavaScript, pre-capture clicks, hide selectors, selector/delay/network-idle waits, ad/tracker/request/resource blocking, custom headers/cookies/user agent/Authorization, timezone and geolocation, transparent backgrounds, resizing, configurable-TTL caching, signed links, asynchronous jobs with signed webhooks, bulk capture of up to 100 URLs per call, a usage API, and an OpenAPI specification. Familiar parameter names from other screenshot APIs also work.
An MCP server supplies take_screenshot, get_page_info, and capture_pdf tools for Claude, Cursor, and other MCP clients. The Free plan includes 1,000 shots per month with no card; paid plans start at $5 for 3,000 shots. Other plans are Growth ($15/15,000), Pro ($39/60,000), Scale ($99/250,000), and Business ($249/1,000,000); yearly billing gives two months free, and every feature is on every plan. Create a free ScreenshotNeo account.
9. A practical monitoring checklist
- Assign a run ID and record versions, environment, scenario, and outcome.
- Attach
pageerror,console,requestfailed,requestfinished, andresponselisteners before navigation. - Measure Node-side elapsed time separately from browser metrics.
- Sample
page.metrics()at repeatable checkpoints and compare matched runs. - Store HTTP status separately from request failure details.
- Redact secrets and classify noisy console output.
- Capture a trace when a reproducible regression remains unexplained.
- Use bounded retries and close every page and browser in cleanup code.
- Alert by failure category so the owner can act on the notification.
FAQ
Should I use page.metrics() to measure page-load time?
No. Use a Node-side timer for end-to-end load or action time. Metrics are cumulative browser measurements that help explain trends.
Does a 404 trigger requestfailed?
Usually no. A 404 is an HTTP response and can reach requestfinished. Check the response status separately.
Can I trace multiple pages at once?
Tracing is browser-scoped and only one trace can be active per browser. Scope the trace to the scenario you are diagnosing.
How much console output should I retain?
Keep structured error and warning records, sample or aggregate repetitive messages, and redact page data before storage.
When is an external screenshot API useful?
Use one when you need repeatable captures without maintaining browser binaries, consent handling, popup removal, retries, and capture infrastructure. ScreenshotNeo combines those capture controls with verdict and billing headers and an MCP server for AI agents.


