10 Online Traceroute Tools for Troubleshooting Network Issues
Compare online traceroute tools by probe location, measurement type, and path history. Learn how to read missing hops and choose the right next check.

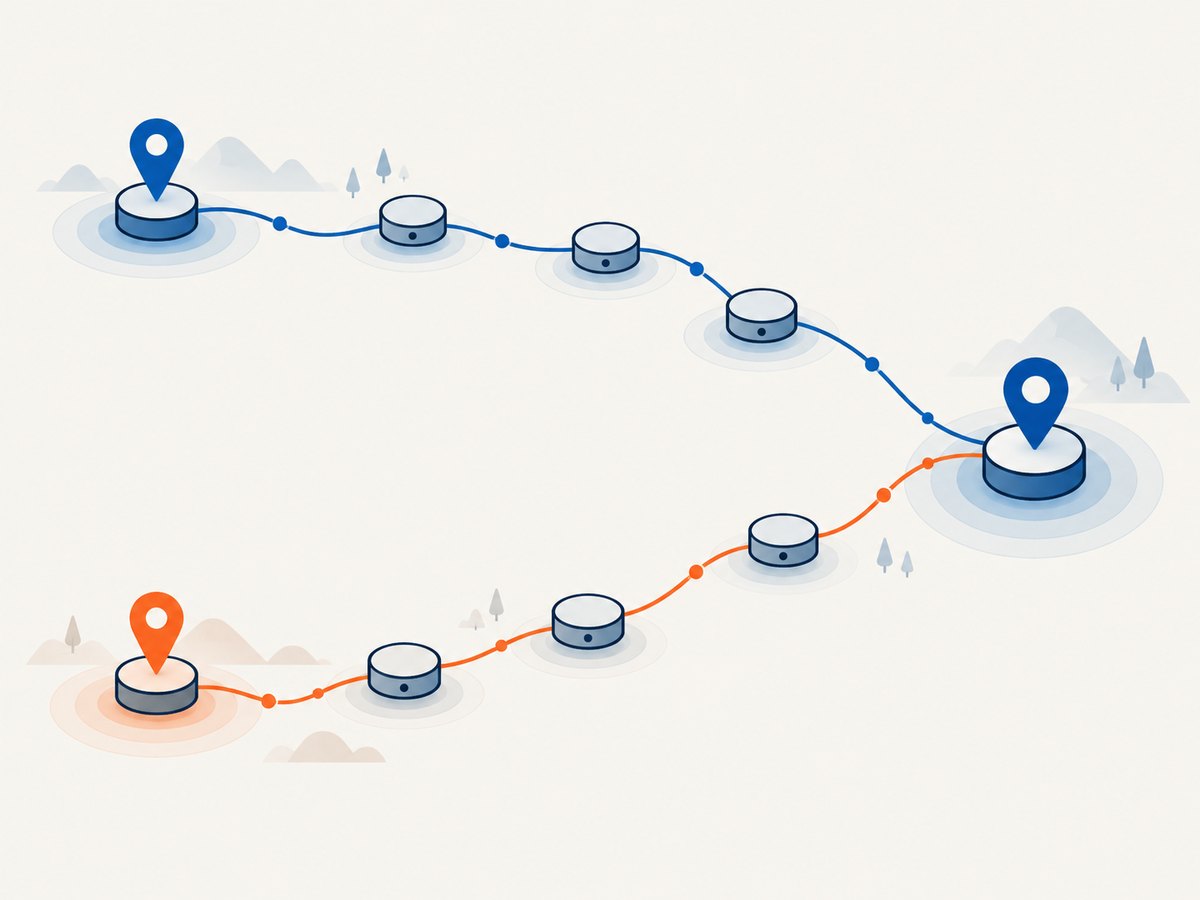
Online traceroute tools show the route from a probe operated by the service to a destination. They do not automatically show the route from your laptop, office, or affected server. Choose a probe close to the source network you need to investigate; if the issue seems location-specific, compare it with a local trace or another origin.
For broad, multi-origin investigations, start with RIPE Atlas. For a quick multi-probe check, try traceroute.dev or mtr.si. A single-origin service such as Traceroute Online is useful when its stated Newark, New Jersey vantage point is relevant. A missing reply at one hop does not by itself establish packet loss in forwarded traffic.
How to choose a traceroute tool
Before comparing results, write down the question you need to answer: Does a particular network reach a destination? Did a route change during an incident? Is the problem limited to one region? Or do you need repeated latency observations? The source location and measurement type matter more than a route map’s appearance.
| Need | Start with | Why |
|---|---|---|
| Compare routes from multiple networks | RIPE Atlas measurements | Measurements can use probes in different networks. |
| Explore a complex Atlas path visually | Khipu | It presents Atlas measurement paths in IP, ASN, and country views. |
| Compare an Atlas route over time | Path Analysis | It compares traceroute data across time windows. |
| Run a quick check from several listed locations | traceroute.dev or mtr.si | Both present multiple diagnostic modes and locations. |
| Check a relevant provider network | That provider’s public looking glass | The origin may better match the network under investigation. |
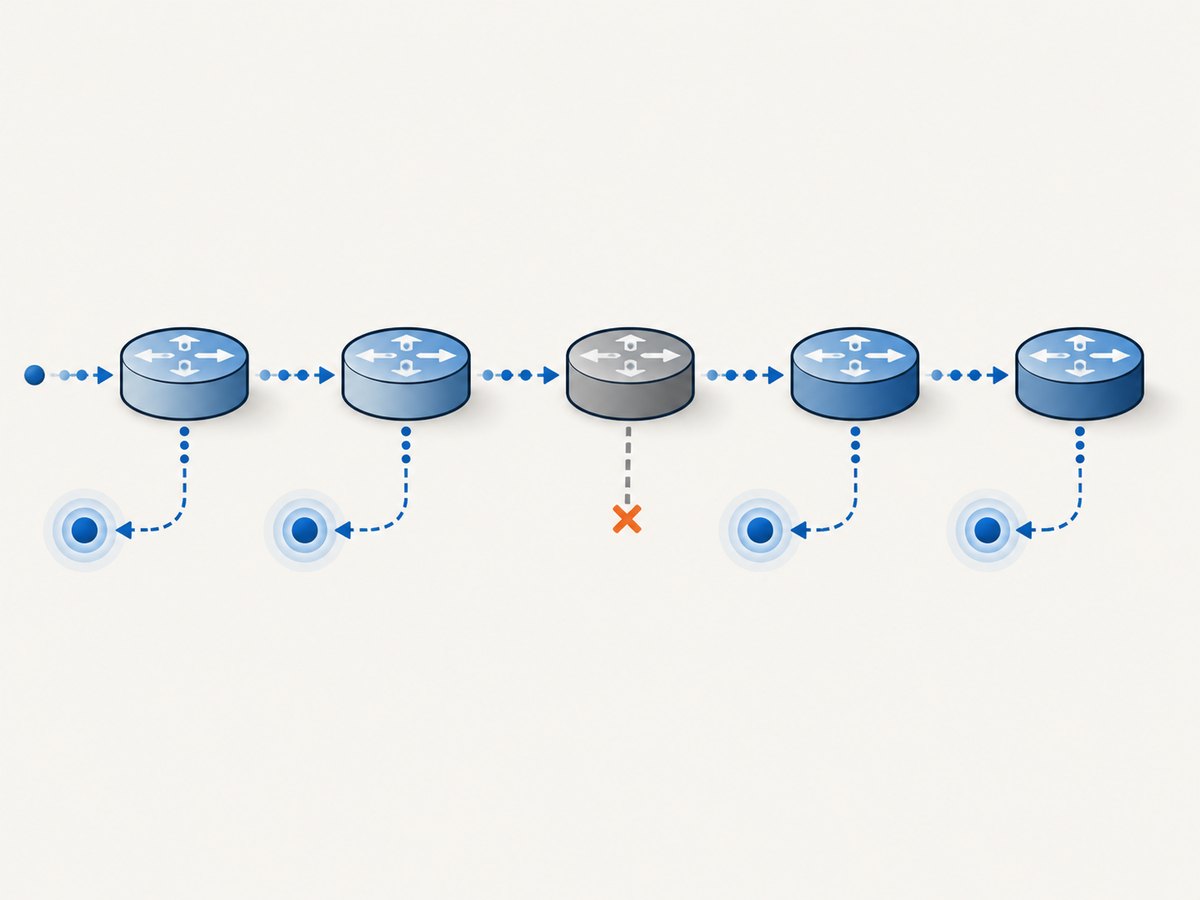
Traceroute sends probes with increasing time-to-live (TTL). When a router decrements the TTL to zero, it may return an ICMP Time Exceeded message. The returned hop and round-trip time (RTT) give a partial view of the path. Responses depend on network policy and device behavior: intermediate routers may not answer diagnostic probes, even while forwarding ordinary traffic.
10 online traceroute options
This list includes measurement platforms, visual analysis tools, and looking-glass services. They are not ten independent probe networks. RIPE Atlas’s visualization and comparison tools consume Atlas measurements; a provider looking glass is a category, and its availability depends on the provider.
- RIPE Atlas measurements. Use Atlas to run traceroute and other measurements from probes across participating networks. It is the strongest option here for comparing origins and building a deeper measurement investigation. Custom measurements use credits, so check the current account and credit requirements before planning repeated runs. RIPE Atlas documentation.
- RIPE Atlas QuickLook. QuickLook is an immediate reachability interface for ping or traceroute measurements with a map view. Check the live page for access eligibility and current terms before relying on it for a team workflow; the supplied research identifies member eligibility but does not establish current terms. Atlas remains the underlying measurement ecosystem.
- RIPE Atlas Khipu. Khipu visualizes Atlas measurement data, including traceroute paths. Its IP view exposes hop addresses; ASN view groups them by network; country view abstracts further. Use IP detail for hop-level inspection and the higher-level views to see which networks or regions appear in the path. It is a visualization of Atlas data, not another probe network. Khipu documentation.
- RIPE Atlas Path Analysis. Compare trace data across time windows to investigate path changes, latency shifts, and ASN or IXP transitions. It is useful when a route used to work or perform differently. Select a relevant measurement and source probe, then compare before and after periods. It analyzes Atlas measurement data rather than initiating an unrelated probe network. Path Analysis documentation.
- traceroute.dev Looking Glass. This web interface offers traceroute, MTR, and ping from listed probes and shows probe locations and networks. Choose a location that helps answer the source-network question, then compare results from another origin if needed. The displayed probe inventory can change, so treat live counts as temporary.
- mtr.si Network Diagnostics. The service presents Globalping-backed MTR, traceroute, ping, DNS, and HTTP checks from multiple locations. Use the mode that matches the symptom: DNS for resolution, HTTP for an application endpoint, and traceroute or MTR for path clues. Its listed locations may change over time.
- Traceroute Online. This tool states that its vantage point is Linode in Newark, New Jersey, and accepts a domain or IP address. It is a useful single-origin view when Newark is relevant to your investigation. Its own guidance cautions that the route may differ from your connection. Open the traceroute tool.
- US Dedicated Looking Glass. The service advertises live ping, traceroute, and MTR from seven North American points of presence. It may help when a North American server origin is pertinent. Confirm the live locations and supported commands before choosing it for an incident comparison.
- Webex Looking Glass. The research identified a traceroute feature, but the available evidence about its interface and access is limited. Verify the live page and its supported commands before using it as an operational dependency. Treat it as a possible vantage point, not as a verified multi-probe measurement platform.
- A looking glass near the affected network. Search the ISP, hosting provider, or network operator involved for a public looking glass. Use it only after confirming that it offers traceroute and that its origin is relevant. Looking-glass access and command support vary by operator, so there is no single universal endpoint to provide here.
Run a trace and compare it with an online result
A local trace answers a different question than a remote web trace. Use both when the affected path starts at your own connection or server. Save the destination, timestamp, source location, address family, and measurement type with the result; without those details, comparisons can be misleading.
Linux and macOS
# Linux: UDP probes by default on many distributions
traceroute example.com

# Linux: use ICMP echo probes
traceroute -I example.com

# Linux: use TCP probes to a service port when supported
traceroute -T -p 443 example.com

# macOS: traceroute example.com

# Repeated path and latency observations, if MTR is installed
mtr -rw -c 20 example.com
Windows
tracert example.com

# Repeated route and latency observations
pathping example.com
Options vary by operating system and implementation. Check the local command’s help before assuming that Linux flags work on macOS or Windows. If a hostname has both IPv4 and IPv6 records, test each family when the issue may be family-specific; use the platform’s supported address-family option or trace the literal address. A hostname can resolve to different addresses at different times or from different resolvers.
Use web interfaces for remote origins
- Enter a hostname or IP accepted by the service. Prefer the actual affected endpoint; a hostname can select a different address than the failing connection used.
- Choose a probe or region close to the network whose behavior you want to understand. For a multi-probe tool, select more than one origin when regional differences matter.
- Run traceroute for a hop sequence. Run MTR when repeated observations are useful, or ping, DNS, and HTTP checks when those are the symptom.
- Record the measurement time, origin, destination address, protocol or mode, and result. Repeat after a short interval and compare with a trace from the affected device or server.
- Test the destination separately. A trace that stops early does not establish why it stopped.
There is no universal cURL, Python, or Node.js traceroute request to give for these websites: the research dossier does not document stable APIs or request formats for them. Do not infer an API from a browser form. For command-line automation, invoke the installed system utility and capture its output; check the relevant operating system’s documentation and local help for syntax, permissions, and exit behavior. For repeatable remote checks, use the selected service’s documented interface and terms.
Read results without overclaiming
- Asterisks or missing hops: They mean no reply was displayed for those probes. They do not prove that ordinary traffic is being dropped at that router.
- A trace ends before the destination: The result is inconclusive by itself. Filtering, probe behavior, return-path behavior, or a reachability problem are all possibilities. Compare another origin and test the endpoint separately.
- One hop has a high RTT: A router’s reply time is a round trip to that router, not a delay that can simply be assigned to that hop. Later hops may use different reply handling. Look for a sustained change in later responses and corroborate it with end-to-end checks.
- A geographic map shows a long jump: Locations are estimates. Connecting lines are not proof of physical cable routes, fiber paths, or peering agreements.
- Different origins show different routes: That is useful evidence of path variation. It does not establish that one route is faulty; compare endpoint reachability and performance from each source.
MTR adds repeated route and latency observations, which can make intermittent patterns easier to notice. It still relies on intermediate devices responding to diagnostic probes. A displayed loss percentage at one intermediate hop needs context: check whether the pattern continues to the destination and whether application traffic is actually affected.
A practical troubleshooting workflow
- Confirm the symptom. Record which users or systems are affected, the destination, the time window, and whether the problem is latency, timeouts, DNS, or application errors.
- Check the endpoint independently. Test name resolution and the destination service. Traceroute is a path diagnostic, not a replacement for DNS or HTTP checks.
- Run from the affected source. Capture a local trace and, if useful, a repeated MTR or platform equivalent.
- Run from a comparable remote probe. Pick a probe in or near the affected source network. A random faraway probe may take a different route and answer a different question.
- Compare another origin or time. Use Atlas probes for distributed views; use Path Analysis when you have time-separated Atlas data. Check whether the destination remains reachable even when a middle hop is silent.
- Share evidence with the operator. Include timestamps with timezone, source and destination addresses, trace mode, full output, and a concise description of the impact. Avoid claiming that a specific router is dropping forwarded packets based only on missing replies.
Performance, reliability, and cost
A web trace is convenient, but it adds dependence on the service’s probe availability, chosen origin, and current interface. Probe inventories and access conditions can change. For incident work, record the origin and measurement time, repeat observations, and corroborate important findings locally or from another probe. A successful remote trace does not guarantee the affected user has the same route.
RIPE Atlas supports distributed measurements and custom measurements use credits. Confirm current credit requirements and account conditions before designing frequent monitoring. The dossier does not establish pricing for the other listed services, so check their current terms instead of assuming a free tier, usage limit, or service-level guarantee. Do not use an interactive web page as a monitoring API unless its operator documents that use.
Troubleshooting common problems
| Symptom | Likely explanation | What to do |
|---|---|---|
| Every hop is silent | The selected protocol may be filtered, the origin may not support the test, or replies may not be returned. | Try a supported alternate trace mode or another probe; test the endpoint with ping or the relevant application protocol. |
| The trace stops at one network | Intermediate or destination responses may be filtered; the trace alone cannot identify the cause. | Compare another origin, address family, and time. Check endpoint reachability separately. |
| Local and online routes disagree | They start in different networks and may take different routes. | Choose an online probe closer to the affected source and label each result with its origin. |
| A middle hop reports loss but later hops respond | The router may limit or deprioritize diagnostic replies while forwarding traffic. | Check destination responses and application symptoms; do not attribute end-to-end loss to that hop alone. |
| Hostname results vary | Resolution or address-family selection may differ by source or time. | Record the resolved IP, then test the relevant IPv4 and IPv6 destinations separately. |
| A web tool rejects a destination | The interface may restrict formats, commands, or targets. | Use the accepted hostname or address format and consult that service’s live documentation. Do not try to bypass its restrictions. |
| A map implies an implausible route | Hop geolocation is approximate and does not map the physical network path. | Use IP and ASN-level evidence and treat geography as orientation only. |
Or skip the browser setup
If the incident also involves capturing a website’s visible state, ScreenshotNeo is a website screenshot API and MCP server. One GET request can return a screenshot or PDF. It complements network diagnostics by recording what a page rendered; it does not replace traceroute or explain a network route.
For example, capture a traceroute tool’s page as a visual record (this captures the page, not a network trace):
curl -G "https://api.screenshotneo.com/v1/shot" -d access_key=YOUR_API_KEY --data-urlencode url=https://traceroute.dev -o shot.webpSee the ScreenshotNeo docs for the API. Cookie banners, popups, and chat widgets are removed before the shot; bot checks, blank pages, and failed loads are never billed; an MCP server lets AI agents take screenshots. The Free plan includes 1,000 screenshots a month with no card, and paid plans start at $5 for 3,000. Sign up free and capture up to 1,000 screenshots a month with no card.
FAQ
Can an online traceroute show my home internet route?
Only if the trace originates from your connection. A website’s result starts at its own probe. Run a local trace for your route and compare it with a relevant remote origin.
Does a missing hop mean packet loss?
No. A missing diagnostic reply alone does not prove forwarded traffic is being lost. Check subsequent hops and the destination, repeat the measurement, and compare another origin.
Which option is best for route changes over time?
RIPE Atlas Path Analysis is designed to compare traceroute data across time. You need relevant Atlas measurements and source probes for the comparison.
Should I use a map to identify the cable or provider responsible?
No. Map locations are estimates, and a plotted line does not establish the physical cable path or identify responsibility. Use hop and network evidence as clues, then corroborate with the operator.


