10 Open-Source Application Performance Monitoring Tools
Compare 10 open-source APM tools, from OpenTelemetry and Jaeger to Elastic, Tempo and SigNoz, with architecture and selection guidance.
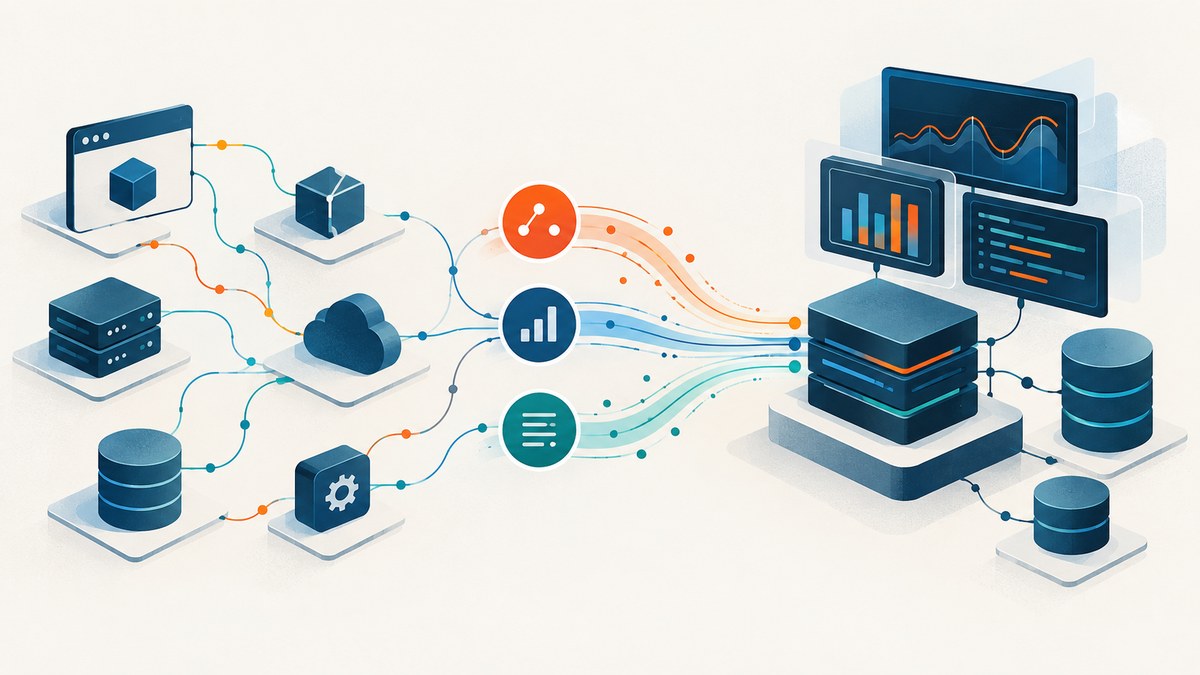
Direct answer: the best open-source application performance monitoring tool depends on what you need to observe and what you already operate. OpenTelemetry is the portable instrumentation and pipeline layer; it is not a storage or visualization backend. Elastic APM is the most integrated choice for teams already using Elasticsearch and Kibana. Jaeger and Grafana Tempo are focused tracing backends. SigNoz provides an OTLP-native unified observability interface. Apache SkyWalking, Zipkin, Pinpoint, OpenObserve and Uptrace cover other combinations of tracing, metrics, logs and application monitoring.
A practical default architecture is: instrument applications with OpenTelemetry, send telemetry through the OpenTelemetry Collector, then choose a backend such as Jaeger, Tempo, Elastic APM, SigNoz or another OTLP-capable system. This keeps application code portable while letting the operations team change storage and query systems later.
What open-source APM includes
“APM” is used for several related jobs:
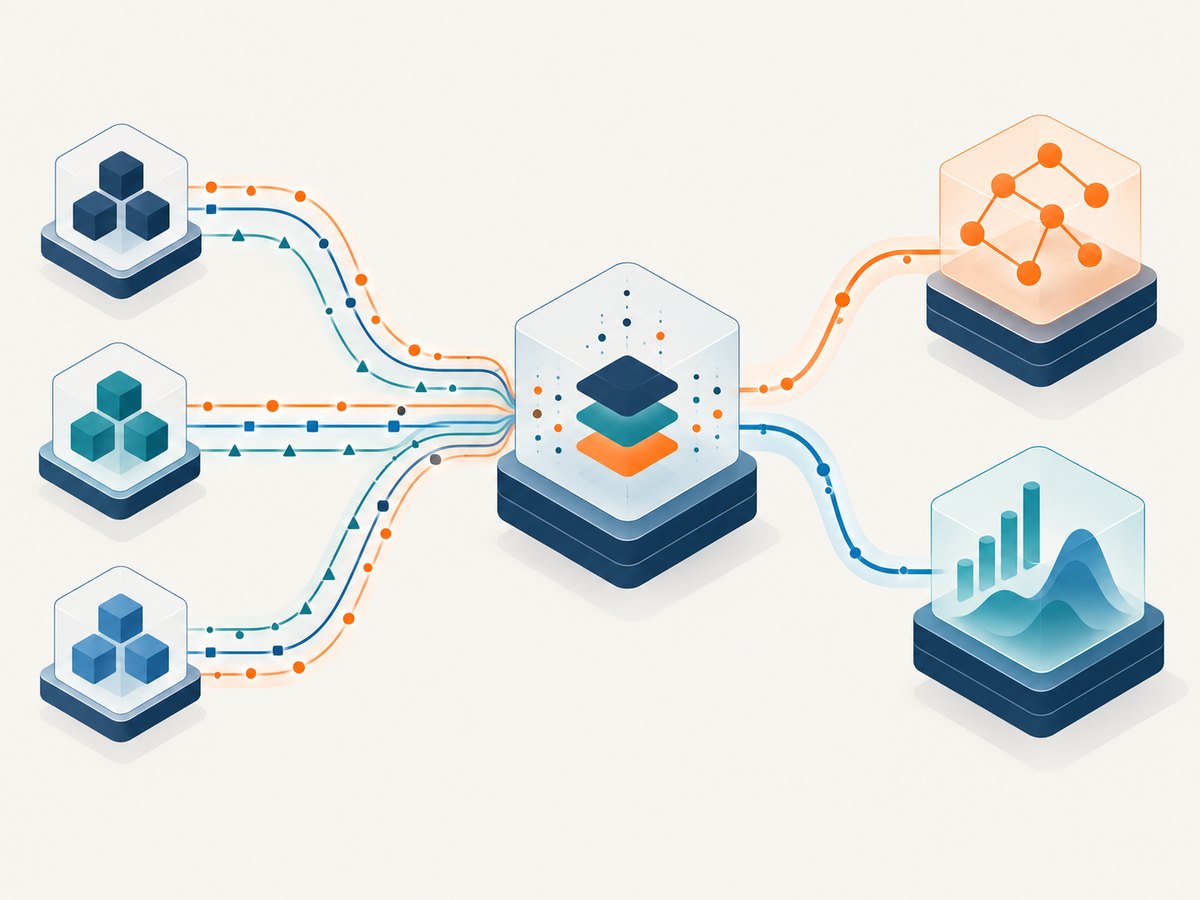
- Instrumentation: libraries, agents or eBPF collect spans, metrics, errors and runtime data.
- Collection and routing: a collector receives telemetry, adds attributes, samples data and exports it.
- Storage and indexing: a backend retains data and makes it searchable.
- Analysis: a UI provides trace waterfalls, service maps, error views, dashboards and alerts.
OpenTelemetry covers the first two jobs. Its documentation states plainly that “OpenTelemetry is not an observability backend itself.” You must pair it with a backend. The OpenTelemetry ecosystem registry lists Apache SkyWalking, Jaeger, Elastic, Grafana Labs and SigNoz as organizations with open-source observability products and native OTLP support.
Quick comparison
| Tool | Best fit | Primary scope | Key decision |
|---|---|---|---|
| Elastic APM | Teams operating Elastic Stack | APM, errors, metrics and related logs | Elasticsearch/Kibana operations and retention |
| Jaeger | Focused distributed tracing | Traces | Storage backend, retention and query scale |
| Apache SkyWalking | Service topology and application monitoring | APM and traces | Agent and language coverage |
| SigNoz | Unified OTLP observability | Traces, metrics and logs | One interface versus separate specialized systems |
| Grafana Tempo | Grafana-centric tracing at scale | Traces | Operating the wider Grafana stack |
| OpenTelemetry Collector | Portable telemetry pipelines | Receive, process and export | Requires a backend and UI |
| Zipkin | Simple tracing deployments | Traces | Sampling, storage and UI requirements |
| Pinpoint | JVM-oriented monitoring evaluations | APM and traces | Current runtime and agent support |
| OpenObserve | Single backend for telemetry | Logs, metrics and traces | Ingestion, queries, retention and OTLP fit |
| Uptrace | OpenTelemetry-oriented APM | APM and observability | Self-hosted packaging, storage and UI workflow |
1. Elastic APM
Elastic APM is a full APM system built around the Elastic Stack. Elastic documents collection of incoming request response time, database queries, cache calls, external HTTP calls, unhandled errors and metrics. It fits organizations that already run Elasticsearch and Kibana or want one search and analytics platform for APM and logs.
You can deploy an APM Server yourself or follow Elastic’s current OpenTelemetry collection guidance. Before choosing it, estimate index growth, shard and storage needs, retention, and the operational work of Elasticsearch. Elastic APM is broader than a traces-only backend, but its value is highest when Elastic is already a platform standard.
2. Jaeger
Jaeger is a long-standing open-source distributed-tracing backend in the OpenTelemetry ecosystem, with native OTLP support recorded in the ecosystem registry. It is a good fit when the main question is “where did this request spend time across services?”
Plan storage before production. Trace volume is shaped by request rate, span count, payload size, sampling and retention. Compare supported storage backends, query latency at your expected history size, compaction, backups and multi-tenancy. Jaeger does not automatically provide the complete logs-and-metrics experience of an integrated APM suite.
3. Apache SkyWalking
Apache SkyWalking is an open-source APM and observability project listed by OpenTelemetry as an OSS option with native OTLP support. It is a candidate for teams that want service topology and application monitoring in addition to trace search.
Validate agent support for every language and framework in your estate, especially older runtimes and asynchronous workloads. Confirm how SkyWalking models service, endpoint and instance data, then estimate storage and retention for topology history.
4. SigNoz
SigNoz is an OTLP-native open-source observability platform. It is useful when a team wants one interface for traces, metrics and logs without stitching together several independent products.
Because it accepts OpenTelemetry data, you can instrument once and change backend decisions later. Evaluate ingestion format, query behavior, retention controls, storage dependencies and the amount of operational work required at your scale. Compare its unified workflow with Elastic APM and with a Grafana stack built around Tempo.
5. Grafana Tempo
Grafana Tempo is an open-source, high-scale distributed-tracing backend. Grafana documents trace search, metrics generated from spans, and links between traces, logs and metrics. Tempo is most compelling when Grafana is already your dashboard and alerting environment.
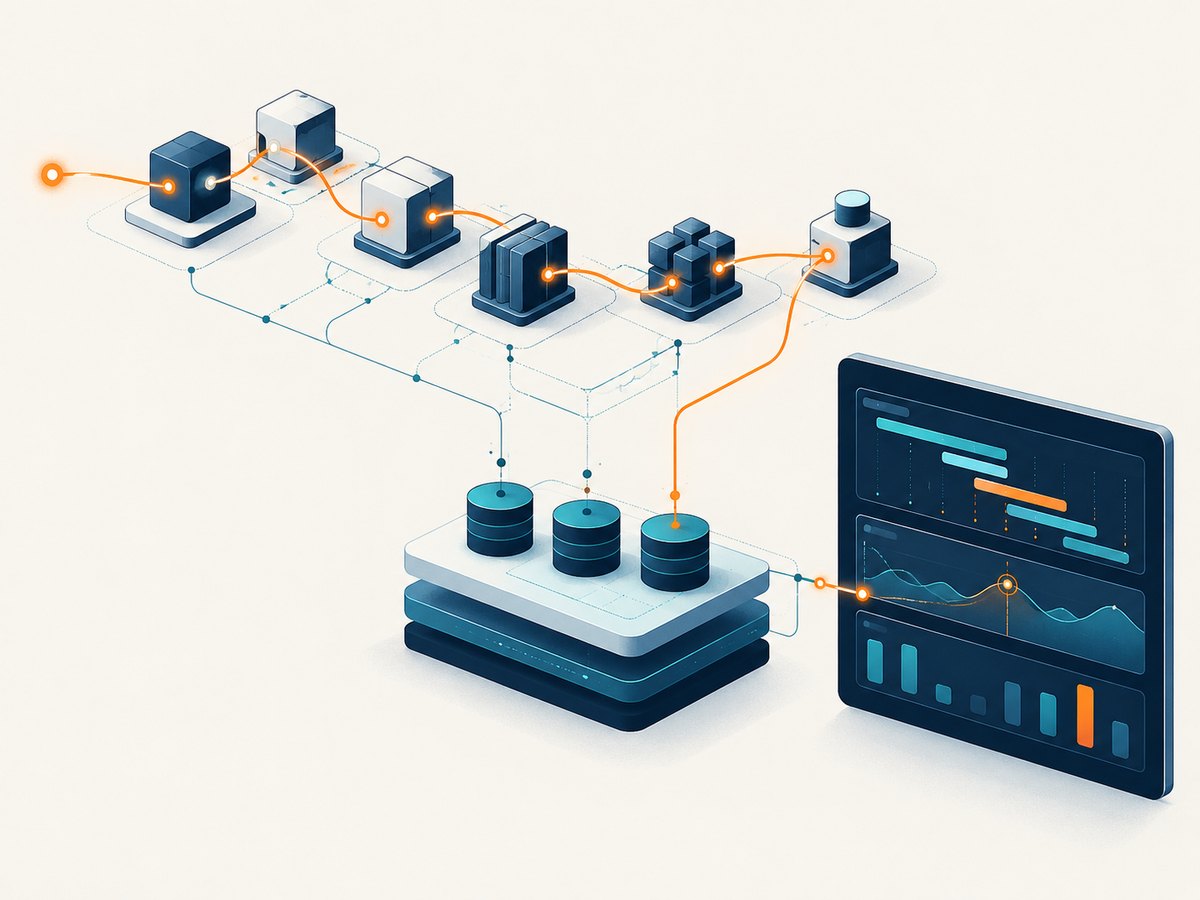
Tempo is a tracing component rather than a complete APM product by itself. You normally combine it with Grafana for visualization and with metrics and log systems for the surrounding investigation workflow. Grafana’s Application Observability documentation describes Alloy as a collector in that ecosystem; Tempo documentation recommends a collector to receive application traces and forward them to the backend.
6. OpenTelemetry Collector
The OpenTelemetry Collector is the vendor-neutral pipeline layer. It receives telemetry, processes it and exports it to one or more destinations. It is not an APM UI or storage backend, so pair it with Jaeger, Tempo, Elastic, SigNoz or another backend.
A minimal collector configuration looks like this:
receivers:
  otlp:
    protocols:
      grpc:
      http:

processors:
  batch:

exporters:
  otlp/tempo:
    endpoint: tempo:4317
    tls:
      insecure: true

service:
  pipelines:
    traces:
      receivers: [otlp]
      processors: [batch]
      exporters: [otlp/tempo]
The exact exporter and endpoint depend on your backend. In production, add memory limits, retry and queue settings, authentication, TLS, health checks and a deliberate sampling policy. Run collectors close to workloads when network locality matters, and use a gateway tier when you need centralized policy or fan-out.
7. Zipkin
Zipkin is a focused open-source distributed-tracing backend that can be paired with OpenTelemetry instrumentation. Treat it as a tracing component rather than a complete logs-and-metrics APM suite.
Choose Zipkin when its storage, sampling and UI model match your needs and the team wants a small tracing surface. Compare it directly with Jaeger and Tempo for retention, query behavior, integrations and operational familiarity.
8. Pinpoint
Pinpoint is an open-source application performance and distributed-tracing option, particularly relevant to teams evaluating JVM-oriented monitoring. Confirm current agent, runtime and release support for your languages before committing.
Test representative frameworks, asynchronous calls, database drivers and messaging clients. A tool that instruments one sample service well may require additional work for the rest of a polyglot estate.
9. OpenObserve
OpenObserve is an open-source observability backend candidate for teams seeking one platform for logs, metrics and traces. Compare its ingestion and query model, retention controls and OpenTelemetry compatibility with SigNoz and the Grafana stack.
Pay attention to the operational shape of high-cardinality fields, index or stream design, object storage use, query concurrency and tenant isolation. These details often determine cost and reliability more than the product name.
10. Uptrace
Uptrace is an OpenTelemetry-oriented observability and APM backend candidate. Evaluate its current self-hosted packaging, supported runtimes, storage requirements and UI workflow against SigNoz, Elastic APM and Grafana components.
Check how it handles trace-to-log navigation, metrics derived from spans, alerting, retention and upgrades. Confirm that the deployment model fits your security and network requirements before migrating production telemetry.
How to choose an open-source APM stack
Step 1: Define the telemetry you need
Write down whether you require distributed traces only, or also infrastructure metrics, application metrics, logs, error grouping, profiling, service maps and alerting. A traces-only backend can be the right answer for a narrowly defined problem; a unified product can reduce stitching for a broader one.
Step 2: Standardize instrumentation
Prefer OpenTelemetry SDKs or supported agents when portability matters. Record language, framework, database, queue and deployment coverage. Decide which resource attributes are stable and safe to index, such as service name, environment and region.
Step 3: Design sampling and retention
Head sampling reduces volume before export; tail sampling keeps traces that match conditions such as errors or high latency. Set separate retention for detailed traces, aggregated metrics and logs. Do not index unbounded user IDs, request bodies or arbitrary URLs without a clear query need.
Step 4: Choose the storage architecture
Compare local disks, object storage, Elasticsearch-style indexes and columnar stores. Estimate daily telemetry volume, replication, backup, compaction, query concurrency and recovery time. Ask how a backend behaves when storage is unavailable: queue, drop, block application traffic or retry indefinitely.
Step 5: Operate the pipeline
Monitor collector queue depth, export failures, dropped spans, CPU, memory and network. Secure OTLP endpoints with TLS and authentication. Separate telemetry credentials from application credentials, and redact secrets before export.
Performance, reliability and cost considerations
- Application overhead: instrumentation adds CPU, memory and network work. Measure representative endpoints with sampling enabled and disabled.
- Collector capacity: batch processors improve efficiency, while oversized batches increase memory pressure and export latency.
- Cardinality: high-cardinality attributes make indexes and queries expensive. Keep dimensions intentional.
- Reliability: use retry queues and backpressure controls, but prevent telemetry failures from blocking customer requests.
- Cost: self-hosting removes a per-event vendor bill but moves cost into compute, storage, backups, upgrades and on-call time. Retention and replication usually dominate.
- Security: treat traces as sensitive data. URLs, SQL statements, headers and exception messages can contain personal or secret information.
Troubleshooting common failures
| Symptom | Likely cause | Fix |
|---|---|---|
| No traces appear | Wrong OTLP endpoint, protocol or exporter | Check collector logs, endpoint DNS, port, TLS mode and authentication. Send a known test span. |
| Only some services are visible | Instrumentation missing or inconsistent service names | Verify SDK or agent startup in every service and set a stable service.name resource attribute. |
| Traces are incomplete | Sampling, context propagation or unsupported library | Temporarily increase sampling, verify W3C trace context propagation and check instrumentation coverage. |
| Collector memory grows | Exporter outage, oversized batches or unbounded retry queue | Set memory limits, tune batch sizes, cap queues and restore the destination. Do not allow infinite buffering. |
| Queries become slow | Retention or cardinality growth | Reduce indexed dimensions, shorten detailed-trace retention and review storage partitioning. |
| Telemetry leaks secrets | Headers, SQL or exception attributes captured raw | Use redaction processors and instrumentation filters before export; rotate any exposed credential. |
Or skip the browser setup
APM teams often need screenshots of dashboards, incident pages or customer-facing status views for tickets and reports. ScreenshotNeo provides a website screenshot API and MCP server. A single GET request returns PNG, JPEG, WebP or PDF. Cookie and consent banners, newsletter popups and chat widgets are removed before capture; bot checks, blank pages, failed loads, timeouts and cache hits are not billed. Responses identify the result with X-Page-Verdict and X-Billed headers. Its MCP server provides take_screenshot, get_page_info and capture_pdf tools for Claude, Cursor and other MCP clients.
Read the ScreenshotNeo API documentation for all options.
curl -G 'https://api.screenshotneo.com/v1/shot' \
  -d access_key=YOUR_API_KEY \
  --data-urlencode url=https://stripe.com \
  -o shot.webp
import requests
r = requests.get(
'https://api.screenshotneo.com/v1/shot',
params={'access_key': 'YOUR_API_KEY', 'url': 'https://stripe.com'},
timeout=90,
)
r.raise_for_status()
open('shot.webp', 'wb').write(r.content)const q = new URLSearchParams({ access_key: 'YOUR_API_KEY', url: 'https://stripe.com' });
const res = await fetch(`https://api.screenshotneo.com/v1/shot?${q}`);
if (!res.ok) throw new Error(`Screenshot failed: ${res.status}`);
const fs = await import('node:fs/promises');
await fs.writeFile('shot.webp', Buffer.from(await res.arrayBuffer()));Features include full-page capture with lazy images loaded, CSS-element capture, dark mode, device presets, retina scale, PDF paper and page controls, custom CSS and JavaScript, clicks, selector waits, delays, network-idle waits, request blocking, custom headers and cookies, timezone and geolocation, transparent backgrounds, resizing, TTL caching, signed links, asynchronous jobs with signed webhooks, bulk capture for 100 URLs per call, a usage API and an OpenAPI specification. Parameter names used by other screenshot APIs also work, which simplifies migration.
Create a free ScreenshotNeo account for 1,000 screenshots each month with no card. Paid plans start at $5 for 3,000 screenshots.
FAQ
Can OpenTelemetry replace an APM product?
No. It provides instrumentation and telemetry pipelines. You still need storage, querying and visualization.
Should I choose Jaeger or Tempo?
Choose based on storage, query, retention and existing platform fit. Tempo is especially natural in a Grafana environment; Jaeger is a focused tracing backend with broad ecosystem familiarity.
Is self-hosted APM free?
The software may be open source, but compute, storage, backups, upgrades and on-call work still have costs.
Can one collector export to multiple backends?
Yes. Configure multiple exporters and pipelines, then control duplication, sampling, credentials and retention deliberately.
How often should I reassess the stack?
Review after major changes in traffic, retention, cloud architecture or language mix, and before committing to a long-lived storage design.


