10 Open-Source Log Collectors for Centralized Logging
Compare 10 open-source log collectors by inputs, processing, delivery, operations, and ecosystem fit, then choose a practical shortlist.
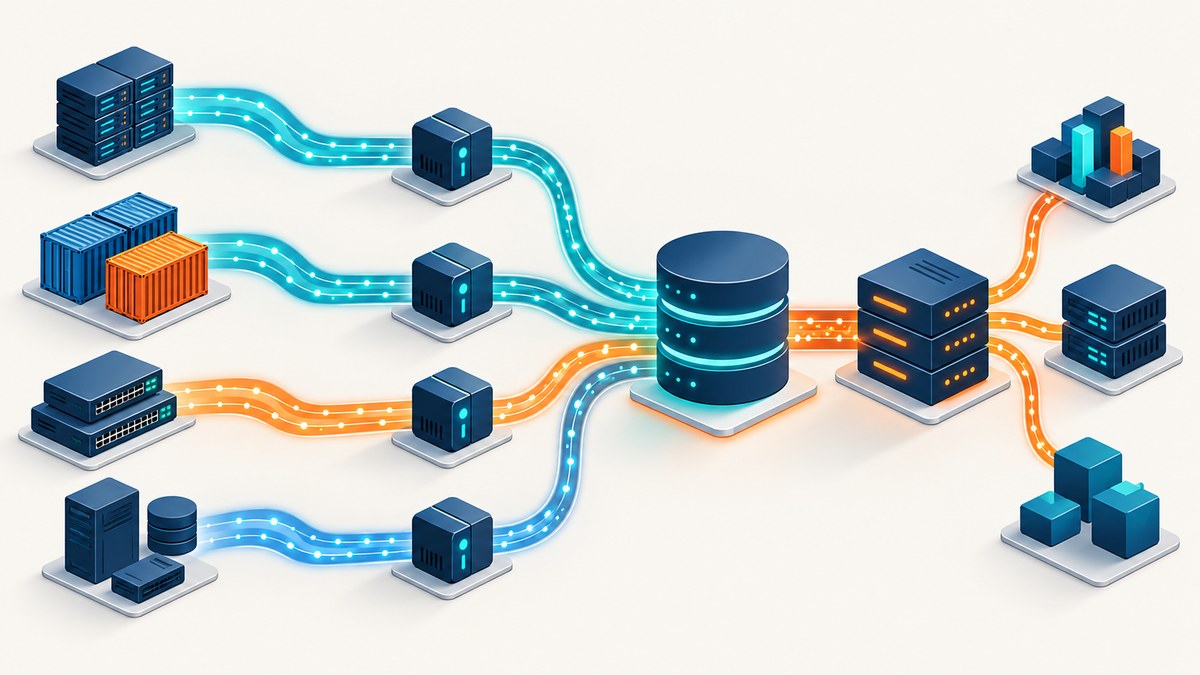
Direct answer: the best open-source log collector depends on your inputs, destination, processing rules, and operating model. Fluent Bit is a strong lightweight host and container agent; Fluentd and Logstash suit broader plugin-based processing; OpenTelemetry Collector and Grafana Alloy fit vendor-neutral telemetry pipelines; Filebeat is a natural choice for Elastic deployments; Vector is a flexible observability pipeline. rsyslog and syslog-ng remain candidates for traditional syslog estates, while Promtail should be evaluated only after checking its current lifecycle and Grafana migration guidance.
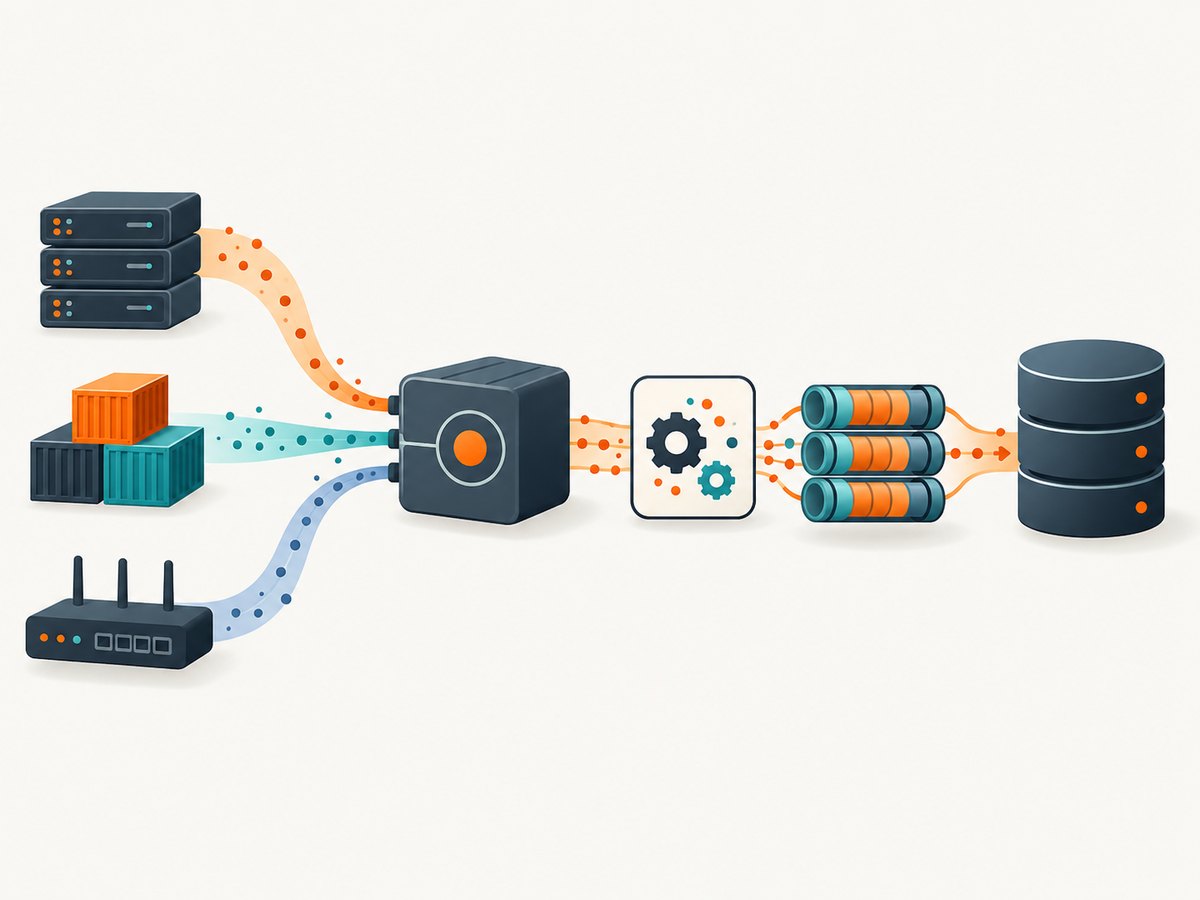
A collector is one layer of a logging system. It reads or receives events, optionally parses and enriches them, and forwards them. Durable storage, indexing, search, retention, and dashboards normally live in a separate backend. OpenTelemetry describes this as a receive-process-export pipeline, while Filebeat documents forwarding harvested events to Elasticsearch or Logstash. OpenTelemetry Collector documentation and Filebeat documentation explain those roles.
What to decide before choosing a collector
Write down the complete path from source to query interface. A collector that looks ideal in isolation can be a poor fit when it cannot read one required source, lacks the destination plugin you need, or cannot buffer during an outage.
| Decision | Questions to answer |
|---|---|
| Sources | Files, journald, syslog, container runtime logs, Kubernetes metadata, cloud APIs, or application-native OTLP? |
| Destinations | Which backend and protocol are required? Can the agent write directly, or must it send to a gateway? |
| Processing | Do you need JSON or regex parsing, multiline joining, filtering, redaction, enrichment, or routing by field? |
| Delivery | What happens during a network outage, destination throttling, log rotation, or a collector restart? Is loss acceptable? |
| Operations | How will configuration, upgrades, secrets, and fleet-wide rollout be managed? |
| Security | Which TLS, authentication, least-privilege file access, and sensitive-field controls are required? |
Measure with your real event sizes, multiline patterns, transforms, destination, buffering settings, and exact versions. The 2022 CNCF comparison is useful historical context, but it is not a current controlled benchmark. CNCF’s comparison makes the same practical point: evaluate the workload rather than relying on a universal ranking.
At-a-glance comparison
| Collector | Best starting point | What to verify |
|---|---|---|
| Fluent Bit | Lean host, container, or Kubernetes agent with routing and parsing | Destination plugins, buffering mode, and memory limits for your workload |
| Fluentd | Plugin-rich processing and custom transformations | Runtime and operational cost compared with a lightweight agent |
| OpenTelemetry Collector | Vendor-neutral logs, metrics, and traces pipeline | Whether your chosen distribution includes every receiver, processor, and exporter |
| Vector | Flexible observability data pipeline | Current source, transform, and sink support in the release you deploy |
| Logstash | Highly configurable pipelines, especially Elastic-oriented estates | Current plugin, installation, and licensing details |
| Filebeat | File harvesting into Elasticsearch or Logstash | Use current filestream guidance; legacy log input is deprecated or removed in recent contexts |
| rsyslog | Traditional system and network syslog forwarding | Current project documentation for protocols, modules, and delivery behavior |
| syslog-ng | Syslog-focused collection and routing | Community versus commercial features, protocols, and licensing |
| Grafana Alloy | Grafana ecosystem and OpenTelemetry-compatible collection | Component availability and configuration differences from upstream OTel |
| Promtail | Existing Loki deployments only after lifecycle review | Current Grafana status and migration path before starting a new deployment |
1. Fluent Bit
Fluent Bit’s manual describes it as a fast, lightweight telemetry agent for logs, metrics, and traces. Its input-filter-output design supports parsers such as JSON, Regex, LTSV, and Logfmt, plus TLS/SSL and memory or filesystem buffering. It is a practical default when agents run on every node and must consume modest resources.
Use it for container and host collection, field normalization, filtering, and fan-out to several outputs. Validate backpressure and buffer sizing against your destination. A configuration that uses only memory can lose queued records during a crash; filesystem buffering changes the disk and latency trade-off.
2. Fluentd
Fluentd is the broader, plugin-oriented project in the Fluent ecosystem. The project’s own comparison explains that Fluentd provides a larger data-processing ecosystem, while Fluent Bit targets a lighter agent role. Choose it when plugin breadth or custom processing is more important than a minimal footprint.
Document the plugins your pipeline depends on and pin compatible versions. A plugin-heavy design can be powerful, but it also increases upgrade and troubleshooting surface area. Run representative load tests with multiline records and your real output acknowledgements.
3. OpenTelemetry Collector
OpenTelemetry Collector offers a vendor-agnostic implementation for receiving, processing, and exporting telemetry. Its logs guidance covers file reading, rotation, checkpoints, parsing, and network protocols. You can deploy it as a node agent, gateway, or both, and use one operational model for logs, metrics, and traces.
Start with a distribution that contains the receivers, processors, and exporters you require. Keep agent pipelines small and move shared enrichment or fan-out to a gateway when that simplifies fleet management. The project explicitly allows pairing with an external agent where that is useful. OpenTelemetry logging guidance details the log data model and collection concerns.
receivers:
  filelog:
    include: [/var/log/myapp/*.log]
    start_at: end
processors:
  batch: {}
exporters:
  otlp:
    endpoint: collector-gateway.example:4317
service:
  pipelines:
    logs:
      receivers: [filelog]
      processors: [batch]
      exporters: [otlp]
4. Vector
Vector is an open-source observability data pipeline. The project repository and the CNCF overview place it alongside Fluent Bit, Fluentd, and Logstash, but you should consult the current Vector documentation and repository for the exact sources, transforms, and sinks in your release.
It is a good candidate when you want explicit transforms and routing in a single pipeline. Evaluate configuration ergonomics, buffering, and destination acknowledgements with your event shape rather than assuming results from older comparisons.
5. Logstash
Logstash remains a configurable pipeline candidate, particularly in Elastic-oriented environments. Its value is the ability to compose inputs, filters, and outputs for complex transformations. The available comparative evidence is dated, so verify current installation, plugin, licensing, and destination details in official Elastic documentation before standardizing on it.
Use a small pipeline per responsibility where possible. Isolate expensive parsing and monitor queue growth. If the same host only needs file tailing and forwarding, compare the operational cost of a lighter agent first.
6. Filebeat
Filebeat watches configured locations, harvests log events, and forwards them to Elasticsearch or Logstash. That makes it a natural fit for an Elastic-centered stack. Read the current Filebeat documentation when writing configurations: recent major-version contexts deprecate or remove the old log input and direct users to filestream.
Plan for rotation, registry state, multiline rules, and permissions on every host. Confirm that the destination and ingest pipeline agree on field names and timestamp handling before rollout.
7. rsyslog
rsyslog is a candidate for traditional system and network syslog collection and forwarding. This research pass did not capture a suitable current official documentation page, so verify protocol coverage, modules, configuration syntax, licensing, and delivery guarantees from the current project documentation before making a production decision.
It is most likely to fit environments already standardized on syslog semantics. Test malformed messages, bursts, queue limits, and destination outages with the exact modules you plan to enable.
8. syslog-ng
syslog-ng is another syslog-focused collection and routing option. Confirm current community and commercial feature boundaries, supported protocols, and licensing from official sources. Compare its configuration and operational model with rsyslog if your estate is primarily network devices and traditional Unix syslog.
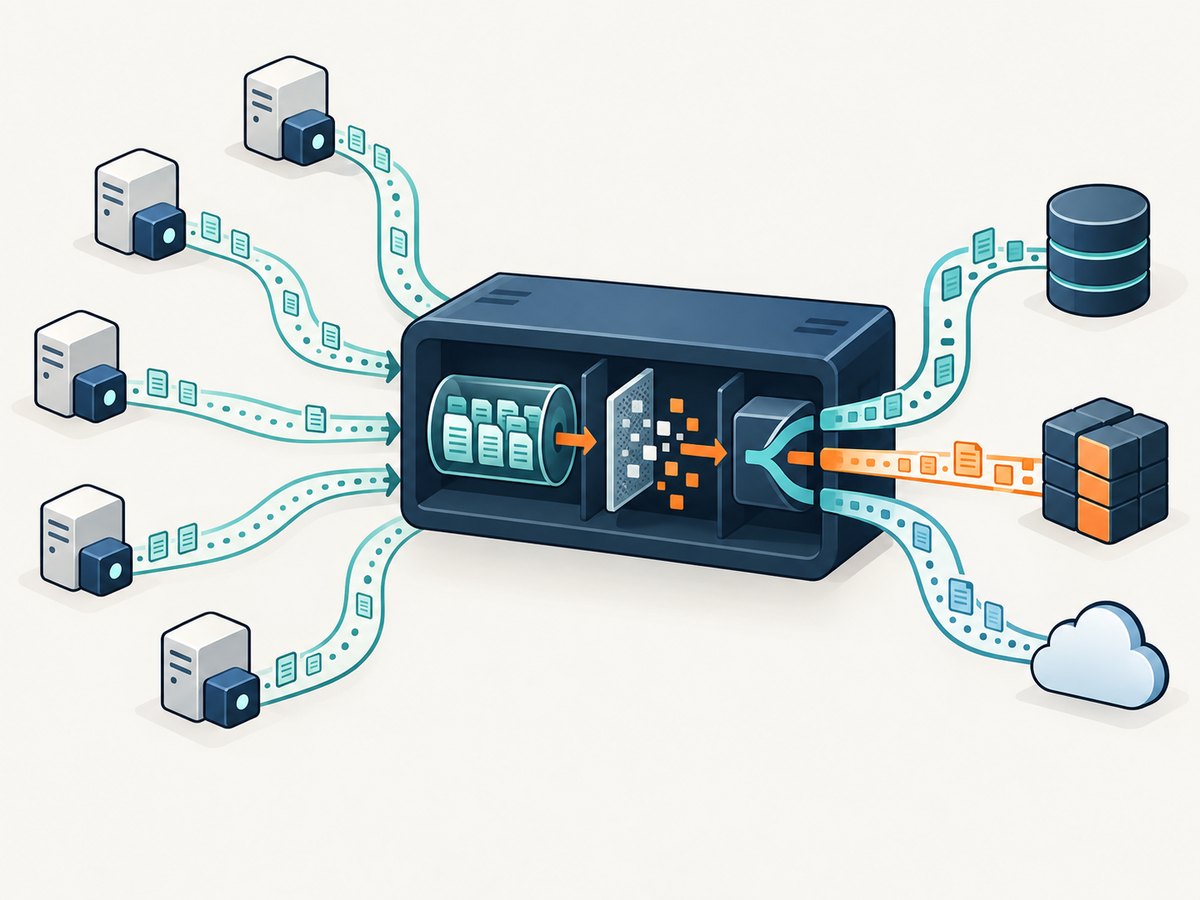
Include firewall rules, TLS certificate rotation, queue persistence, and replay behavior in your proof of concept. These details determine whether a nominally successful forwarder protects logs during an outage.
9. Grafana Alloy
Grafana Alloy is an OpenTelemetry Collector distribution from Grafana. It is relevant when Grafana and Loki are already central to your observability stack or when you are migrating from Grafana Agent. Compare its current components and configuration with upstream OpenTelemetry Collector, and confirm every receiver, processor, and exporter needed for your pipeline.
Keep the ownership boundary clear: Alloy collects and processes; Loki or another backend stores and indexes. Monitor the collector’s own health, queue depth, and export errors.
10. Promtail
Promtail is a Loki-oriented candidate, but its current lifecycle was not verified in the supplied research. Before recommending it for a new deployment, check Grafana’s present lifecycle and migration guidance. Existing Loki users should document whether they are maintaining Promtail, migrating to Alloy, or using another supported collector.
Do not copy an old configuration without checking current labels, positions, multiline behavior, and authentication support. A lifecycle decision is as important as feature compatibility.
A repeatable evaluation plan
- Build a source matrix. Include one representative file, journald or syslog stream, container workload, and any OTLP source.
- Define the output contract. Record endpoint, authentication, TLS, batching, acknowledgement, and retry requirements.
- Test processing. Use JSON, unstructured text, multiline stack traces, malformed records, redaction, and enrichment.
- Exercise failure modes. Stop the destination, rotate files, restart the collector, fill the local buffer, and restore the network.
- Measure operations. Capture CPU, memory, disk growth, event latency, queue depth, dropped records, and configuration reload behavior.
- Review security. Verify least-privilege reads, secret storage, certificate rotation, and removal of sensitive fields before export.
Performance, reliability, and cost notes
There is no universal fastest collector. Throughput changes with event size, parsing complexity, multiline assembly, compression, TLS, batching, disk buffering, and destination response time. Benchmark the complete path, not an isolated parser.
Reliability is a configuration property. Checkpoint files or registries prevent rereading after restarts, but abrupt termination can still create duplicates. Memory buffers reduce disk use but lose queued data on a crash. Filesystem queues improve outage tolerance while consuming disk and adding write latency. Decide whether your backend and downstream processing are idempotent.
Open-source software may have no license fee, but total cost includes hosts, storage, egress, operations, upgrades, support, and incident recovery. A lightweight agent can reduce node overhead; a richer pipeline may reduce custom services and maintenance elsewhere. Price the whole architecture.
Troubleshooting common failures
| Symptom | Likely cause | Fix |
|---|---|---|
| No events arrive | Wrong path, permissions, inactive input, or firewall block | Check collector self-logs, read the file as the service user, and verify network connectivity. |
| Duplicate events after restart | Checkpoint or registry state is missing, delayed, or inaccessible | Persist state on durable storage and confirm ownership and write permissions. |
| Multiline traces are split | Parser starts a new record for each line | Define start and continuation rules and test stack traces from every application language. |
| Events are dropped during an outage | Memory-only buffering, queue limits, or expired retry policy | Enable and size disk buffering where supported; monitor queue saturation and disk usage. |
| High CPU or memory | Expensive regex, unbounded labels, large batches, or excessive fan-out | Simplify parsing, cap fields, tune batches, and move shared work to a gateway. |
| TLS or authentication errors | Wrong CA, hostname, certificate permissions, token, or clock | Validate the certificate chain and system time, then test with the service account. |
| Rotated files are missed | Incompatible rotation pattern or stale state | Use the collector’s current rotation guidance and test rename, copy-truncate, and compression modes. |
Or skip the browser setup
If you are documenting this architecture, generating runbook pages, or capturing dashboards for an internal catalog, ScreenshotNeo provides a one-request website screenshot API. It accepts the cookie or consent banner before capture and removes more than 60 known consent platforms, newsletter popups, and chat widgets. Bot checks, blank pages, timeouts, failed loads, and cache hits are not billed, and response headers identify the page verdict and billing status. Its MCP server provides take_screenshot, get_page_info, and capture_pdf tools for Claude, Cursor, and other MCP clients.
See the ScreenshotNeo API documentation for all options. A basic call is:
curl -G "https://api.screenshotneo.com/v1/shot" -d access_key=YOUR_API_KEY --data-urlencode url=https://stripe.com -o shot.webpimport requests
r = requests.get("https://api.screenshotneo.com/v1/shot", params={"access_key": "YOUR_API_KEY", "url": "https://stripe.com"}, timeout=90)
open("shot.webp", "wb").write(r.content)const q = new URLSearchParams({ access_key: 'YOUR_API_KEY', url: 'https://stripe.com' });
const res = await fetch(`https://api.screenshotneo.com/v1/shot?${q}`);You can request full-page or element captures, dark mode, device presets or custom viewports, retina scale, PDF output, custom CSS and JavaScript, selector waits, delays, network-idle waits, blocked resources, headers, cookies, user agents, authorization, timezone, geolocation, transparent backgrounds, resizing, caching, signed links, asynchronous jobs, webhooks, bulk capture of up to 100 URLs, and usage data. Every feature is available on every plan. The free plan includes 1,000 screenshots per month with no card; paid plans start at $5 for 3,000. Create a free ScreenshotNeo account.
FAQ
Is a collector the same as a log database?
No. A collector receives, processes, and forwards events. Storage, indexing, retention, search, and dashboards are separate concerns.
Should every host run the same collector?
Usually, standardizing the node agent reduces operations, but gateways and specialized syslog or OTLP collectors can still be justified.
How do I prevent sensitive data from leaving a host?
Redact or drop fields before export, restrict file permissions, protect credentials, and verify the final serialized event in a staging pipeline.
Can I compare benchmark numbers from blog posts?
Use them only as hypotheses. Re-run tests with your event shapes, transforms, buffers, destination, versions, and failure scenarios.
When should I use an OpenTelemetry-based collector?
Choose it when vendor-neutral protocols and one pipeline for logs, metrics, and traces reduce integration work, provided your distribution has the required components.


