Best Open-Source Monitoring Tools for Websites and Infrastructure
Compare Prometheus, Zabbix, Nagios Core, and Checkmk by monitoring job, from endpoint probes to infrastructure and browser journeys.
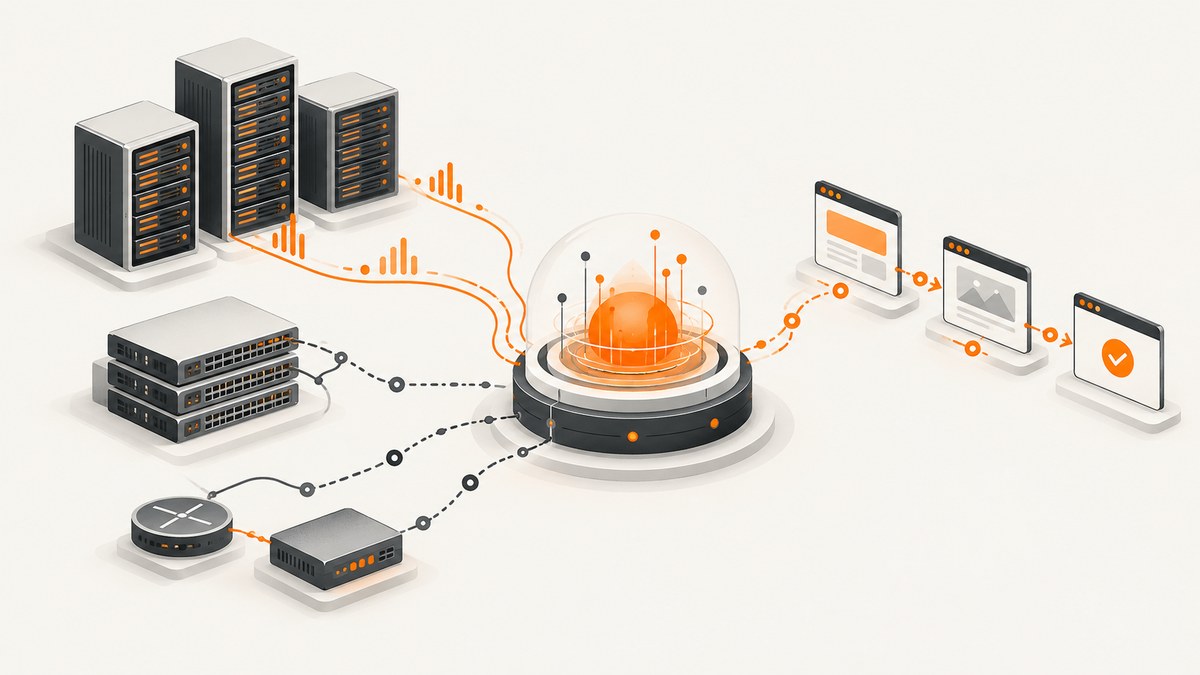
The best open-source monitoring tool depends on what you need to observe. For metrics and alert rules, start with Prometheus. For broad infrastructure monitoring and multi-step HTTP website scenarios, consider Zabbix. For configurable checks built around plugins, consider Nagios Core. For a smaller environment where Checkmk Community’s vendor-described focus fits, consider Checkmk.
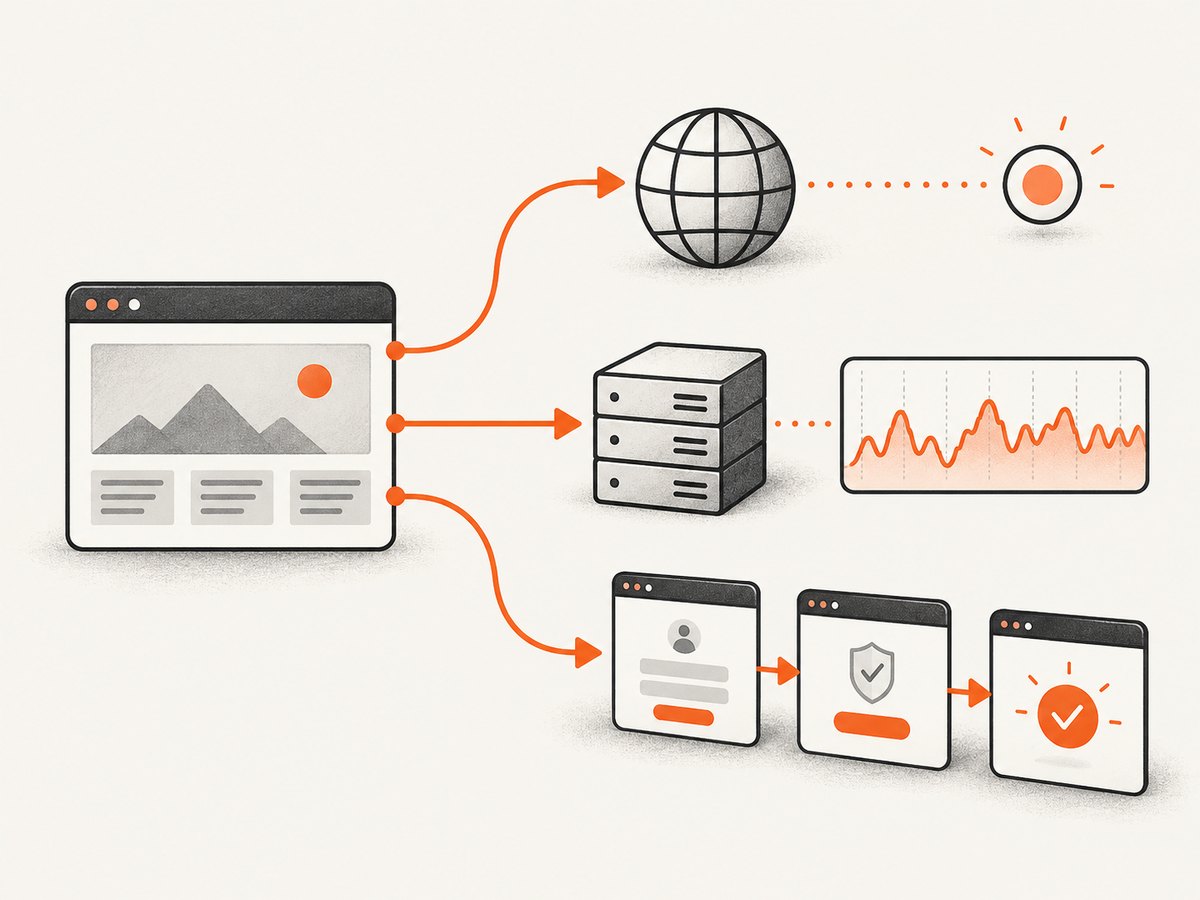
These are different monitoring models, not a universal performance ranking. An HTTP endpoint probe tells you whether a protocol-level request succeeds. A browser scenario can exercise multiple web application steps. Neither automatically replaces application metrics, host monitoring, or a real user journey in a browser. This guide helps you match the tool and check type to the question you need answered.
1. Decide what “website monitoring” means
Before choosing a product, write down the failure you want to detect. A site can return a successful HTTP response while its login flow is broken; an endpoint can be reachable while its server is running out of disk space. These symptoms need different checks.
| Monitoring question | Useful check | What it does not establish by itself |
|---|---|---|
| Can an external system reach this HTTP, DNS, TCP, ICMP, or gRPC endpoint? | Protocol or black-box probe | That a user can complete a multi-step browser workflow |
| Are response times, error rates, resource use, or application measurements changing? | Metrics collection, queries, and alert rules | That the page looks correct to a visitor |
| Can a user-facing sequence such as page load, sign-in, and content verification complete? | Multi-step web scenario or browser journey | Why the application is slow internally |
| Are hosts, network devices, databases, applications, and services healthy? | Infrastructure monitoring with suitable checks or agents | Every external perspective or browser behavior |
For a useful baseline, pair checks where the failure modes differ. For example, combine a public HTTP probe with application metrics and a browser scenario for a critical sign-in flow. Set alert thresholds and intervals according to the service’s impact and your response capacity; excessively frequent checks can create noise and load without improving diagnosis.
2. Compare the open-source options by job
Prometheus and Blackbox Exporter: metrics plus external probes
Prometheus collects and stores timestamped time-series metrics. PromQL lets you query, correlate, and transform those measurements, and alerting rules can evaluate PromQL expressions. Notification handling is a separate responsibility: Prometheus sends alerts to Alertmanager, which can group, route, silence, and inhibit notifications. Grafana or other API consumers can visualize collected data. See the Prometheus overview and alerting overview.
For external checks, Prometheus Blackbox Exporter probes endpoints over HTTP, HTTPS, DNS, TCP, ICMP, and gRPC. This is a good fit when you already operate Prometheus and want probe results in its metrics and alerting model. A probe is not a full browser. Use it to answer reachability or protocol questions; use a browser scenario for interactions that depend on page behavior. See the Blackbox Exporter project.
Zabbix: broad infrastructure monitoring and web scenarios
Zabbix describes coverage across networks, servers, virtual machines, applications, services, databases, websites, and cloud environments, with notifications, visualization, and reporting. Its web monitoring feature defines ordered HTTP or HTTPS request steps; it can preserve cookies within a scenario, follow redirects, check returned content, and simulate a login. That makes it relevant when “website monitoring” means more than a single request. See Zabbix features and its web monitoring documentation.
Zabbix states that it is distributed under AGPL-3.0 and documents commercial support. Check current licensing and support terms against the project’s own documentation before adopting it. Its breadth can be useful when one system should cover multiple infrastructure types, but the source material does not establish that it is simpler or faster to configure than the alternatives.
Nagios Core: checks and plugins
Nagios Core is a fit when you want to define service checks and extend coverage through plugins. Its documented scope includes servers, network devices, websites, DNS, and services. The project describes flexible notifications and escalation, availability reporting, and performance-data export. A plugin can implement a check for a specific service or application. See the Nagios Core project and feature list.
Evaluate the checks and integrations your environment needs, then review how you will configure, maintain, and route their results. The source set describes Nagios capabilities but does not establish a comparative setup-time claim, so choose based on your check requirements and operating model.
Checkmk Community: a candidate for smaller environments
Checkmk positions its Community edition as free and open source for smaller infrastructures, and describes auto-discovery and integrations. That vendor positioning may be relevant for a home lab, test setup, or compact infrastructure. It is not an independently verified capacity guarantee or benchmark. Confirm which features are available in the edition you plan to run and review current licensing and support terms on the Checkmk Community page and edition documentation.
3. Choose with a practical decision path
- Start with the failure you need to catch. If the question is “can I reach the endpoint?”, choose a protocol probe. If it is “is the service becoming slow?”, collect metrics. If it is “can a user sign in and see the expected page?”, define a multi-step scenario.
- Check your existing architecture. If Prometheus already collects metrics, Blackbox Exporter can add external probes in the same metrics model. If broad inventory and multiple infrastructure types are central, assess Zabbix. If you need custom checks with a plugin-centered extension path, assess Nagios Core.
- For a smaller environment, evaluate Checkmk Community on its stated terms. Its vendor describes a focus on smaller environments, auto-discovery, and integrations. Validate those features against your specific host and service list.
- Separate availability from browser behavior. A 200 response does not prove a workflow works. Decide whether redirects, cookies, authentication, content checks, or client-side behavior matter.
- Plan notifications and ownership. Decide who receives an alert, what evidence it should contain, and how maintenance or known dependencies affect it. In Prometheus, include Alertmanager in the design; it is a separate component.
- Verify edition and license details. Review the current upstream documentation before deploying, especially if you need support, longer reporting history, or features that may vary by edition.
4. A runnable Prometheus Blackbox Exporter example
The following minimal configuration illustrates the pattern: run Blackbox Exporter, tell Prometheus how to scrape it, and define a target. It checks one HTTPS endpoint at the protocol level; it does not run a browser or sign in.
Configure a basic HTTP probe
# blackbox.yml
modules:
  http_2xx:
    prober: http
    timeout: 5s
    http:
      method: GET
      preferred_ip_protocol: ip4
      valid_status_codes: []
Save this as blackbox.yml, then start the exporter with the configuration file. The binary or container deployment method depends on your environment; use the project’s current installation instructions.
./blackbox_exporter --config.file=blackbox.yml
Configure Prometheus to scrape the exporter’s probe endpoint and rewrite the target parameter. Replace https://example.com/health with an endpoint you control or are authorized to monitor.
# prometheus.yml
scrape_configs:
  - job_name: blackbox-http
    metrics_path: /probe
    params:
      module: [http_2xx]
    static_configs:
      - targets:
          - https://example.com/health
    relabel_configs:
      - source_labels: [__address__]
        target_label: __param_target
      - source_labels: [__param_target]
        target_label: instance
      - target_label: __address__
        replacement: 127.0.0.1:9115
With the exporter and Prometheus running, inspect the probe endpoint directly:
curl 'http://127.0.0.1:9115/probe?module=http_2xx&target=https%3A%2F%2Fexample.com%2Fhealth'
In Prometheus, query probe_success to see whether the latest probe succeeded. Add an alert rule for a sustained failure rather than paging on a single transient result. Configure Alertmanager separately for routing and notification behavior. For production, restrict access to monitoring endpoints, use appropriate TLS and authentication where needed, and avoid putting credentials in world-readable configuration.
5. Add visual website checks when the page itself matters
Protocol checks and web scenarios answer important questions, but a screenshot can help inspect rendered output: for example, whether a deployment changed a landing page, the page rendered blank, or an unexpected overlay obscures content. A screenshot is evidence for a human or visual comparison workflow; it does not replace an alerting system or prove every interaction works.

ScreenshotNeo is a website screenshot API and MCP server from Yorker Media. A single GET request can return a PNG, JPEG, WebP, or PDF. Its options include full-page capture, CSS selector capture, device and viewport choices, dark mode, custom CSS and JavaScript, waits, request blocking, headers and cookies, caching, signed links, and asynchronous or bulk capture. See ScreenshotNeo and the API documentation for the available parameters.
For agent workflows, its MCP server exposes take_screenshot, get_page_info, and capture_pdf to Claude, Cursor, and other MCP clients. Use a screenshot alongside monitoring when it helps diagnose what a visitor sees; keep protocol checks and infrastructure alerts responsible for availability and health signals.
Or skip the browser setup
Here is a one-call screenshot request. Replace the target URL with the page you want to inspect and keep your API key private. The examples save the response body; consult the docs for output formats and response handling.
cURL
curl -G "https://api.screenshotneo.com/v1/shot" -d access_key=YOUR_API_KEY --data-urlencode url=https://example.com -o shot.webpPython
import requests

r = requests.get(
    "https://api.screenshotneo.com/v1/shot",
    params={"access_key": "YOUR_API_KEY", "url": "https://example.com"},
    timeout=90,
)
r.raise_for_status()
open("shot.webp", "wb").write(r.content)
Node.js
const q = new URLSearchParams({
  access_key: 'YOUR_API_KEY',
  url: 'https://example.com'
});
const res = await fetch(`https://api.screenshotneo.com/v1/shot?${q}`);
if (!res.ok) throw new Error(`Screenshot request failed: ${res.status}`);
await import('node:fs/promises').then(fs => fs.writeFile('shot.webp', Buffer.from(await res.arrayBuffer())));
ScreenshotNeo accepts cookie or consent banners like a visitor and removes more than 60 known consent platforms, newsletter popups, and chat widgets before capture; each of those steps can be turned off. Bot checks or CAPTCHAs, blank pages, timeouts, failed loads, and cache hits cost nothing, and responses identify the page verdict and billing status in headers. AI agents can use the MCP server tools. The Free plan includes 1,000 screenshots a month with no card; paid plans start at $5 for 3,000. These are screenshots, not a substitute for alerting, metrics, or multi-step monitoring. Check the docs for configuration and response details, then sign up for 1,000 free screenshots a month with no card.
6. Reliability, performance, and cost considerations
Reduce false alarms without hiding real failures
- Use a success condition that reflects the service: expected status codes, expected content, and a realistic timeout.
- For a browser or multi-step check, use a dedicated low-privilege monitoring account. Zabbix’s scenario guidance recommends a separate account with minimal permissions.
- Set retry behavior and alert duration deliberately. Retries can absorb brief network issues, but too many can delay detection.
- Check the monitoring path itself. A failed probe might mean the target is down, or that DNS, routing, credentials, or the monitoring host has a problem.
- Keep monitoring endpoints and credentials protected. Use secret storage or restricted files, and avoid exposing exporter or management endpoints publicly.
Control monitoring load
Every scheduled check creates work on both the monitoring system and the target. A multi-step scenario creates more requests than a single endpoint probe; a full-page browser render is also more resource-intensive than a simple HTTP check. Select intervals based on the time-to-detect you need, the target’s acceptable load, and the number of monitored services. Reuse results carefully, and account for cache behavior when interpreting a screenshot or probe.
Understand the cost model
Open-source licensing does not make operating a monitoring stack cost-free. Budget for compute, storage, backups, upgrades, alert delivery, and the time to maintain checks and investigate noisy signals. Prometheus stores time-series data; retention and cardinality choices affect storage. Infrastructure platforms also need a durable database and a recovery plan appropriate to their deployment. No comparative cost or performance benchmark was verified for these tools, so estimate with your own targets, retention needs, and operations requirements.
ScreenshotNeo offers a separate usage-based screenshot service: Free is 1,000 shots per month with no card; Starter is $5 for 3,000, Growth $15 for 15,000, Pro $39 for 60,000, Scale $99 for 250,000, and Business $249 for 1,000,000. Yearly billing gives two months free, and every feature is on every plan. Treat this as a visual capture budget, not an infrastructure monitoring price comparison.
7. Troubleshooting common monitoring failures
| Symptom | Likely cause | What to check |
|---|---|---|
| Blackbox probe fails but the site opens locally | The exporter host has different DNS, routing, firewall, or TLS behavior | Run the probe from the exporter’s network, inspect its logs, and verify the exact target URL and certificate chain. |
| Prometheus has no probe metrics | Scrape target or relabeling is wrong, or exporter is unreachable | Check Prometheus target health, the exporter address, the /probe path, and the encoded target parameter. |
| Metrics exist but no notification arrives | Alert rule is not firing, Alertmanager is unreachable, or a route/receiver is misconfigured | Inspect the rule state, Prometheus alerting configuration, Alertmanager status, and matching labels and routes. |
| Zabbix scenario fails at login | Form fields, redirect behavior, cookies, or expected page content changed | Review each step, required status code, login fields, redirect setting, and the response/error for the failing step. Use a least-privilege monitoring account. |
| A check is always green while users report a broken page | The check verifies only HTTP reachability, not page content or the user workflow | Add content verification or a multi-step browser scenario for the affected path, and keep the endpoint check for basic reachability. |
| Alerts flap during brief disruptions | Threshold or evaluation window is too sensitive, or the underlying service is unstable | Inspect time-series history, tune the sustained-failure window, and use notification grouping or inhibition where appropriate. |
8. Frequently asked questions
Can one tool monitor a website and all of its infrastructure?
A broad platform may cover many resource types, but the checks still need to match each failure mode. A host metric, external endpoint probe, and authenticated browser path are different signals even when one product presents them together.
Is a screenshot a website uptime check?
A screenshot captures rendered output. It can help inspect what appeared at capture time, but an alerting check should use explicit success criteria and deliver a notification when the condition fails.
Do I need Grafana with Prometheus?
Prometheus documents multiple graphing and dashboarding options, including Grafana and other API consumers. Prometheus can collect, store, query, and evaluate metrics without making one particular visualization consumer mandatory.
Which option is best for a few home computers?
There is no universal answer from the evidence here. Checkmk describes Community as suited to smaller environments; compare its current edition features with the checks you need. Keep the design small enough that you can maintain alerts, backups, and updates.
Where should I verify license and edition terms?
Use the current project documentation and edition pages linked above. Terms and feature availability can change, so confirm them before deployment rather than relying on a summary.
Conclusion
Choose Prometheus with Blackbox Exporter for metrics and external protocol probes in a Prometheus setup; Zabbix for broad infrastructure coverage and documented multi-step web scenarios; Nagios Core when plugin-driven checks fit your needs; and Checkmk Community when its vendor-described small-environment focus matches your setup. First define whether you need endpoint availability, internal metrics, browser workflow checks, or all three. That decision is more useful than a universal ranking.


