How to Capture a PageSpeed Insights Screenshot with JavaScript
Learn when to use the PageSpeed Insights API, Puppeteer, or a custom report to capture a reliable screenshot with JavaScript.

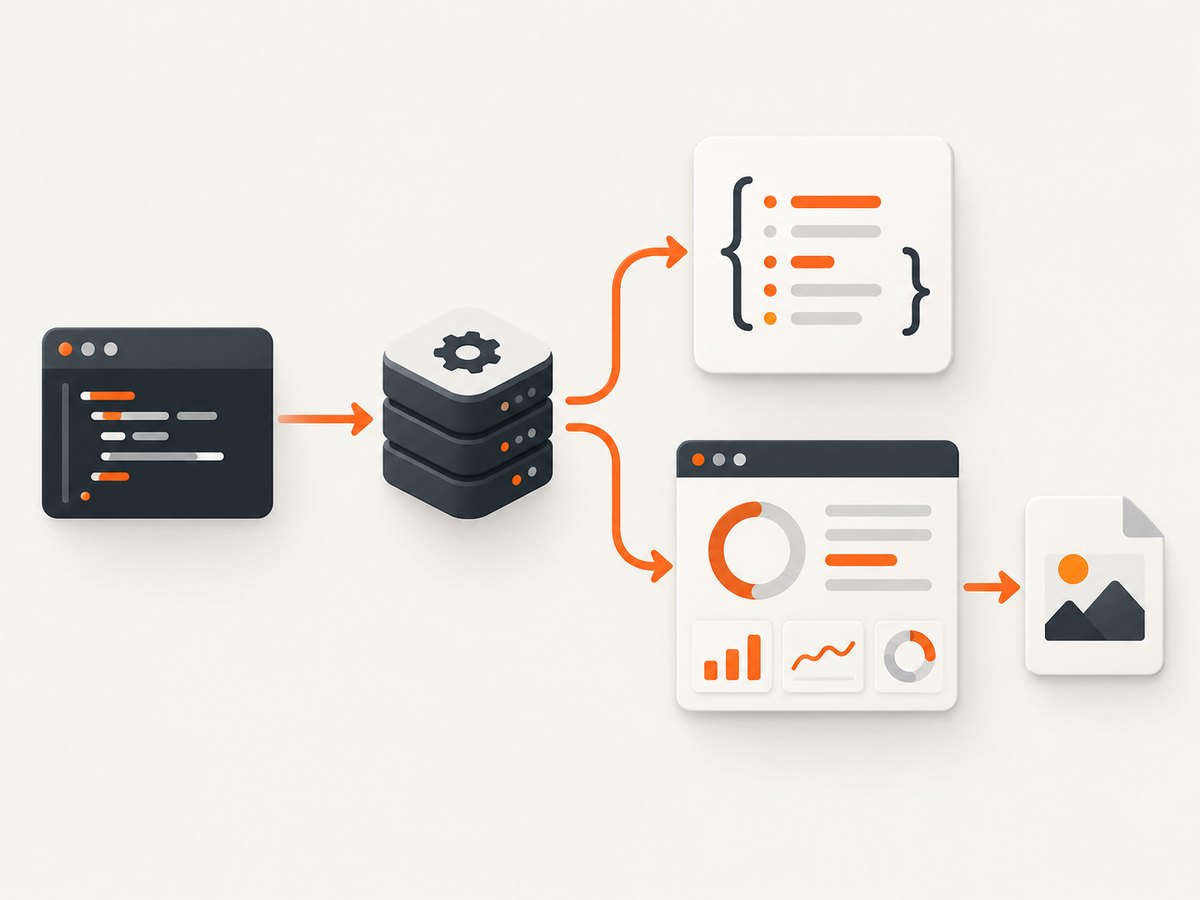
There are two different things developers call a “PageSpeed Insights screenshot”:
- An image of the rendered PageSpeed Insights report. Use browser automation such as Puppeteer and its
page.screenshot()method. - A visual report built from PageSpeed data. Call the current PageSpeed Insights API v5, read the JSON response, render your own HTML, then capture that HTML if you need an image.
The current PageSpeed Insights API returns JSON analysis results. Its documented v5 response does not expose a top-level screenshot field, so older v4 examples that read screenshot bytes are not a current implementation. Google documents the API endpoint and response structure in the PageSpeed Insights API reference. Puppeteer documents browser capture in its screenshots guide.
Choose the artifact you actually need
| Goal | Use | What you receive |
|---|---|---|
| Store or share the visible PSI report | Puppeteer | PNG, JPEG, or another browser screenshot format |
| Read scores, audits, and Lighthouse data | PageSpeed Insights API v5 | JSON containing the analysis and lighthouseResult |
| Create a branded image or PDF | API v5 + your HTML + Puppeteer | A layout you control, rendered and captured by a browser |
Keep these paths separate in your code. Calling the API does not automatically capture the PageSpeed web interface, and opening the interface does not give your program the structured audit data as conveniently as the API.
Prerequisites
- Install a current Node.js release.
- Create a project and install Puppeteer if you need a browser image:
npm install puppeteer. - Choose the exact URL you want to analyze. The API requires a
urlparameter. - Decide whether the analysis should use desktop or mobile. Google documents
desktopas the default and acceptsmobilethrough thestrategyparameter.
Get PageSpeed data with JavaScript
This program calls the v5 runPagespeed method, checks the HTTP status, parses JSON, and prints the Lighthouse result. It retrieves analysis data; it does not take a screenshot.
const endpoint = new URL(
  'https://pagespeedonline.googleapis.com/pagespeedonline/v5/runPagespeed'
);
endpoint.searchParams.set('url', 'https://example.com');
endpoint.searchParams.set('strategy', 'mobile');

const response = await fetch(endpoint);
if (!response.ok) {
  throw new Error(`PSI request failed: ${response.status}`);
}

const result = await response.json();
console.log(result.lighthouseResult);
Google’s official getting-started example uses the same fetch, status check, JSON parsing, and lighthouseResult flow.
Useful response fields
Inspect the returned object rather than assuming a screenshot property exists. The documented response includes an analysis timestamp and a Lighthouse result. Lighthouse audit fields and response details can evolve independently of the API version, so consult the PageSpeed Insights release notes when you depend on a particular field.
Capture the rendered PSI page with Puppeteer
For an image of the report interface, navigate a browser to the report URL and capture the rendered page. The following is a complete starting point:
import puppeteer from 'puppeteer';

const browser = await puppeteer.launch();
try {
  const page = await browser.newPage();
  await page.goto('https://pagespeed.web.dev/', {
    waitUntil: 'networkidle2'
  });
  await page.screenshot({
    path: 'pagespeed-report.png',
    fullPage: true
  });
} finally {
  await browser.close();
}
This outline captures the page that actually rendered in Chromium. Replace the starting URL with the intended PSI report URL for your workflow. You may need to wait for the report content you expect before taking the shot; selectors and navigation behavior can change, and this example does not assume a particular PSI form, consent dialog, or result-page selector. Puppeteer documents page.goto(), the path output option, and fullPage in its ScreenshotOptions reference.
Wait for report content explicitly
When you know a stable element that proves the report is ready, wait for it before capturing. Use the selector from the version of the PSI page your automation targets:
await page.goto(reportUrl, { waitUntil: 'networkidle2' });
await page.waitForSelector('YOUR_REPORT_READY_SELECTOR', {
  timeout: 30_000
});
await page.screenshot({
  path: 'pagespeed-report.png',
  fullPage: true
});
If the page is still loading data after network idle, a readiness selector is more reliable than an arbitrary delay. Keep the selector configurable because the PSI interface can change.
Build a custom screenshot from PSI JSON
If the deliverable is a stable image for a dashboard, ticket, or report, fetch the API result and render only the fields your audience needs. This avoids depending on the layout of the public PSI interface.
import puppeteer from 'puppeteer';
const targetUrl = 'https://example.com';
const endpoint = new URL(
'https://pagespeedonline.googleapis.com/pagespeedonline/v5/runPagespeed'
);
endpoint.searchParams.set('url', targetUrl);
endpoint.searchParams.set('strategy', 'desktop');
const response = await fetch(endpoint);
if (!response.ok) {
throw new Error(`PSI request failed: ${response.status}`);
}
const data = await response.json();
const categories = data.lighthouseResult?.categories ?? {};
const html = `
PageSpeed summary
PageSpeed summary
${targetUrl}
Performance${categories.performance?.score ?? 'n/a'}
Accessibility${categories.accessibility?.score ?? 'n/a'}
Best practices${categories['best-practices']?.score ?? 'n/a'}
SEO${categories.seo?.score ?? 'n/a'}
`;
const browser = await puppeteer.launch();
try {
const page = await browser.newPage();
await page.setContent(html, { waitUntil: 'load' });
await page.screenshot({ path: 'pagespeed-summary.png', fullPage: true });
} finally {
await browser.close();
}This pattern lets you choose the typography, fields, dimensions, and branding while keeping the source data separate from the image-rendering step.
Equivalent API requests in cURL, Python, and Node.js
cURL
curl -G "https://pagespeedonline.googleapis.com/pagespeedonline/v5/runPagespeed" \
  --data-urlencode "url=https://example.com" \
  --data-urlencode "strategy=mobile"
Python
import requests

params = {
    "url": "https://example.com",
    "strategy": "mobile",
}
response = requests.get(
    "https://pagespeedonline.googleapis.com/pagespeedonline/v5/runPagespeed",
    params=params,
    timeout=90,
)
response.raise_for_status()
result = response.json()
print(result.get("lighthouseResult"))
Node.js
const endpoint = new URL(
  'https://pagespeedonline.googleapis.com/pagespeedonline/v5/runPagespeed'
);
endpoint.searchParams.set('url', 'https://example.com');
endpoint.searchParams.set('strategy', 'mobile');

const response = await fetch(endpoint);
if (!response.ok) throw new Error(`PSI request failed: ${response.status}`);
const result = await response.json();
console.log(result.lighthouseResult);
Options and implementation decisions
Desktop versus mobile
Set strategy=desktop or strategy=mobile explicitly when reproducibility matters. Omitting it uses Google’s documented desktop default. Store the strategy with the captured artifact so readers know which analysis it represents.
Full-page versus viewport screenshots
Use fullPage: true when the image should include the entire rendered document. Omit it for a viewport shot. A full-page capture can be very tall; consider a fixed viewport and a custom report when the output must fit a fixed card or document page.
Report URL versus landing page
Opening https://pagespeed.web.dev/ may show an input screen rather than a completed report. For automation, navigate to the report URL your workflow generates and wait for the report content you require. Do not assume that network idle alone means the score cards have finished rendering.
Raw JSON versus a custom visual
Keep raw JSON when another system will process audits. Create a custom HTML report when people need a consistent visual, selected metrics, or a branded layout. This also reduces the maintenance risk caused by changes to the PSI interface.
Troubleshooting
| Symptom | Likely cause | Fix |
|---|---|---|
| The response is not JSON | The request failed or returned an HTTP error. | Check response.ok, log the status, and inspect the response text before parsing. |
| There is no screenshot field | You are using the current v5 API, whose documented response is analysis JSON. | Use Puppeteer for the rendered interface, or render your own HTML from lighthouseResult. |
| The screenshot shows the PSI input page | The browser opened the landing page and captured before a report was submitted. | Navigate to the intended report URL and wait for a report-ready selector. |
| The image is blank or incomplete | Capture occurred before client-side content finished rendering. | Wait for a stable result element; increase the navigation timeout only when the page genuinely needs more time. |
| Navigation times out | The target or PSI page did not finish within the timeout. | Check the URL from the same environment, use an appropriate waitUntil value, and capture an error screenshot or log before retrying. |
| Scores differ between runs | PageSpeed analysis and Lighthouse data can change over time, and mobile and desktop are different strategies. | Record the analysis timestamp, target URL, strategy, and response. Avoid comparing runs without those labels. |
| Old code refers to a v4 screenshot path | It copied a deprecated v4 example. | Use the v5 endpoint and current schema, then check Google’s release notes for field changes. |
Performance, reliability, and cost
- Separate analysis from capture. API analysis and browser rendering are independent network-heavy operations. Persist the JSON result before starting a screenshot so a rendering failure does not lose the measurement.
- Reuse a browser for batches. Launching Chromium for every image adds startup work. Keep one browser process and create or close pages per job, while limiting concurrency to the capacity of your machine.
- Use readiness conditions. A selector that represents finished content is usually more reliable than a fixed sleep. Keep timeouts finite and report failures clearly.
- Cache intentionally. If the same URL, strategy, and report timestamp are requested repeatedly, reuse the stored artifact where your freshness requirements allow it.
- Expect schema changes. Lighthouse updates independently of the PageSpeed API version. Read fields defensively and monitor Google’s release notes.
- Budget both services. PageSpeed analysis requests and your own compute for Chromium have separate operational costs. The research sources do not provide a universal runtime benchmark, so measure your workload before setting concurrency or timeout limits.
Or skip the browser setup
ScreenshotNeo provides a website screenshot API. One GET request returns a PNG, JPEG, WebP, or PDF, so you can capture a report URL without managing Chromium. See the ScreenshotNeo documentation for the available options.
cURL
curl -G "https://api.screenshotneo.com/v1/shot" -d access_key=YOUR_API_KEY --data-urlencode url=https://pagespeed.web.dev/ -o shot.webpPython
import requests
r = requests.get("https://api.screenshotneo.com/v1/shot", params={"access_key": "YOUR_API_KEY", "url": "https://pagespeed.web.dev/"}, timeout=90)
open("shot.webp", "wb").write(r.content)
Node.js
const q = new URLSearchParams({ access_key: 'YOUR_API_KEY', url: 'https://pagespeed.web.dev/' }); const res = await fetch(`https://api.screenshotneo.com/v1/shot?${q}`);ScreenshotNeo removes cookie banners, newsletter popups, and chat widgets before the shot. Bot checks, blank pages, failed loads, timeouts, and cache hits are not billed, and each response identifies the result with X-Page-Verdict and X-Billed headers. Its MCP server lets AI agents use take_screenshot, get_page_info, and capture_pdf. The Free plan includes 1,000 screenshots a month with no card; paid plans start at $5 for 3,000 shots.
Create a free ScreenshotNeo account and start with 1,000 screenshots a month at no charge.
FAQ
Does the PageSpeed Insights API return a screenshot?
The current documented v5 response is JSON analysis data and does not list a top-level screenshot field. Use browser automation for an image of the rendered report.

Can I screenshot Lighthouse data without opening PageSpeed Insights?
Yes. Fetch the API JSON, render the metrics in your own HTML, and capture that HTML with Puppeteer.
Which strategy should I use?
Use mobile or desktop according to the experience you are documenting. Record the choice with the image because the results are not interchangeable.
Why does a full-page screenshot differ from the visible browser window?
fullPage: true captures the complete rendered document, while a normal screenshot captures the current viewport.
Where should I look when a Lighthouse field changes?
Check Google’s PageSpeed Insights release notes and handle optional fields defensively in your parser.


