How to Pass Data to a React-Vis Component Rendered by Puppeteer
Pass chart data from Node.js into a mounted React-Vis app with Puppeteer, wait for the chart to update, and capture reliable screenshots or PDFs.
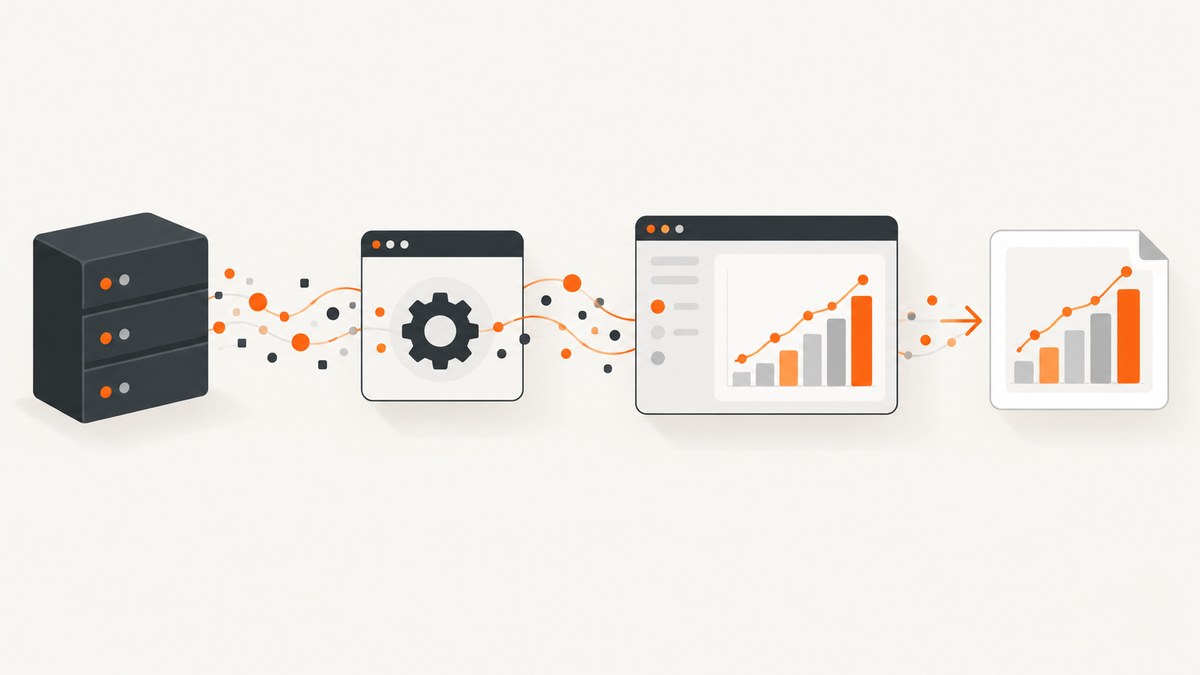
Pass the dataset as an argument to page.evaluate(), then use a page-side function to update the React state or props that feed the React-Vis series. Wait for an application-specific signal that the chart has rendered before calling page.screenshot() or page.pdf(). Node.js variables are not automatically visible in browser JavaScript; the evaluate argument is the explicit bridge.
This is a practical integration pattern for an existing React-Vis application. React-Vis is deprecated: its repository says it has no active maintainers and will receive no patches or new features. Consider that maintenance status before choosing it for a new project. React-Vis deprecation notice.
1. Understand the data path
A reliable capture has three separate steps:
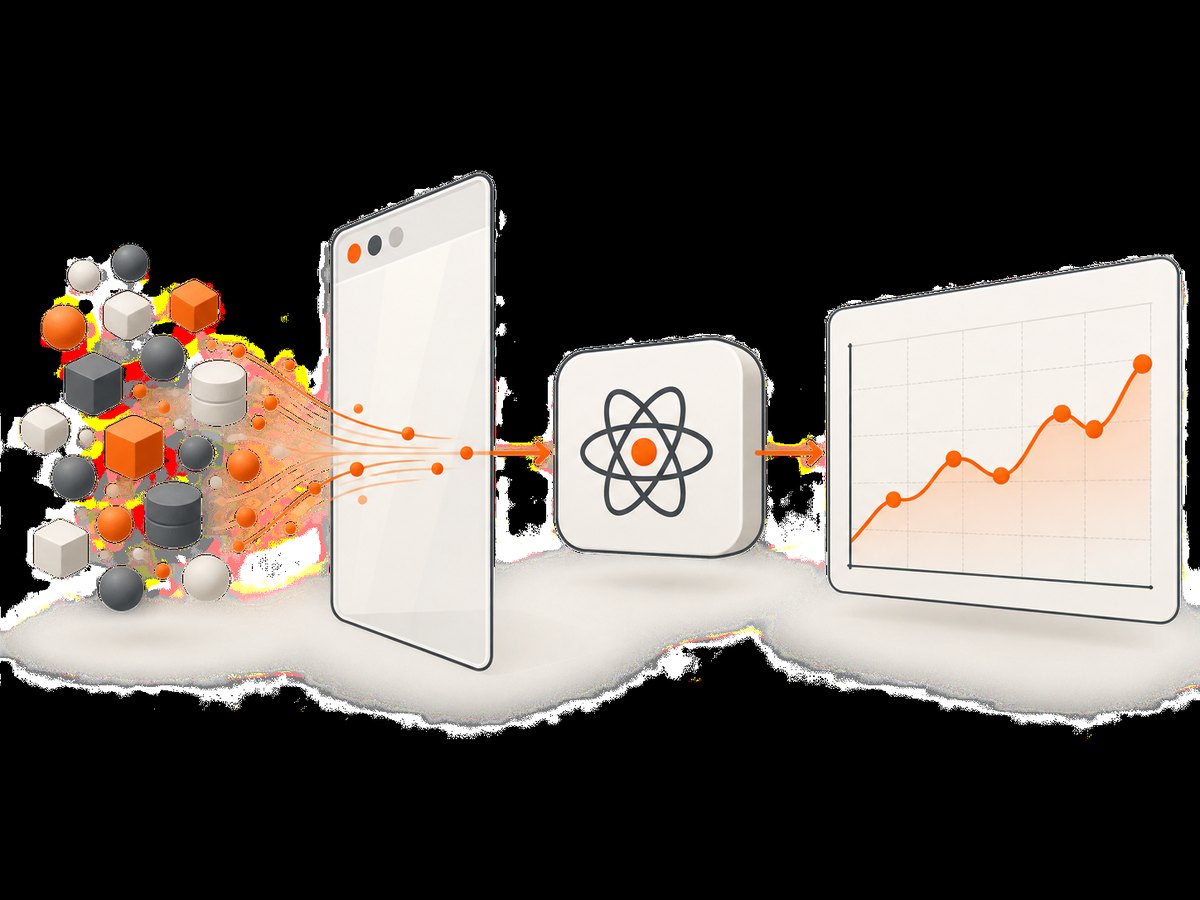
- Prepare data in Node. Make a serializable array, commonly objects with numeric
xandyproperties for a React-Vis series. - Update the mounted app in the page. Expose a page-side function that passes the records through the app’s normal React state or props path.
- Wait and capture. Confirm the app has completed the update, then take the image or PDF.
React-Vis series such as LineSeries receive their records through a data prop. The repository example and scales-and-data documentation show arrays of {x, y} objects. Keep the data in that shape unless your component or data transformation expects something else. React-Vis repository.
2. Add a page-side update function
The exact integration belongs to your app: the browser function should update the React state used by the chart. Here is a complete React example using a stateful class component. It publishes a small bridge after mounting and sets a completion flag from componentDidUpdate, which runs after React has committed the update. Use this only in a trusted page you control; exposing a global update function on an application available to arbitrary visitors may allow unwanted changes.
import React from 'react';
import { XYPlot, XAxis, YAxis, LineSeries } from 'react-vis';
import 'react-vis/dist/style.css';

export class ChartApp extends React.Component {
  state = { rows: [] };

  componentDidMount() {
    window.updateChartData = (rows) => {
      // Validate at the boundary: Puppeteer data is still external input.
      if (!Array.isArray(rows) || !rows.every(
        (point) => Number.isFinite(point.x) && Number.isFinite(point.y)
      )) {
        throw new TypeError('Expected an array of finite {x, y} points');
      }
      window.chartRenderComplete = false;
      this.setState({ rows });
    };
  }

  componentDidUpdate() {
    // The new rows have been committed to React state and rendered.
    window.chartRenderComplete = true;
  }

  render() {
    return (
      <div id="chart-ready">
        <XYPlot width={800} height={450}>
          <XAxis />
          <YAxis />
          <LineSeries data={this.state.rows} />
        </XYPlot>
      </div>
    );
  }
}
Mount ChartApp through the entry point your app already uses. The bridge is application wiring, not a React-Vis or React built-in. For a function component, expose a callback that invokes the state setter; arrange the completion signal after the resulting render, for example in an effect keyed to the data revision. Set the signal false before scheduling the update, and set it true only after the render associated with that update.
3. Send data with Puppeteer and capture
Install Puppeteer in the Node project using its documented installation procedure, then adapt the URL, output path, viewport, and chart selector for the page. The following script assumes the app is already deployed at APP_URL and publishes the bridge above.
import puppeteer from 'puppeteer';

const data = [
  { x: 1, y: 8 },
  { x: 2, y: 13 },
  { x: 3, y: 11 },
];

const browser = await puppeteer.launch({ headless: true });
try {
  const page = await browser.newPage();
  await page.setViewport({ width: 1000, height: 650, deviceScaleFactor: 1 });
  await page.goto('https://your-app.example/chart', {
    waitUntil: 'domcontentloaded',
    timeout: 30000,
  });

  // Wait until the React app has mounted and installed its bridge.
  await page.waitForFunction(
    () => typeof window.updateChartData === 'function',
    { timeout: 15000 },
  );

  // Puppeteer serializes this value across the Node/browser boundary.
  await page.evaluate((rows) => window.updateChartData(rows), data);

  // Wait for the app's explicit signal, not an arbitrary sleep.
  await page.waitForFunction(
    () => window.chartRenderComplete === true,
    { timeout: 15000 },
  );

  await page.locator('#chart-ready').wait();
  await page.screenshot({ path: 'chart.png', fullPage: false });
} finally {
  await browser.close();
}
page.evaluate(pageFunction, ...args) executes the function in the page context and passes the additional arguments to it. Puppeteer waits for a returned promise from the page function to resolve. That promise resolving does not by itself prove the browser has completed a later React render, so the example separately waits for the app’s completion condition. See the Puppeteer evaluate API and waitForFunction API.
4. Choose a completion signal that means something
Use a condition tied to the chart update. A boolean is adequate for a single sequential update; for overlapping or repeated updates, use a monotonically increasing revision so an older render cannot satisfy a newer request.
// Page-side sketch for sequential requests:
window.chartRevision = 0;
window.chartRenderedRevision = 0;
window.updateChartData = (rows) => {
  const revision = ++window.chartRevision;
  window.chartRenderedRevision = revision - 1;
  window.setApplicationChartData(rows, revision);
};

// After React commits the matching rows:
window.chartRenderedRevision = revision;

// Puppeteer side, after updateChartData(rows) returns the revision:
await page.waitForFunction(
  (expected) => window.chartRenderedRevision === expected,
  { timeout: 15000 },
  expectedRevision,
);
The sketch’s setApplicationChartData and render callback are placeholders for your app’s actual state path. Ensure the committed revision corresponds to the data requested. If your component performs additional asynchronous work after React commits, such as loading fonts or images, include that work in the readiness condition too. Network idle is not a chart-ready guarantee: persistent connections may prevent it, and a quiet network can occur before the chart finishes updating.
5. Configure the browser and capture output
Viewport and pixel density
Set the viewport before navigation or before the chart lays itself out. Pick dimensions large enough for axes, labels, and legends. deviceScaleFactor controls pixel density: higher density produces more pixels and larger image files. A full-page screenshot captures the document’s scrollable page; it does not automatically mean the chart itself should be taller. Prefer an element screenshot when only the chart is needed.
Element capture and screenshots
Puppeteer’s locator API waits for an element to be present and in the right state, making it useful for interacting with or selecting a known chart container. A locator screenshot can keep output focused on the chart; a page screenshot includes the viewport or full page depending on options. Check the current Puppeteer page interaction guide and screenshot API for options supported by your installed version.
PDF output
Use page.pdf() for a printable document. Puppeteer uses print CSS media by default, which can change chart dimensions, colors, and visibility compared with screen layout. If the PDF should reflect screen styles, call page.emulateMediaType('screen') before generating it. Set the PDF format or dimensions to suit the report and ensure the chart fits; inspect print-specific CSS for page breaks and hidden elements. See Puppeteer PDF API.
await page.emulateMediaType('screen'); // omit if print styling is intended
await page.pdf({ path: 'chart.pdf', printBackground: true, format: 'A4' });
6. Data shape, serialization, and edge cases
- Use serializable values. Pass plain objects, arrays, strings, numbers, booleans, and null. Functions, DOM nodes, class instances, and process-specific objects are not a substitute for data transfer.
- Validate numbers. Reject
NaN, infinities, missing coordinates, and unexpected nulls before sending. JSON serialization does not preserve all JavaScript values as you might expect; normalize the dataset explicitly. - Handle empty data intentionally. An empty array is valid for many series, but may produce an empty plot. If the capture should show “no data,” render that state in the app and signal completion after it appears.
- Keep dates consistent. If an axis expects dates, agree whether
xis a timestamp, date object transformed before serialization, or another accepted representation. A JavaScript Date crossing a serialization boundary should be normalized deliberately, commonly to an ISO string or numeric timestamp, and converted in the page as needed. - Account for sorting and duplicate coordinates. Decide whether the application sorts rows and how it treats duplicate
xvalues. React-Vis receives the data; it does not know the domain rules you intended. - Large datasets. Avoid repeatedly transferring large arrays when a smaller aggregation or sampling is sufficient for the visual resolution. If data must be large, consider serving it to the page through your application’s normal data endpoint and use the bridge to request an update.
- Concurrent calls. Serialize captures or tag each update with an ID/revision. Otherwise one request can capture another request’s chart state.
- Navigation and reloads. A page navigation replaces the page context and removes its global bridge. Wait for the app to mount again after navigation.
7. Alternative bridge patterns
| Pattern | Use it when | Trade-off |
|---|---|---|
page.evaluate(fn, data) |
You control the mounted page and need a direct one-off update | Requires an exposed page function or page-side app hook |
| Application HTTP endpoint | The app already receives data through an API | Requires request/auth setup and a reliable response-to-render signal |
| Form fields or UI controls | You need to exercise the same flow a user uses | More interactions and validation steps, but verifies the user path |
| Init script or injected bundle | You need a bridge before app startup | More tightly coupled to the app’s bootstrap and React version |
For most controlled chart rendering, the evaluate argument plus an explicit update callback is easy to inspect and avoids embedding dynamic data into an HTML string. Avoid replacing chart markup directly: that bypasses React’s normal reconciliation and can leave the application state inconsistent.
8. Troubleshooting
| Symptom | Likely cause | Fix |
|---|---|---|
window.updateChartData is not a function |
React has not mounted, the bridge is installed only on another route, or navigation replaced the page context | Wait for the app-specific mount condition; confirm the route and bridge installation; reinstall after navigation if needed. |
| Chart remains unchanged | The bridge mutates a shared array, updates the wrong component, or does not call the actual state setter | Pass a new array and route it through the state/props feeding LineSeries; inspect the page’s state update path. |
| Screenshot is blank | Capture ran before the update/render, chart container has zero size, or app failed to load | Wait for the render completion signal, verify nonzero dimensions, and inspect navigation errors and page console output. |
| Wait condition times out | The completion flag is never set, an exception interrupted rendering, or a stale revision is being awaited | Set the flag in the actual committed-render path; log requested and rendered revisions; capture console and page errors. |
| Axes or labels are clipped | Viewport or chart dimensions are too small, or capture targets the wrong element | Increase chart/container dimensions, allow layout to settle, and capture the chart element or an appropriate full-page viewport. |
| PDF differs from screenshot | PDF uses print media styles | Use emulateMediaType('screen') before PDF when screen appearance is wanted, or adjust print CSS for deliberate print output. |
| Different dataset appears in output | Overlapping updates or concurrent captures share one page | Use one page per job or serialize updates and captures; associate each with a revision ID. |
| Browser launch fails in a container | Browser dependencies, executable configuration, or container policy differs from local development | Follow the Puppeteer installation and deployment guidance for the target environment; confirm the browser executable and required system libraries are available. |
9. Performance, reliability, and cost
Rendering cost depends on the page, chart complexity, dataset size, browser startup, fonts, and output dimensions. No benchmark applies to every app. Reuse a browser process for a batch of captures when appropriate, while creating isolated pages or contexts to prevent state leaking between jobs. Close pages and the browser in cleanup paths, as in the example. Set finite navigation and render timeouts and report failures distinctly from successful image output.
Keep screenshots deterministic by controlling viewport, device scale, input data, locale-sensitive formatting, and the app’s completion condition. Use a revision signal instead of fixed sleeps. If the page loads external assets, decide whether their failure should fail the capture or be tolerated; a chart can render while a logo or font is missing. For operational cost, account for browser CPU and memory, capture frequency, image storage, and retries. Do not retry a deterministic bad-data or application error as if it were a transient network failure.
10. Or skip the browser setup
If the input is a URL and the desired result is a screenshot or PDF, ScreenshotNeo is a website screenshot API and MCP server. It takes one GET request and returns an image or PDF. It captures the page as served, so it does not accept an arbitrary Node dataset to inject into a React app; make the chart data available to the target page first.
For a page whose chart is already populated, the one-call request looks like this:
curl -G "https://api.screenshotneo.com/v1/shot" -d access_key=YOUR_API_KEY --data-urlencode url=https://your-app.example/chart -o chart.webpSee the ScreenshotNeo documentation for API options and response details. Cookie banners, popups, and chat widgets are removed before the shot. Bot checks, blank pages, and failed loads are never billed; response headers identify the page verdict and billed status. Its MCP server lets AI agents such as Claude, Cursor, and other MCP clients take screenshots. The Free plan includes 1,000 screenshots per month with no card; paid plans start at $5 for 3,000. Every feature is on every plan.
Sign up for ScreenshotNeo’s free plan to get 1,000 screenshots a month with no card.
11. Frequently asked questions
Can I pass the React component itself from Node to the browser?
No. Pass serializable data and let the already-running page application render its own component. Node and browser JavaScript run in separate contexts.
Does resolving page.evaluate() mean React finished painting?
It means the evaluated function and any returned promise resolved. Use a separate app-specific completion condition for the chart update.
Is React-Vis suitable for a new project?
Its own repository marks it deprecated and says it has no active maintainers. This integration is most appropriate when maintaining an existing React-Vis application.
Should I wait for network idle?
Not as the sole readiness check. Wait for the chart’s own completion signal; network idleness and visual readiness are different conditions.


