Playwright Traces vs. HAR Files: What’s the Difference?
Learn when to use Playwright traces, HAR files, or both for debugging browser tests, network failures, routing, and performance issues.
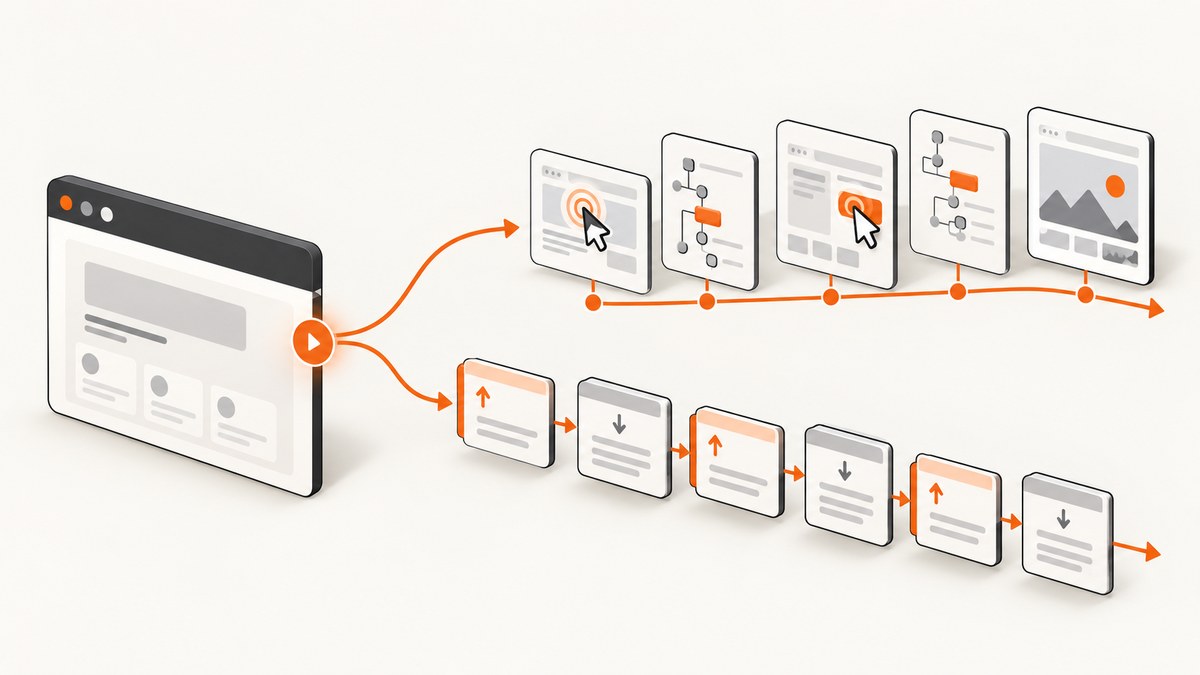
Short answer: use a Playwright trace to understand what a Playwright test did and what the browser showed at each action. Use a HAR file to inspect HTTP requests, responses, headers, content, redirects, caching, and timing. They overlap because both can contain network evidence, but they answer different questions. For a failed UI test, open the trace first. For an API, routing, or latency investigation, start with the HAR. Capture both when the defect crosses the browser and network boundary.
Microsoft describes Trace Viewer as “a GUI tool that helps you explore recorded Playwright traces after the script has run.” The viewer connects locators, actions, source locations, screenshots, DOM snapshots, console output, and network records on a time-ordered timeline. A HAR file follows the W3C archival model for HTTP transactions: each entry records request and response data, content, cache information, and timing phases. Playwright Trace Viewer documentation and the W3C HAR specification define those models.
1. The difference in one table
| Question | Playwright trace | HAR file |
|---|---|---|
| Primary purpose | What did the test do, and what did the browser show at each action? | Which HTTP transactions occurred, what did they contain, and how long did they take? |
| Scope | Actions, locators, source, screenshots, DOM snapshots, console logs, and network context when enabled. | HTTP requests and responses, headers, cookies, content, cache fields, redirects, and timing phases. |
| Best first artifact for a failed UI test | Yes. The action timeline and snapshots show where behavior diverged. | Usually secondary unless a request or response clearly caused the failure. |
| Best first artifact for latency or API debugging | Useful context for the action that triggered the request. | Yes. Request phases and response evidence are its core model. |
| Assertions | Low-level tracing does not record test assertions. Playwright Test tracing provides fuller failure context. | No Playwright assertion model. |
| Replay and routing | Playwright can record HAR data for routing workflows. | Portable HTTP transaction representation. |
2. What a Playwright trace contains
A trace is a Playwright-aware execution record. When you select an action in Trace Viewer, you can inspect the locator used, action duration, source location, snapshots before and after the action, and related console and network records. Screenshots and a film-strip-style view provide visual context; DOM snapshots let you inspect page state without reproducing the failure locally.
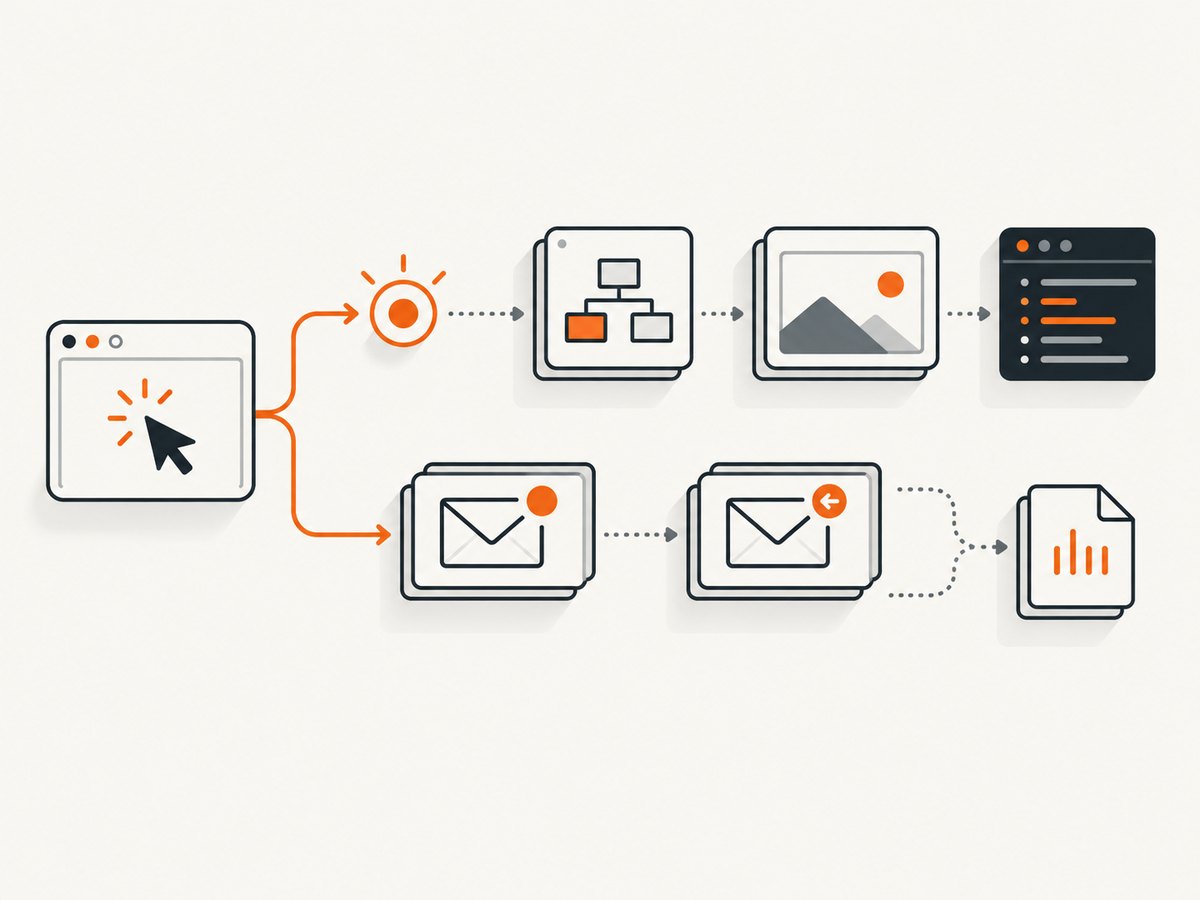
This makes a trace especially useful for locator problems, unexpected navigation, action timeouts, flaky waits, overlays, and CI-only failures. It preserves the relationship between cause and effect: the click, the page state at that moment, and the resulting browser behavior appear together.
The low-level context.tracing API captures browser operations and network activity, but it does not record test assertions. If the important question is why an expect() assertion failed, use Playwright Test tracing or the test runner’s trace-on-first-retry configuration so the assertion and test metadata are included. See the Playwright tracing API.
Start and view a trace with Playwright
import { chromium } from 'playwright';

const browser = await chromium.launch();
const context = await browser.newContext();
await context.tracing.start({ screenshots: true, snapshots: true, sources: true });

const page = await context.newPage();
await page.goto('https://example.com', { waitUntil: 'networkidle' });
await page.getByRole('link', { name: 'More information...' }).click();

await context.tracing.stop({ path: 'trace.zip' });
await browser.close();
Open the resulting ZIP locally with:
npx playwright show-trace trace.zipYou can also open a trace in trace.playwright.dev. The hosted viewer loads the trace entirely in your browser and does not transmit it externally, according to the Playwright documentation. Treat the archive as sensitive anyway: it can contain URLs, source, DOM, screenshots, console output, and network data.
3. What a HAR file contains
HAR is HTTP-oriented and standardized. Its root log object contains an entries array. Each entry represents a tracked HTTP request and can include the request method and URL, headers, cookies, post data, response status and headers, response content, cache details, and timing phases such as blocking, DNS, connection, sending, waiting, receiving, and SSL where available.
Use a HAR when you need evidence that can be consumed by network tooling or shared independently of a particular test framework. Typical questions include:
- Did the request return 401, 403, 404, or 500?
- Was a redirect or cache hit involved?
- Which request header, cookie, or payload was sent?
- Was the delay in DNS, connection setup, server waiting, or response transfer?
- Can the same transactions be routed or replayed in another Playwright run?
Record a HAR with Playwright
import { chromium } from 'playwright';

const browser = await chromium.launch();
const context = await browser.newContext();
await context.routeFromHAR('session.har', { notFound: 'fallback' });

const page = await context.newPage();
await page.goto('https://example.com');

await context.close();
await browser.close();
For capture, use the separate HAR API. The current Playwright documentation labels tracing.startHar as added in version 1.60.
import { chromium } from 'playwright';

const browser = await chromium.launch();
const context = await browser.newContext();
await context.tracing.startHar({
  path: 'network.har',
  content: 'attach',
  mode: 'full'
});

const page = await context.newPage();
await page.goto('https://example.com', { waitUntil: 'networkidle' });
await page.getByRole('link', { name: 'More information...' }).click();

await context.tracing.stopHar();
await browser.close();
The HAR options let you choose how resource content is stored. content: 'omit' excludes bodies, embed places them in the HAR, and attach stores them as files when the path ends in .zip. The mode can be full or minimal. Minimal mode keeps the information needed for routing and omits fields such as sizes, timing, page, cookies, and security data that are not required for replay.
4. Does a Playwright trace include network requests?
Yes, tracing can include network activity and Trace Viewer can show network records related to an action. The network view is context for the browser operation: it helps you connect a click or navigation to requests and responses. It is not a replacement for a complete HAR when you need a portable, HTTP-centered archive with detailed request, response, content, cache, and timing fields.
Think of the two artifacts as different indexes over overlapping events:
- The trace index starts with an action: click, fill, navigation, assertion context, or timeout.
- The HAR index starts with a transaction: URL, method, status, headers, body, cache, and timing.
5. Which should you use for common debugging problems?
Failed click, wrong locator, or action timeout: trace
Open the trace and select the failed action. Check the locator, the before and after DOM snapshots, the action log, and the screenshot or film strip. Look for an overlay, a changed accessible name, a frame boundary, or a page that never reached the expected state.
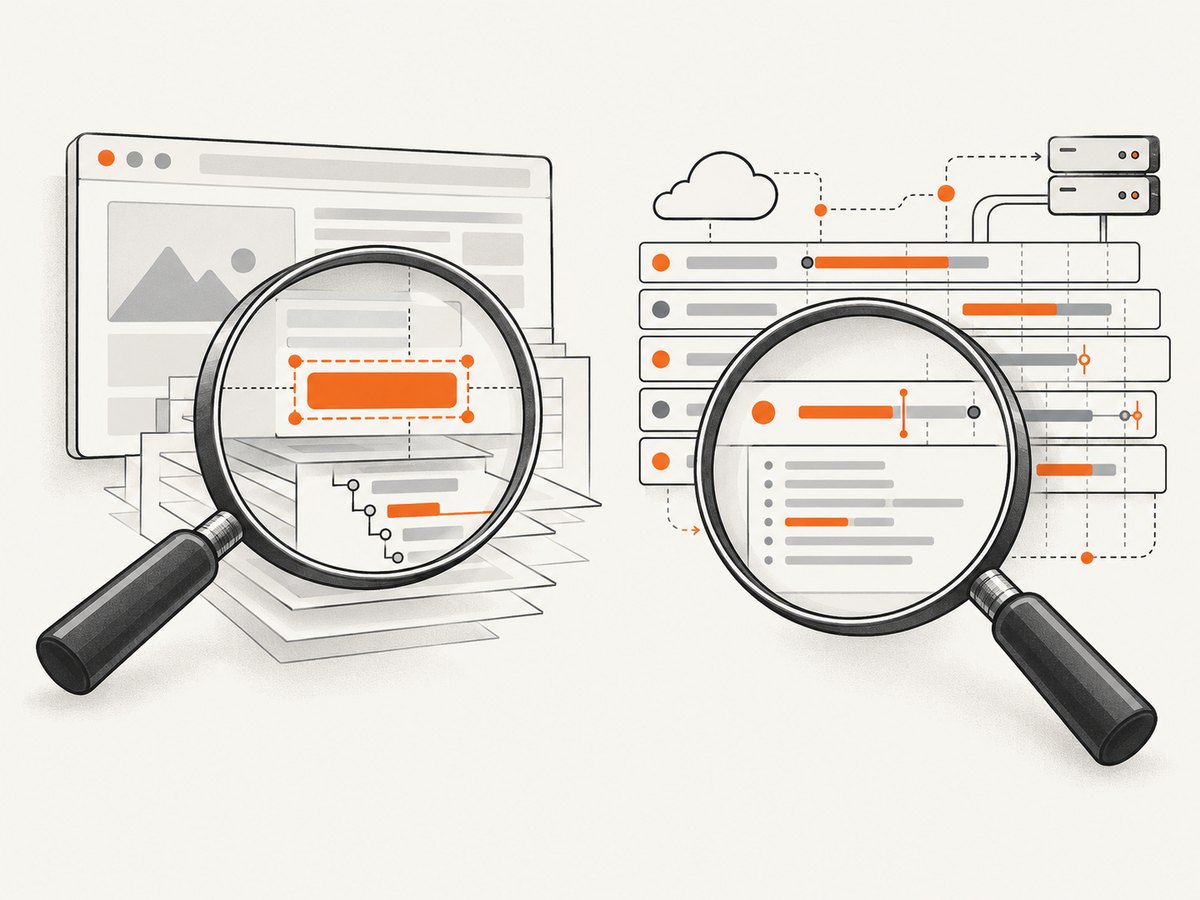
Wrong status code, missing header, or bad response body: HAR
Search the HAR entries for the request URL and inspect the method, request headers, cookies, post data, response status, response headers, and content. Compare a successful and failing HAR to identify the first divergence.
Slow page or intermittent API latency: HAR first, trace second
The HAR timing phases help locate the delay. Use the trace to see which user action initiated the slow request and whether the page displayed a loading state, error, or stale content.
CI-only failure: Playwright Test trace
Configure the test runner to retain a trace on the first retry or on failure. This preserves test metadata and assertion context that low-level tracing does not record. Add a HAR when the failure appears tied to a request, redirect, or backend response.
Network mocking and replay: HAR
Record a HAR, then route a later context from it. Choose full mode when diagnostics require timing and content fields. Choose minimal mode when the objective is routing and a smaller replay artifact is preferable.
6. Capture both when the bug crosses the UI and network boundary
A practical workflow is to start tracing and HAR capture before the scenario, perform the smallest reproduction, stop both artifacts, and inspect them together. The trace answers “which action caused this?” The HAR answers “what exactly was sent and returned?” This combination is useful for login redirects, checkout flows, feature-flag changes, and race conditions where the browser renders an intermediate response.
- Use a fresh browser context so unrelated traffic is excluded.
- Start Playwright tracing with screenshots and snapshots.
- Start HAR capture with
content: 'attach'if response bodies are needed. - Reproduce one failure or one slow transaction.
- Stop both recorders in a
finallyblock so artifacts survive exceptions. - Redact secrets before uploading or sharing either file.
import { chromium } from 'playwright';

const browser = await chromium.launch();
const context = await browser.newContext();
await context.tracing.start({ screenshots: true, snapshots: true, sources: true });
await context.tracing.startHar({ path: 'network.har.zip', content: 'attach', mode: 'full' });

try {
  const page = await context.newPage();
  await page.goto('https://example.com');
  await page.getByRole('button', { name: 'Continue' }).click();
} finally {
  await context.tracing.stopHar();
  await context.tracing.stop({ path: 'trace.zip' });
  await context.close();
  await browser.close();
}
7. Security and data handling
Both artifacts can contain sensitive information. A trace may include screenshots, DOM snapshots, source files, URLs, console output, and network records. A HAR may contain authorization headers, cookies, query parameters, request bodies, and response content. This handling guidance follows from the fields documented by Playwright and the HAR specification.
- Use test accounts and synthetic data when reproducing a problem.
- Remove cookies, authorization headers, tokens, and personal data before sharing.
- Prefer
content: 'omit'when response bodies are unnecessary. - Store artifacts with restricted access and a short retention period.
- Do not commit traces or HAR files containing secrets to source control.
8. Performance, reliability, and storage trade-offs
Screenshots, DOM snapshots, source files, and response bodies increase artifact size and capture overhead. Enable them when they answer the diagnostic question. For a quick network investigation, a HAR with omitted content may be enough. For a visual regression or locator failure, trace screenshots and snapshots are usually worth the additional storage.
Use one focused reproduction instead of recording an entire suite. In CI, retain traces for failures or retries and expire old artifacts. For routing, minimal HAR mode can reduce irrelevant fields. For latency analysis, keep full timing data and avoid stripping the fields needed to compare phases.
Reliability also depends on stopping recorders correctly. Put stop calls in finally, close the context after the files are written, and verify that the artifact exists before publishing it to CI storage. A missing trace or truncated HAR often means the process exited before the stop operation completed.
9. Troubleshooting common errors
| Symptom | Likely cause | Fix |
|---|---|---|
| Trace Viewer says the archive is invalid | The process ended before tracing.stop() finished, or the ZIP was copied while still being written. |
Stop tracing in finally, await the call, then upload the completed file. |
| The trace has actions but no screenshots or DOM snapshots | Tracing started without screenshots: true or snapshots: true. |
Enable the required options before the first page action. |
| An assertion is missing from the trace | Low-level context.tracing does not record assertions. |
Use Playwright Test tracing for assertion-centered failures. |
| HAR contains requests but no response bodies | Content was omitted, or the response was stored externally. | Use content: 'embed', or 'attach' with a ZIP path. |
| HAR replay misses a request | The request is absent, differs in a matching field, or the route is configured to fail on misses. | Record the complete scenario, compare URLs and methods, and use notFound: 'fallback' while diagnosing. |
| Files are unexpectedly huge | Many screenshots, snapshots, source files, or embedded bodies were captured. | Record a smaller scenario, omit content, or attach bodies in a ZIP for selective retention. |
| Shared artifact exposes credentials | Headers, cookies, URLs, or request bodies were recorded. | Use test credentials, redact before sharing, and restrict artifact access. |
10. Or skip the browser setup
If your goal is a clean visual capture rather than browser-test diagnostics, ScreenshotNeo provides a website screenshot API and MCP server. It accepts one GET request and returns PNG, JPEG, WebP, or PDF. Cookie and consent banners, newsletter popups, and chat widgets are removed before capture; bot checks, blank pages, timeouts, failed loads, and cache hits are not billed. Each response identifies the page verdict and billing result with X-Page-Verdict and X-Billed headers. An MCP server provides take_screenshot, get_page_info, and capture_pdf tools for Claude, Cursor, and other MCP clients.
See the ScreenshotNeo API documentation for all options. A direct request:
curl -G "https://api.screenshotneo.com/v1/shot" -d access_key=YOUR_API_KEY --data-urlencode url=https://stripe.com -o shot.webpPython:
import requests
r = requests.get("https://api.screenshotneo.com/v1/shot", params={"access_key": "YOUR_API_KEY", "url": "https://stripe.com"}, timeout=90)
open("shot.webp", "wb").write(r.content)
Node.js:
const q = new URLSearchParams({ access_key: 'YOUR_API_KEY', url: 'https://stripe.com' });
const res = await fetch(`https://api.screenshotneo.com/v1/shot?${q}`);
ScreenshotNeo supports full-page capture with lazy images loaded, element selectors, dark mode, device presets, custom viewports, retina scale, PDF paper and margin controls, custom CSS and JavaScript, clicks, selector or network-idle waits, request blocking, headers, cookies, user agents, authorization, timezone, geolocation, transparent backgrounds, resizing, TTL caching, signed links, asynchronous jobs with signed webhooks, bulk capture of 100 URLs per call, a usage API, and an OpenAPI specification. Every feature is on every plan. The Free plan includes 1,000 screenshots per month with no card; paid plans start at $5 for 3,000.
Create a free ScreenshotNeo account with 1,000 screenshots a month and no card.
11. FAQ
Can a Playwright trace replace a HAR?
No. A trace can provide useful network context, but HAR is the better portable record for HTTP fields, response content, cache data, and timing.
Can a HAR explain why a locator failed?
Usually not. A HAR can show responses that affected the page, but it does not contain the trace’s locator, action, DOM snapshot, or source timeline.
Should I keep full or minimal HAR mode?
Use full mode for diagnostics and timing analysis. Use minimal mode when the HAR is primarily for routing and replay.
Where should I start when a CI test fails?
Open the Playwright Test trace first. Add or inspect a HAR when the trace points to a request, redirect, authentication, or backend response.
How do I choose an artifact for a performance report?
Use HAR for request-phase timings and response evidence. Use the trace to connect those timings to the user action and visible browser state.


