How to Prevent Blurry Chart.js Images in jsPDF
Keep Chart.js labels and lines sharp in jsPDF by rendering enough pixels, sizing the chart correctly, and capturing it after its final resize.

To prevent blurry Chart.js images in jsPDF, render the chart with enough bitmap pixels for its final PDF size, let Chart.js manage the canvas dimensions through a dedicated container, and capture the chart only after it has rendered at its export size. Then place the image in the PDF at a deliberate size without stretching it beyond its available detail.
Canvas display size and canvas bitmap size are different. CSS can make a canvas appear larger, but it cannot add chart detail to a low-resolution bitmap. For export or print output, set Chart.js’s devicePixelRatio deliberately, resize the chart for the intended export dimensions, and inspect the actual PDF. Chart.js recommends higher-resolution rendering for charts converted to bitmaps or printed at higher DPI, but its documentation does not prescribe one universal ratio. Chart.js: Device Pixel Ratio
1. Why Chart.js charts look blurry in PDFs
A chart can look crisp in its browser container and soft in a PDF because its visual size and pixel dimensions are not the same thing. The canvas has a bitmap, measured in pixels, and a displayed size, commonly set in CSS pixels. If a bitmap is later enlarged to fill a larger PDF area, the viewer has to stretch the existing pixels. Lines and labels then look soft or jagged.
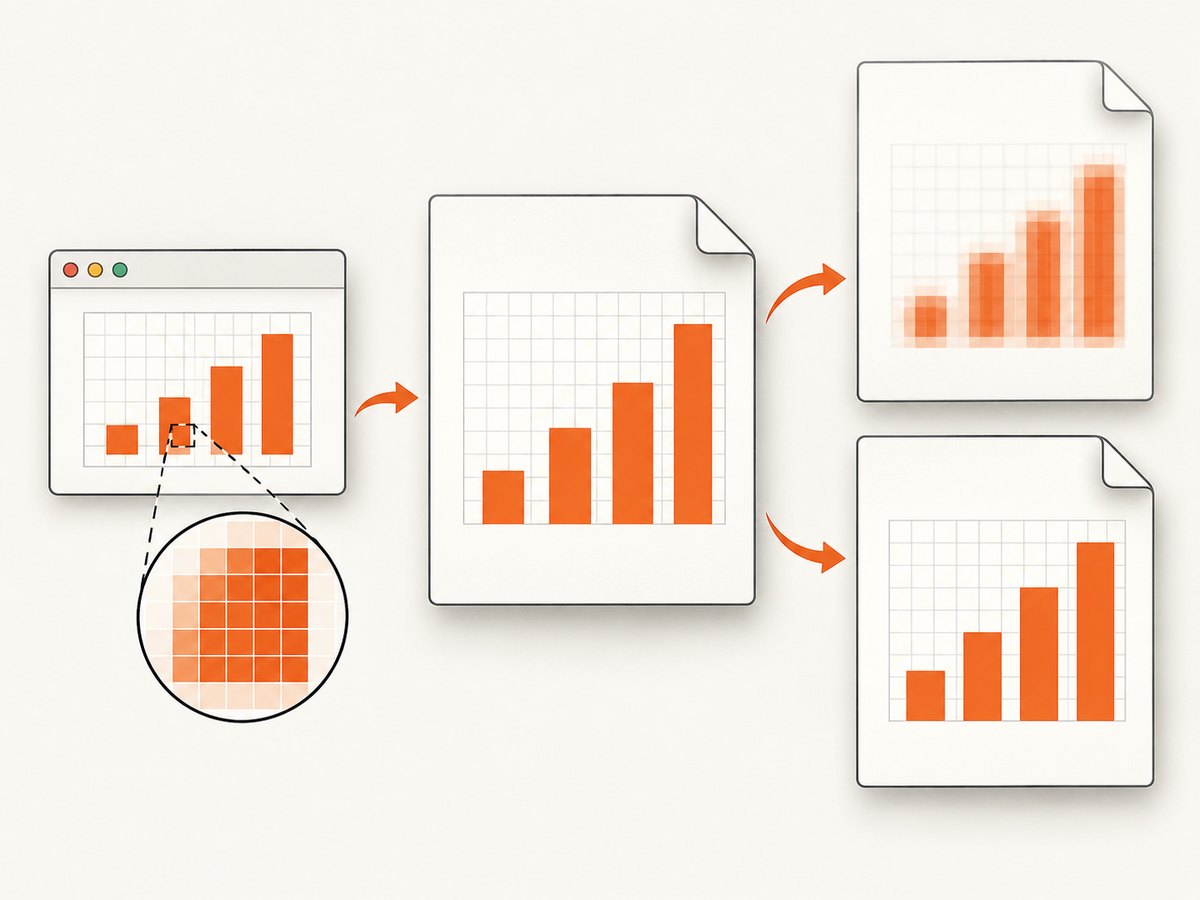
There are four common points where detail is lost:
- The source canvas has too few pixels. A chart rendered at a screen-oriented size may not have enough detail for a large page placement or close zoom.
- CSS changes only the display size. Styling the canvas width and height can stretch its bitmap without asking Chart.js to render additional detail. Chart.js identifies this as invalid responsive sizing that makes the canvas blurry.
- The image is captured before the export render is ready.
toBase64Image()captures the chart’s current state. If that state has not reached the intended dimensions, the image will not reflect them. - The PDF placement dimensions are too large.
addImagetakes explicit placement dimensions. If you place a small bitmap into a large area, the PDF cannot restore missing detail.
Compression can also affect appearance. PNG is a practical starting format when sharp chart labels and lines matter. JPEG quality settings can change compression artifacts, but a higher setting cannot restore pixels that the canvas never rendered.
2. Render the chart at the right size
Use a dedicated responsive container
For responsive charts, give Chart.js a parent container with explicit dimensions and position: relative. Let Chart.js track that container. Avoid relying on CSS width and height applied only to the <canvas> to control its render bitmap. The Chart.js responsive charts guide explains the separate sizing behavior and recommends a dedicated parent container.
<div id="chart-container">
  <canvas id="sales-chart"></canvas>
</div>

<style>
  #chart-container {
    position: relative;
    width: 100%;
    height: 360px;
  }
</style>
With responsive: true and maintainAspectRatio: false, Chart.js can fit the chart to the container’s width and height. The parent controls the chart’s available display space; the Chart.js render settings control how many pixels go into the bitmap.
Choose a deliberate pixel ratio
Chart.js’s devicePixelRatio controls how many canvas pixels are used relative to the chart’s display dimensions. A higher ratio gives the chart more source pixels for zooming or print output. That costs more memory and render time, so choose a value for the actual PDF use rather than increasing it without limit.
The value 3 below is an example to adapt and validate, not an official universal recommendation. Test the PDF at the intended page size and zoom. Chart.js documents the higher-resolution use case and notes that the visual difference is most apparent when zooming or printing. Device Pixel Ratio documentation
3. Complete browser example: Chart.js to jsPDF
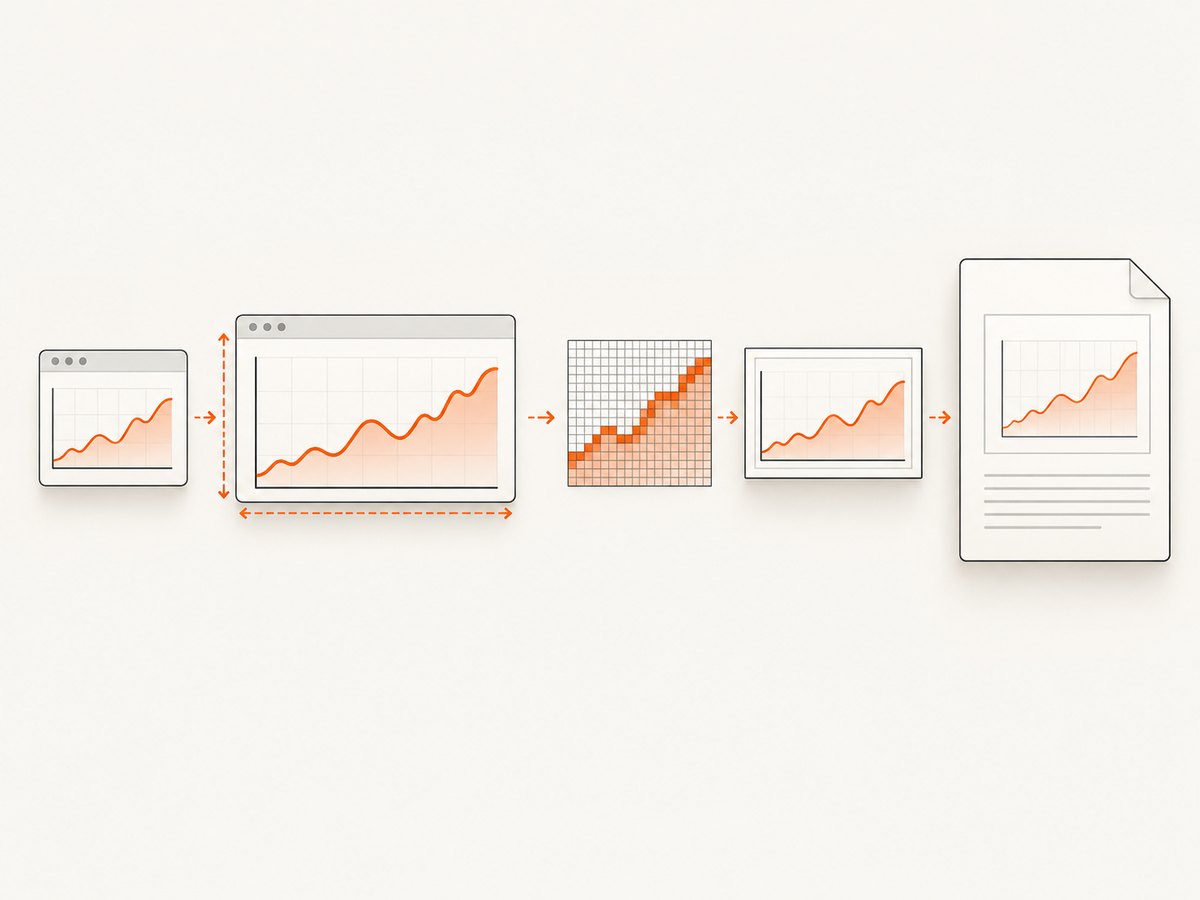
This example creates a responsive chart, asks Chart.js to render at a higher pixel ratio, resizes it for export, captures the resulting PNG, and places that image in a PDF while preserving its aspect ratio. It uses browser script tags for Chart.js and jsPDF; for production, load the versions your application has pinned and use their matching APIs.
<div id="chart-container">
  <canvas id="sales-chart"></canvas>
</div>
<button id="export-pdf">Export PDF</button>

<style>
  #chart-container {
    position: relative;
    width: 100%;
    height: 360px;
  }
</style>

<script src="https://cdn.jsdelivr.net/npm/chart.js"></script>
<script src="https://cdn.jsdelivr.net/npm/jspdf/dist/jspdf.umd.min.js"></script>
<script>
  const ctx = document.getElementById('sales-chart').getContext('2d');

  const chart = new Chart(ctx, {
    type: 'bar',
    data: {
      labels: ['Jan', 'Feb', 'Mar', 'Apr'],
      datasets: [{
        label: 'Orders',
        data: [18, 25, 21, 34],
        backgroundColor: '#3978d4'
      }]
    },
    options: {
      responsive: true,
      maintainAspectRatio: false,
      devicePixelRatio: 3,
      animation: false
    }
  });

  document.getElementById('export-pdf').addEventListener('click', () => {
    // Use the dimensions of the parent container as the chart's export size.
    const container = document.getElementById('chart-container');
    chart.resize(container.clientWidth, container.clientHeight);

    // toBase64Image captures the chart's current state. Capture after resize.
    const imageData = chart.toBase64Image('image/png');

    // jsPDF placement dimensions use the document's units (mm here).
    const { jsPDF } = window.jspdf;
    const doc = new jsPDF({ orientation: 'landscape', unit: 'mm', format: 'a4' });
    const margin = 15;
    const maxWidth = doc.internal.pageSize.getWidth() - margin * 2;
    const maxHeight = doc.internal.pageSize.getHeight() - margin * 2;
    const aspect = chart.width / chart.height;
    let width = maxWidth;
    let height = width / aspect;
    if (height > maxHeight) {
      height = maxHeight;
      width = height * aspect;
    }
    const x = (doc.internal.pageSize.getWidth() - width) / 2;
    const y = (doc.internal.pageSize.getHeight() - height) / 2;

    doc.addImage(imageData, 'PNG', x, y, width, height);
    doc.save('chart-report.pdf');
  });
</script>
In this example, the container’s current size supplies the export dimensions. If a report always needs the chart at a fixed size, set the container to that size before capture or use explicit dimensions appropriate to the report. The important sequence is: establish the desired chart size, let the chart render at that size, then capture its current state.
Chart.js documents resize(width, height) and toBase64Image() in its API. Check the API for the Chart.js version installed in your application, especially if you change the chart lifecycle or export behavior. Chart.js API
4. Match PDF placement to the rendered chart
jsPDF’s addImage accepts image data or a canvas and takes coordinates plus placement width and height. Those dimensions are in the PDF document’s configured unit; the example uses millimeters. Keep the image’s aspect ratio so text and marks are not distorted, and fit it within the area the page can hold.
Think of the ratio between source pixels and physical placement as a quality budget: the more source pixels available for each unit of printed size, the more detail the PDF can show. The dossier’s sources do not establish a single required DPI, so do not treat one pixel-per-inch target as a Chart.js or jsPDF rule. Instead, choose a render ratio and placement size, then inspect the result at the size readers will view or print it.
For example, if the PDF layout forces a chart to occupy more page area, render the chart specifically for that larger export placement before capturing it. If the chart looks good at normal zoom but soft when enlarged, that can reflect the finite bitmap resolution. If it already looks soft at normal size, first check whether it was stretched by CSS or captured before the intended resize.
The jsPDF declarations show support for image data and explicit dimensions; since declarations on its main branch can change, confirm behavior against the version installed in your project. jsPDF type declarations
5. Choose image format and export settings
- PNG: Start here when chart text, grid lines, and edges need to stay crisp and lossless image output matters. It is the format used in the example.
- JPEG: Use when your document needs JPEG output or you need to manage image size with a quality setting. Higher quality can reduce compression artifacts, but it cannot add source detail.
- PDF dimensions: Select coordinates and dimensions that fit the page and preserve aspect ratio. Avoid enlarging a small capture to fill a large PDF region.
- Chart animation: Disable animation for deterministic exports, or wait for the intended animation state before capture. Otherwise an export can represent an earlier state than the user expects.
- Chart complexity: More data and labels may need more layout space as well as more pixels. A larger pixel ratio will not prevent text overlap caused by a chart that is too small.
The format advice here is a practical choice based on chart clarity; the reviewed official API material documents JPEG quality behavior but does not prescribe a universal image format for charts.
6. Troubleshooting blurry or incorrect exports
| Symptom | Likely cause | Fix |
|---|---|---|
| Chart looks sharp in browser, blurry in PDF | PDF placement enlarges a bitmap that has too few pixels. | Increase Chart.js devicePixelRatio, render at the intended export dimensions, or reduce PDF placement size. Inspect at normal print size. |
| Chart is blurry in both browser and PDF | CSS has resized the visible canvas without a matching Chart.js render size. | Set dimensions on a dedicated, relatively positioned parent and let responsive Chart.js sizing manage the canvas. |
| Export has the old or wrong dimensions | Capture happened before the chart’s final resize/render. | Resize first, allow the chart’s update to complete, then call toBase64Image(). Check the chart’s current dimensions. |
| Text or marks look stretched | The PDF placement width and height do not match the source aspect ratio. | Calculate one placement dimension from the other using the chart’s aspect ratio. |
| PNG/JPEG looks unexpectedly soft | JPEG compression or another image conversion step may have reduced detail. | Try PNG for chart text and lines; remove intermediate scaling or screenshot steps; verify the captured bitmap before adding it to the PDF. |
| Higher ratio slows export or uses more memory | A larger bitmap needs more resources to render and encode. | Use only the resolution needed for the PDF placement. Export charts sequentially if simultaneous high-resolution captures strain the page. |
| Chart is clipped or labels disappear | Export dimensions, chart layout, or PDF page bounds are too small. | Increase chart/container space, adjust chart layout, or reduce the placement area while maintaining the aspect ratio. |
addImage does not accept the captured value |
Input type or API assumptions differ from the installed jsPDF version. | Check the installed version’s declarations/docs and pass a supported data URL or canvas with the required format and dimensions. |
Quick diagnostic checklist
- Check the canvas bitmap dimensions, not just its CSS width and height.
- Confirm
devicePixelRatiois set in the Chart.js configuration used for export. - Confirm the chart is resized to its final export size before capture.
- Confirm
toBase64Image()runs after the intended render state is ready. - Check jsPDF’s page unit and placement dimensions, and preserve aspect ratio.
- Inspect the actual PDF at the expected viewing or printing size; avoid judging only from a small preview.
7. Performance, reliability, and cost considerations
Raising devicePixelRatio increases the bitmap dimensions relative to the chart’s display size. Larger bitmaps take more memory and time to render and encode. The right setting depends on chart size, PDF placement, and whether readers will zoom or print; the official materials reviewed do not offer a universal multiplier or benchmark. Validate representative charts in the target browser and PDF workflow.
For consistent captures, control the chart’s final dimensions, disable animation when a fixed state is required, and capture only after resize and render have completed. Keep the format and placement settings explicit. If a chart is generated repeatedly, avoid doing unnecessarily large captures for small placements.
There is no paid service required for the Chart.js-to-jsPDF method shown here. Your application incurs the browser’s rendering and encoding work. If you instead need a screenshot of a website page that contains a chart, a screenshot API can capture the page, but it is a different workflow from exporting the chart canvas directly into a PDF.
8. Or skip the browser setup
If your goal is a screenshot of a web page that contains the chart, ScreenshotNeo can return a page capture with one GET request. It is a website screenshot API and MCP server for developers from ScreenshotNeo; see the API documentation for parameters. This captures a webpage, while the preceding example exports a Chart.js canvas into jsPDF.
curl -G "https://api.screenshotneo.com/v1/shot" \
  -d access_key=YOUR_API_KEY \
  --data-urlencode url=https://stripe.com \
  -o shot.webp
ScreenshotNeo accepts cookie or consent banners as a visitor and removes more than 60 known consent platforms, newsletter popups, and chat widgets before capture; each step can be turned off. Bot checks, blank pages, timeouts, failed loads, and cache hits cost nothing, and response headers say which page verdict and billing status applied. Its MCP server gives AI agents tools to take screenshots, get page information, and capture PDFs. The free plan includes 1,000 shots per month with no card; paid plans start at $5 for 3,000 shots.
Create a free ScreenshotNeo account for 1,000 screenshots a month with no card.
9. Frequently asked questions
Does a higher devicePixelRatio change how the chart looks on screen?
Chart.js says there should be no visible difference in ordinary screen display; the extra detail is most apparent when the image is zoomed or printed. It still increases the bitmap size and rendering work.
Can CSS alone make my exported chart sharper?
No. CSS can change the displayed size, but enlarging a low-pixel canvas does not create detail. Render the chart at the needed size through Chart.js and its container.
Should I use a fixed devicePixelRatio?
Choose it based on the chart’s final PDF size and expected zoom or print use, then inspect the output. The reviewed documentation does not define a universal value.
Does this method export vector graphics?
No. toBase64Image() captures a bitmap image. This method improves the bitmap’s available detail; it does not make the chart vector-based.
Will ScreenshotNeo export my Chart.js canvas into the same PDF?
ScreenshotNeo captures webpages and can capture PDFs, but that is separate from the direct Chart.js canvas-to-jsPDF export shown here. Use the canvas method when you need to place a chart image in an application-generated PDF.


