How to Prevent Highcharts from Being Chopped Across PDF Page Breaks
Stop Highcharts charts being split across PDF pages by choosing the right export path, sizing the chart correctly, and controlling pagination.
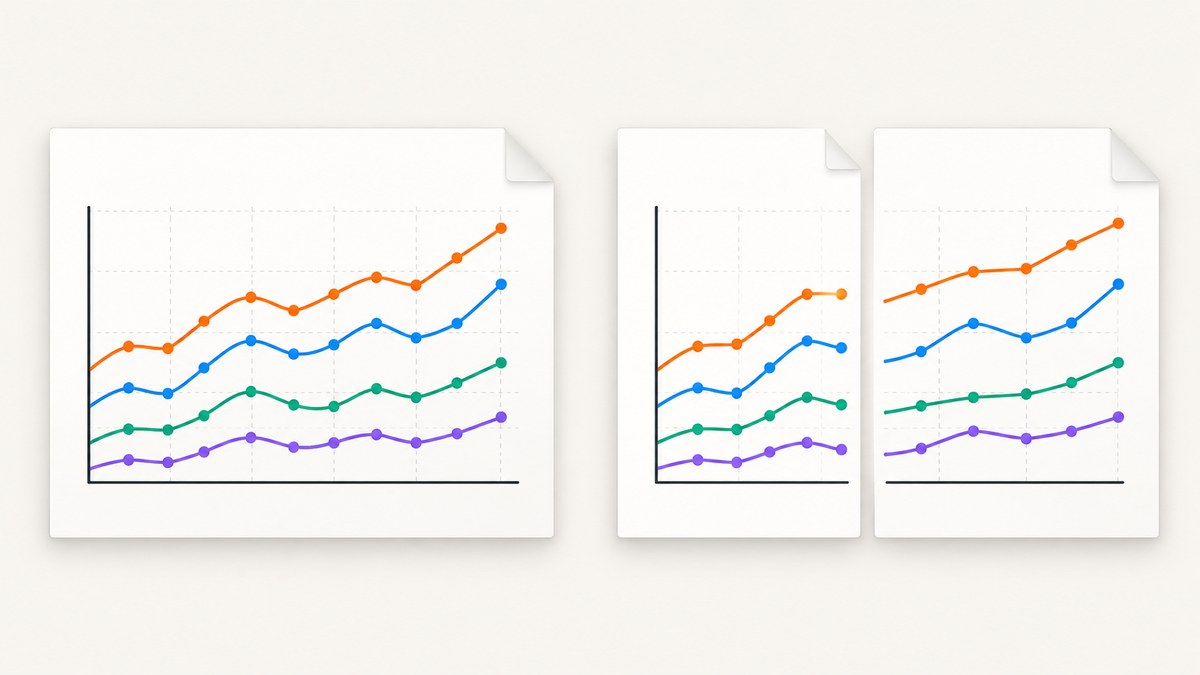
A Highcharts chart is chopped across a PDF page break when the PDF pipeline treats it as ordinary flowing page content. The correct fix depends on whether you are exporting the chart itself, using the chart menu’s print action, printing the whole webpage, or generating a PDF on a server.
There is no universal Highcharts setting that prevents every kind of page split. Start by identifying the export path, then control the chart dimensions or the PDF pagination layer that owns the page break.
1. Identify the PDF path first
Reproduce the exact action that creates the broken file:
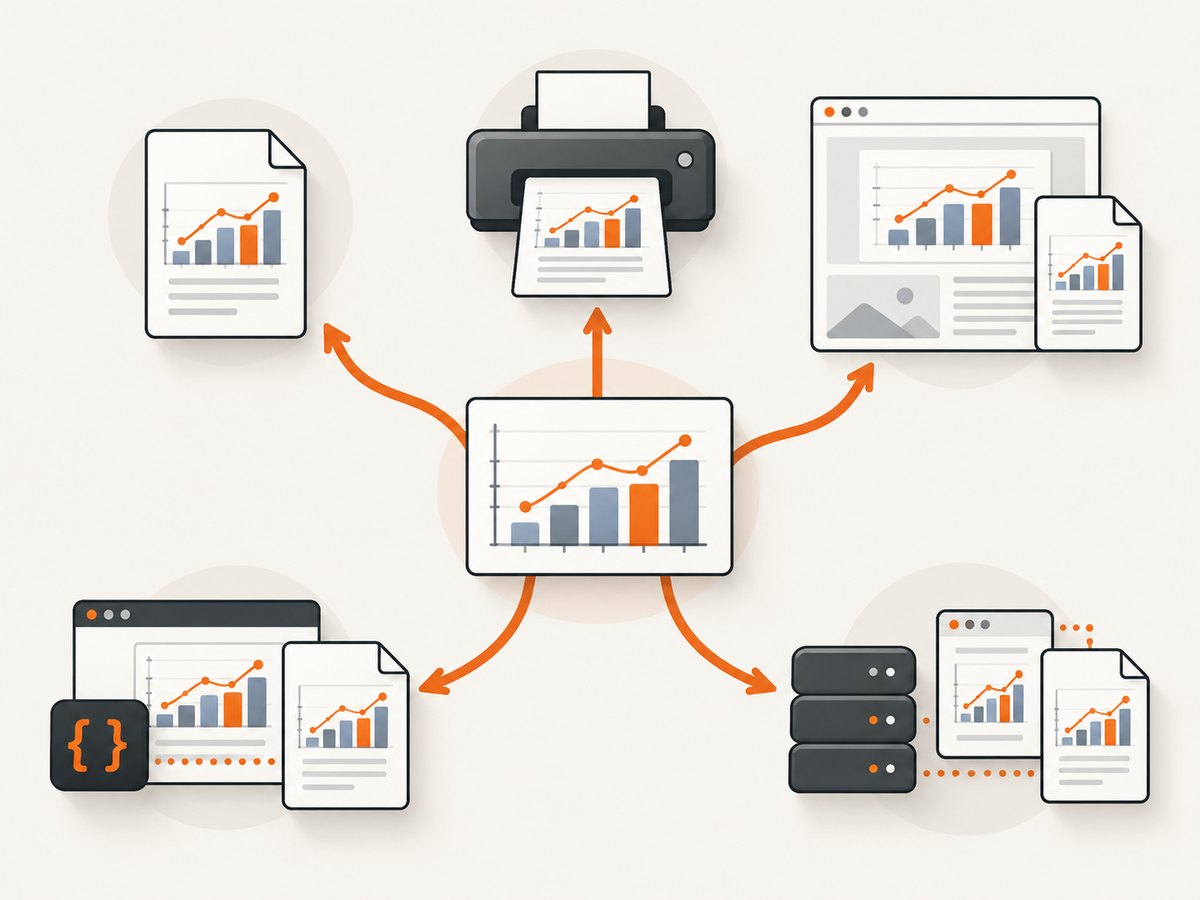
- Chart export: the exporting menu creates a chart image or PDF.
- Chart print: the menu’s print action prepares the chart for browser printing, after which you choose Save as PDF.
- Whole-page browser print: the browser prints the page containing the chart and surrounding content.
- Client-side PDF code: Highcharts and libraries such as jsPDF and svg2pdf create a PDF in the browser.
- Server-side renderer: Puppeteer, Highcharts’ export server, or another renderer prints the page on a server.
Each path has a different pagination owner. A chart-export size setting cannot reliably control a browser’s whole-page page breaks, and a print-only option cannot fix a server renderer’s layout.
2. Size a standalone chart export deliberately
For a standalone chart export, Highcharts resolves the source size in this order:
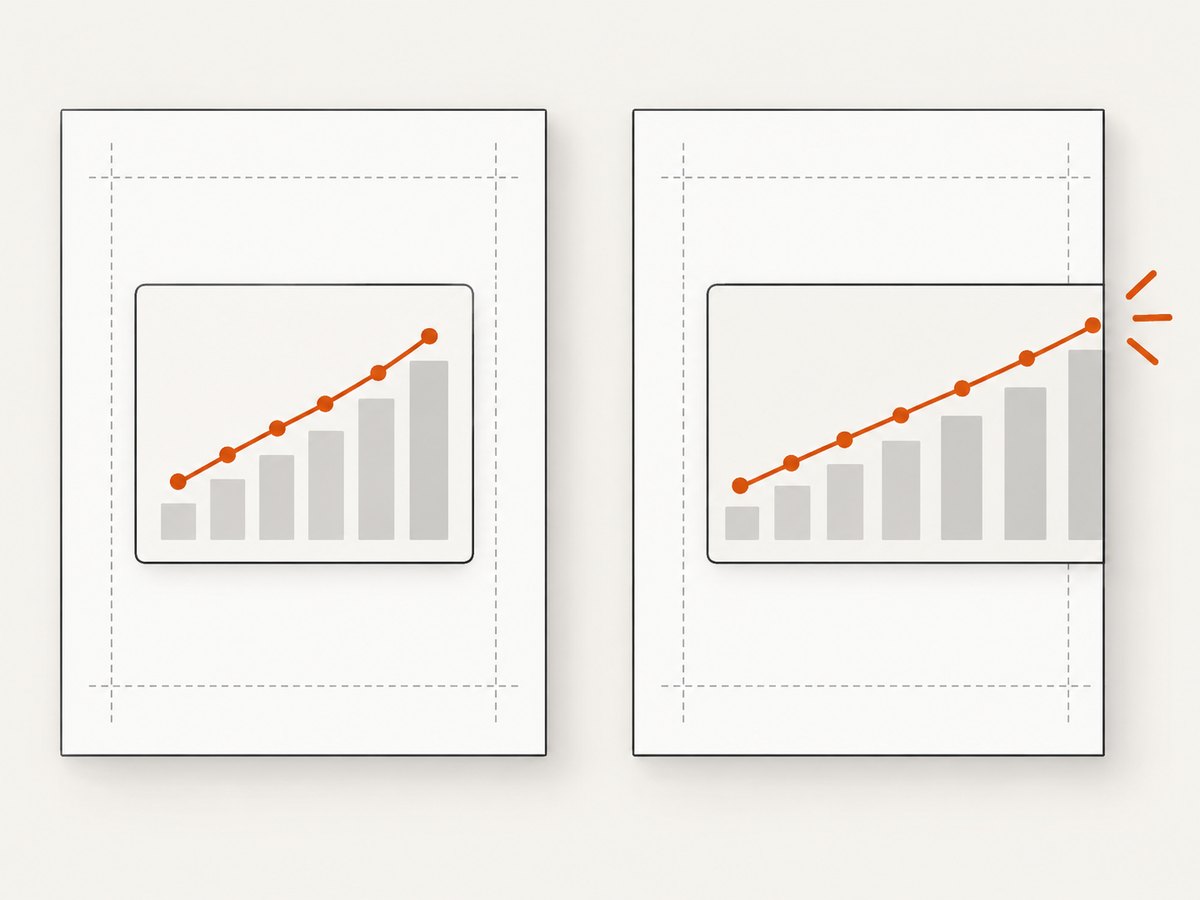
exporting.sourceWidthandexporting.sourceHeight- Explicit
chart.widthandchart.height - Pixel dimensions on the chart container
- The documented default of 600 by 400 pixels
Set the source dimensions to fit the usable area of your target PDF page. Usable width is the paper width minus left and right margins; usable height is the paper height minus top and bottom margins and any heading, legend, or footer placed around the chart. The source dimensions control the chart image size. They are not a general page-pagination switch. See the sourceWidth API reference and sourceHeight API reference.
Highcharts.chart('container', {
  chart: {
    type: 'line',
    width: 720,
    height: 420
  },
  exporting: {
    enabled: true,
    sourceWidth: 720,
    sourceHeight: 420
  },
  title: { text: 'Revenue by quarter' },
  xAxis: { categories: ['Q1', 'Q2', 'Q3', 'Q4'] },
  series: [{
    name: 'Revenue',
    data: [12, 18, 15, 24]
  }]
});
Use a smaller source width when the chart is being placed beside other content. Use a larger source width when the chart contains dense labels and you are placing it on a landscape page. Keep the aspect ratio intentional: shrinking a very wide chart to portrait paper can make labels unreadable even when it technically fits.
3. Use the chart print action correctly
exporting.printMaxWidth is designed for Highcharts’ chart-menu print action. It resizes an overly wide chart for printing. It does not apply when the browser prints the entire webpage. If your PDF contains the complete page, changing this option will not control where the browser inserts page breaks. Read the printMaxWidth API reference.
Highcharts.chart('container', {
  exporting: {
    printMaxWidth: 760
  },
  responsive: {
    rules: [{
      condition: { maxWidth: 760 },
      chartOptions: {
        legend: { enabled: false },
        yAxis: { title: { text: null } }
      }
    }]
  },
  series: [{ name: 'Requests', data: [4, 8, 7, 11, 13] }]
});
Before printing, remove transient controls and make sure the chart has finished rendering. A print stylesheet can keep the chart together when the browser supports the relevant CSS:
@media print {
  .highcharts-container,
  .chart-card {
    break-inside: avoid;
    page-break-inside: avoid;
  }

  .chart-card {
    width: 100%;
  }
}
This is a browser layout hint, not a guarantee. If the chart is taller than the remaining page area, the browser may still move it or split surrounding content. Give the chart a page of its own when it must remain intact.
4. Control pagination in client-side PDF generation
Highcharts’ local PDF workflow is opt-in. The client-side export guide requires offline-exporting.js plus the third-party jsPDF and svg2pdf libraries. When the PDF contains more than the chart, page size, margins, and page insertion belong in your PDF code. Highcharts support guidance describes additional code for custom page sizes and page management; validate that code against the versions installed in your application because the support article was updated in 2019.
const { jsPDF } = window.jspdf;

async function saveChartPdf(chart) {
  const pdf = new jsPDF({
    orientation: 'landscape',
    unit: 'pt',
    format: 'a4'
  });

  const pageWidth = pdf.internal.pageSize.getWidth();
  const pageHeight = pdf.internal.pageSize.getHeight();
  const margin = 36;
  const usableWidth = pageWidth - margin * 2;
  const usableHeight = pageHeight - margin * 2;

  const svg = chart.getSVG({
    exporting: {
      sourceWidth: 1000,
      sourceHeight: 560
    }
  });

  // Convert the SVG with svg2pdf, then place it on a deliberate page.
  await svg2pdf(svg, pdf, {
    xOffset: margin,
    yOffset: margin,
    width: usableWidth,
    height: usableHeight
  });

  pdf.save('chart-report.pdf');
}
The exact conversion call differs between library versions. Treat the example as a layout pattern: create the page, calculate usable dimensions, convert the SVG, and add a new page before placing the next chart. Do not assume that a CSS page-break rule will affect a PDF assembled directly with jsPDF.
5. Keep a whole-page PDF from splitting a chart
For whole-page printing, pagination is controlled by the browser or renderer. Build each chart and its heading inside a block that can move as one unit. Avoid placing a chart inside a flex or grid arrangement that becomes taller than the page. Reserve enough vertical space for the chart before rendering data, legends, and annotations.
<section class="report-chart">
  <h2>Revenue</h2>
  <div id="revenue-chart"></div>
</section>

<style>
@media print {
  .report-chart {
    break-inside: avoid;
    page-break-inside: avoid;
  }

  .report-chart + .report-chart {
    break-before: page;
  }
}
</style>
If a chart still breaks, inspect the generated print preview rather than the screen layout. Check computed width and height, page margins, scaling, headers, footers, and whether a parent has overflow: hidden. A renderer may also wait for fonts, images, or asynchronous data; capture only after the chart’s load event and animations have completed.
6. Server-side rendering with Puppeteer
A server renderer gives you explicit control over paper size, margins, and print backgrounds. The chart itself must still have dimensions that fit the page.
import puppeteer from 'puppeteer';

const browser = await puppeteer.launch({ headless: true });
const page = await browser.newPage();
await page.setViewport({ width: 1200, height: 900, deviceScaleFactor: 1 });
await page.goto('https://your-app.example/report', { waitUntil: 'networkidle0' });
await page.evaluate(() => document.fonts.ready);
await page.waitForSelector('.highcharts-series');
await page.addStyleTag({ content: `
  @media print {
    .report-chart { break-inside: avoid; page-break-inside: avoid; }
  }
` });
await page.pdf({
  path: 'report.pdf',
  format: 'A4',
  landscape: true,
  printBackground: true,
  margin: { top: '36px', right: '36px', bottom: '36px', left: '36px' }
});
await browser.close();
For a Highcharts-controlled server pipeline, the Highcharts export server accepts chart configurations or SVG and uses Puppeteer to render output. Evaluate deployment, version compatibility, and data-handling requirements before adopting it. A server path does not remove the need to size the chart and manage page breaks.
7. Legacy PhantomJS conversions
If an older application still uses a PhantomJS-based converter, investigate its PDF dimension behavior separately. Highcharts’ legacy documentation mentions dpiCorrection for mismatches between page dimensions and rendered output. Do not apply that workaround to current browser, client-side, or Puppeteer exports without reproducing the same legacy path.
8. A diagnostic checklist
- Record the exact action that created the PDF.
- Measure the final chart width and height in pixels.
- Calculate paper size minus margins and surrounding content.
- Set
exporting.sourceWidthandsourceHeightfor standalone exports. - Use
printMaxWidthonly for the chart-menu print action. - For whole-page output, add print CSS and move each chart block as a unit.
- For jsPDF, set page dimensions and place each SVG deliberately.
- For Puppeteer, wait for network idle, fonts, data, and chart rendering.
- Check the installed Highcharts, browser, PDF library, and renderer versions.
9. Troubleshooting common failures
The chart is split even though sourceWidth is set
Cause: the PDF is whole-page printing or the chart is taller than the remaining page area. Fix: move the chart to a new page with print CSS or control placement in the PDF library. Source dimensions size the chart; they do not paginate surrounding HTML.
printMaxWidth has no effect
Cause: the browser is printing the entire page. Fix: use it through the Highcharts chart-menu print action, or adjust the page’s print layout and renderer.
The chart is tiny after fitting
Cause: a wide chart was scaled into a narrow portrait content box. Fix: use landscape paper, reduce surrounding margins, simplify labels, or export the chart on a separate page.
Fonts or labels are missing
Cause: capture started before web fonts or asynchronous data finished loading. Fix: wait for document.fonts.ready, the chart’s data promise, and a visible series before generating the PDF.
Client-side export fails with a library error
Cause: offline-exporting.js, jsPDF, or svg2pdf is absent or incompatible. Fix: load all required libraries in the documented order, pin compatible versions, and inspect the browser console.
Only old deployments have incorrect dimensions
Cause: a PhantomJS-based converter may apply different DPI rules. Fix: confirm that legacy path, then investigate the documented dpiCorrection behavior instead of changing modern export settings.
10. Performance, reliability, and cost considerations
Rendering a chart once and exporting its SVG is usually cheaper than repeatedly printing a full page with large images and unused widgets. Disable animation for deterministic output, reuse a browser instance for batches, and wait only for the resources the report needs. For server rendering, set timeouts and capture logs for failed navigation, missing fonts, and JavaScript errors. For client-side PDFs, large SVGs can consume substantial memory; reduce unnecessary points or split very large reports across pages.
Keep the chart’s data and PDF generation versioned together. A browser update, Highcharts upgrade, or PDF-library change can alter text metrics and page flow. Store a small fixture report and compare its page count, chart bounding box, and label visibility after upgrades.
Or skip the browser setup
If your goal is a clean PDF or screenshot of a report page rather than a custom Highcharts export pipeline, ScreenshotNeo can capture the rendered URL with one request. Cookie and consent banners, newsletter popups, and chat widgets are removed before the shot. Bot checks, blank pages, failed loads, timeouts, and cache hits are not billed, and the response identifies the result with X-Page-Verdict and X-Billed headers. An MCP server lets Claude, Cursor, and other MCP clients call take_screenshot, get_page_info, and capture_pdf.
See the ScreenshotNeo API documentation for all options, including viewport and device presets, full-page capture, custom CSS and JavaScript, waiting for selectors or network idle, blocking resources, headers and cookies, timezone and geolocation, PDF paper size, margins, landscape mode, page ranges, caching, signed links, asynchronous jobs, bulk capture, and usage reporting.
cURL
curl -G "https://api.screenshotneo.com/v1/shot" \
  -d access_key=YOUR_API_KEY \
  --data-urlencode url=https://your-app.example/report \
  -o report.webp
Python
import requests

r = requests.get(
    "https://api.screenshotneo.com/v1/shot",
    params={"access_key": "YOUR_API_KEY", "url": "https://your-app.example/report"},
    timeout=90,
)
r.raise_for_status()
open("report.webp", "wb").write(r.content)
Node.js
const q = new URLSearchParams({
  access_key: 'YOUR_API_KEY',
  url: 'https://your-app.example/report'
});
const res = await fetch(`https://api.screenshotneo.com/v1/shot?${q}`);
if (!res.ok) throw new Error(`Screenshot failed: ${res.status}`);
const buffer = Buffer.from(await res.arrayBuffer());
await import('node:fs/promises').then(fs => fs.writeFile('report.webp', buffer));
ScreenshotNeo includes 1,000 screenshots per month free with no card. Paid plans start at $5 for 3,000 shots, and every feature is available on every plan. Create a free ScreenshotNeo account to try the capture.
FAQ
Can CSS alone guarantee that a Highcharts chart stays on one PDF page?
No. CSS can request that a chart block avoid breaks, but the browser or PDF renderer may move or split content when the block exceeds the available page area.
Should I export a chart image or print the whole report?
Export the chart separately when it must have a predictable size. Print the whole report when surrounding HTML, headings, and tables must share the same document and you can control the renderer’s pagination.
Does changing chart.width fix a page break?
It can fix an oversized standalone chart, but it does not control page breaks in whole-page printing. Set source dimensions and manage pagination in the layer producing the PDF.
Why does the same report differ between local Chrome and CI?
Browser version, installed fonts, device scale factor, timing, and missing network resources can change layout. Pin the renderer and wait for fonts, data, and chart completion before capture.
Is the old dpiCorrection setting required for Puppeteer?
No. It belongs to legacy PhantomJS guidance. Confirm the actual renderer before applying a legacy workaround.