How to Prevent html2canvas From Duplicating Google Charts Text When Cropping
Fix duplicated Google Charts text in html2canvas captures by separating crop settings from rendering and exporting a chart PNG when supported.

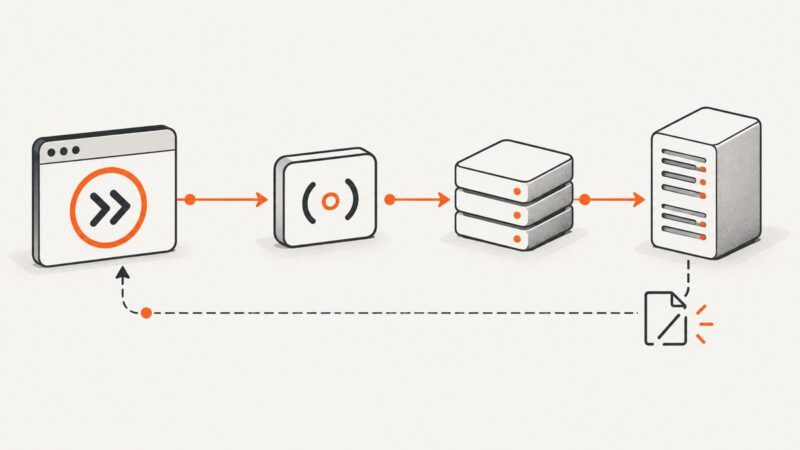
When html2canvas captures a Google Chart, a title or label can appear twice. Changing x, y, width, or height changes the captured region, but it does not repair text duplicated during rendering. The reliable path for supported Google visualizations is to wait for the chart’s ready event, call getImageURI(), and capture the resulting PNG instead of asking html2canvas to reconstruct the chart’s SVG and text.
This guide explains why the symptom occurs, provides runnable code, shows how to crop after the chart is rendered correctly, and covers cases where Google’s image export is unavailable. It also includes an API option when you do not want to maintain a browser capture stack.
What is actually being duplicated?
Google Charts use HTML5 and SVG technology. html2canvas does not save the browser’s native screenshot; it builds a new canvas from DOM nodes and supported style information. During that reconstruction, SVG text and chart layout can be processed differently from the browser’s final paint, which makes a duplicated title or label possible. The available documentation does not prove one universal root cause for every chart, browser, or html2canvas version.
The important distinction is between rendering and cropping:
| Setting or method | What it controls | Can it fix duplicated text? |
|---|---|---|
x, y |
The source coordinates copied into the output canvas | No. They only select a region. |
width, height |
The output canvas dimensions and capture size | No. They can hide part of a duplicate, but do not fix rendering. |
Google getImageURI() |
Exports a chart as a PNG data URI after it is ready | Yes, for supported core charts and geocharts, because the chart becomes an image before capture. |
| Old parser patch | Changes html2canvas internals | It was a historical workaround for an early alpha release, not a current general fix. |
Recommended fix: export the chart after ready
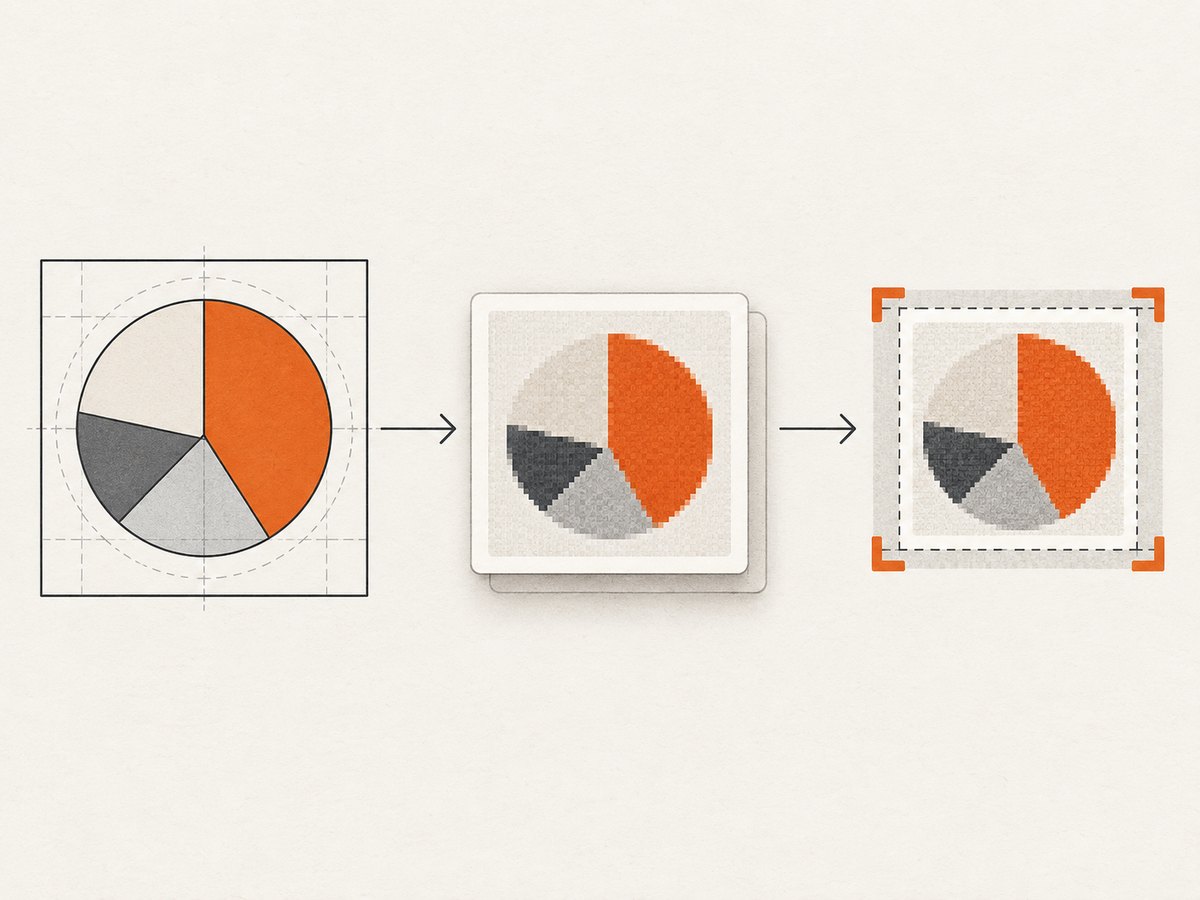
Google’s documented printing flow registers a listener before calling draw(). Once the ready event fires, getImageURI() returns a PNG data URI for supported core charts and geocharts. Replace the chart container’s SVG content with an image, then let html2canvas crop that image.
Complete browser example
<!doctype html>
<html>
<head>
  <meta charset="utf-8">
  <title>Google Chart capture</title>
  <script src="https://www.gstatic.com/charts/loader.js"></script>
  <script src="https://cdn.jsdelivr.net/npm/html2canvas@1.4.1/dist/html2canvas.min.js"></script>
  <style>
    #chart { width: 900px; height: 500px; }
  </style>
</head>
<body>
  <div id="chart"></div>
  <button id="save" disabled>Save crop</button>

  <script>
    google.charts.load('current', { packages: ['corechart'] });
    google.charts.setOnLoadCallback(drawChart);

    let chartReady = false;

    function drawChart() {
      const data = google.visualization.arrayToDataTable([
        ['Month', 'Revenue'],
        ['Jan', 120], ['Feb', 180], ['Mar', 160],
        ['Apr', 230], ['May', 260]
      ]);
      const chart = new google.visualization.LineChart(
        document.getElementById('chart')
      );

      google.visualization.events.addListener(chart, 'ready', () => {
        const pngDataUrl = chart.getImageURI();
        const image = new Image();
        image.alt = 'Revenue chart';
        image.onload = () => {
          const container = document.getElementById('chart');
          container.replaceChildren(image);
          chartReady = true;
          document.getElementById('save').disabled = false;
        };
        image.onerror = () => console.error('Chart PNG could not be loaded');
        image.src = pngDataUrl;
      });

      chart.draw(data, {
        title: 'Monthly revenue',
        legend: { position: 'bottom' },
        width: 900,
        height: 500
      });
    }

    document.getElementById('save').addEventListener('click', async () => {
      if (!chartReady) return;
      const canvas = await html2canvas(document.getElementById('chart'), {
        x: 40,
        y: 20,
        width: 820,
        height: 430,
        scale: window.devicePixelRatio,
        backgroundColor: '#ffffff'
      });
      const link = document.createElement('a');
      link.download = 'chart-crop.png';
      link.href = canvas.toDataURL('image/png');
      link.click();
    });
  </script>
</body>
</html>
The listener is registered before draw(), so the export runs at the documented point in the chart lifecycle. The image’s onload handler prevents html2canvas from running before the PNG has decoded.
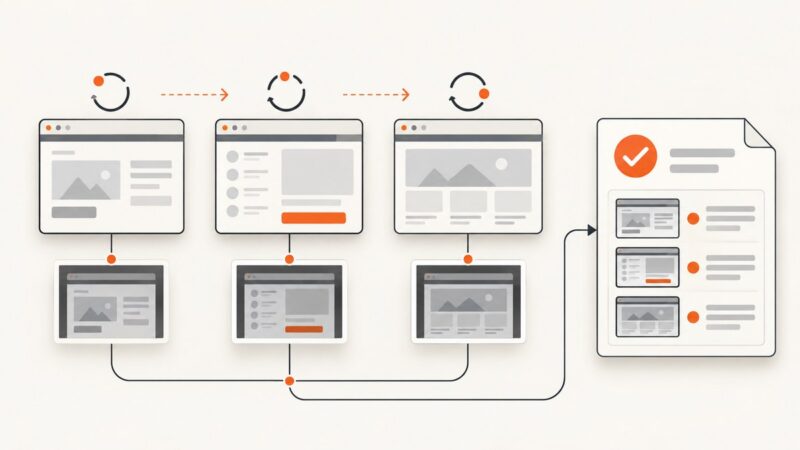
Crop only after the full chart is clean
- Temporarily remove all custom crop options and capture the entire chart.
- Inspect the result for duplicated titles, axes, and labels.
- Once the full image is correct, add
x,y,width, andheightto frame the desired region. - Keep the crop rectangle inside the chart’s rendered dimensions. Negative coordinates or a rectangle larger than the element can produce clipped or blank output.
html2canvas options that matter for this issue
html2canvas has many configuration properties, but only a few affect this workflow directly. The project’s configuration reference documents the complete list.
| Option | Use | Practical note |
|---|---|---|
x, y |
Crop origin | Measure relative to the element being rendered. |
width, height |
Crop output size | Do not use them as a workaround for duplicate text. |
scale |
Output pixel density | Use window.devicePixelRatio for a sharper display image; large values increase memory use. |
backgroundColor |
Canvas background | Set an explicit color when transparent output is not desired. |
useCORS |
Attempt cross-origin image loading | The remote image must send suitable CORS headers. |
allowTaint |
Permit tainted images | A tainted canvas cannot be exported with toDataURL(); use only when you accept that limitation. |
onclone |
Modify the cloned document before rendering | Useful for hiding controls, but avoid changing chart SVG text unless you have a tested reason. |
foreignObjectRendering |
Try browser foreignObject rendering | Results vary by browser and can introduce new compatibility issues. |
For the historical duplication symptom, start with the default renderer and a full capture. Changing renderer flags before isolating the chart can make diagnosis harder.
When getImageURI() is unavailable
Google documents this export API for core charts and geocharts. It is not a promise that every visualization package, plugin, or custom chart supports it. If your chart type does not expose the method, use a controlled reproduction:
- Record the html2canvas version, Google Charts loader version, visualization type, browser version, and chart dimensions.
- Capture the chart without cropping.
- Compare the browser’s normal rendering with the html2canvas output.
- Replace the chart temporarily with a static PNG. If duplication disappears, the problem is in the SVG or DOM reconstruction path.
- Try a current html2canvas release in a separate reproduction. Do not assume behavior from an old alpha build applies today.
If the chart must remain interactive, keep the original chart visible and place the exported image in a separate capture-only container. This avoids replacing the live chart for users while giving html2canvas a stable bitmap.
Historical parser workaround: why it should not be your first move
A 2015 Stack Overflow report described a duplicated Google Chart title during html2canvas cropping. The accepted answer in 2016 suggested replacing NodeParser.prototype.getChildren in an early 0.5.0-alpha1-era source tree and warned that the change could have side effects. That report is useful historical evidence, but it does not establish a current bug or a safe production patch.
Internal parser modifications can affect unrelated elements, text nodes, pseudo-elements, and layout. If you must evaluate one, pin the exact library version, add regression captures for every chart type on the page, and verify exports in every supported browser. Prefer a supported chart image export or a reproduction-tested upgrade.
Common errors and fixes
| Symptom | Likely cause | Fix |
|---|---|---|
getImageURI is not a function |
The visualization type does not support the API, or the chart instance is not the expected type. | Check the chart package documentation and use a supported export or a static image fallback. |
| PNG is blank | getImageURI() ran before ready, or the image was captured before it loaded. |
Register the listener before draw(); wait for the image’s onload. |
| Title still appears twice | The original SVG is still in the capture container, or another overlay contains the title. | Inspect the DOM after replacement, call replaceChildren(image), and capture the image-only container. |
| Top or left edge is cut off | Crop coordinates are measured from the wrong origin or account for a different device scale. | Capture the full element, measure its bounding rectangle, then calculate the crop in CSS pixels. |
SecurityError: Tainted canvases may not be exported |
A cross-origin image lacks CORS permission. | Serve the asset with CORS headers, proxy it from your origin, or avoid exporting that canvas. |
| Fonts or labels move between captures | Web fonts or chart layout were not ready. | Wait for chart ready and, where needed, document.fonts.ready before capture. |
| Browser tab becomes unresponsive | Very large dimensions, high scale, or many simultaneous canvases. |
Capture smaller regions, lower the scale, release canvases promptly, and process jobs sequentially. |
| Different browsers produce different text | html2canvas depends on browser-supported CSS and rendering behavior. | Define a supported browser matrix and compare against a reference PNG in CI. |
Performance and reliability checklist
- Render one chart at a time when pages contain many visualizations.
- Use the smallest crop rectangle that meets your output requirement.
- Keep
scaleproportional to the final display size; doubling both dimensions roughly quadruples pixel memory. - Wait for chart readiness, image decoding, and required fonts before starting html2canvas.
- Use deterministic chart dimensions instead of values that depend on a late layout reflow.
- Store the html2canvas and Google loader versions so a dependency update can be correlated with visual changes.
- For automated jobs, retry transient page-load failures, but do not retry a deterministic unsupported chart type indefinitely.
- Compare a full-chart reference capture before validating cropped output; this separates rendering regressions from coordinate mistakes.
Or skip the browser setup
If your goal is a clean screenshot of a page containing a Google Chart, ScreenshotNeo can handle the browser session and return an image or PDF. The API accepts a URL and supports full-page capture, element selection, custom JavaScript and CSS, waits, device presets, retina scale, headers, cookies, user agents, geolocation, caching, and more. Read the parameter reference in the ScreenshotNeo documentation.

curl -G "https://api.screenshotneo.com/v1/shot" -d access_key=YOUR_API_KEY --data-urlencode url=https://stripe.com -o shot.webpimport requests
r = requests.get("https://api.screenshotneo.com/v1/shot", params={"access_key": "YOUR_API_KEY", "url": "https://stripe.com"}, timeout=90)
open("shot.webp", "wb").write(r.content)const q = new URLSearchParams({ access_key: 'YOUR_API_KEY', url: 'https://stripe.com' });
const res = await fetch(`https://api.screenshotneo.com/v1/shot?${q}`);ScreenshotNeo accepts cookie and consent banners as a visitor and removes more than 60 known consent platforms, newsletter popups, and chat widgets before capture; each step can be turned off. Bot checks, blank pages, timeouts, failed loads, and cache hits cost nothing, and the response reports the result in X-Page-Verdict and X-Billed headers. Its MCP server provides take_screenshot, get_page_info, and capture_pdf tools for Claude, Cursor, and other MCP clients. The Free plan includes 1,000 screenshots per month without a card; paid plans start at $5 for 3,000 shots.
Create a free ScreenshotNeo account to try the capture API with 1,000 screenshots each month and no card.
Cost and service design considerations
Running html2canvas yourself has no per-capture API charge, but you own browser compatibility, page readiness, cross-origin assets, memory limits, and queueing. A hosted capture API trades browser maintenance for request pricing and operational controls. ScreenshotNeo bills only clean shots; failed loads and cache hits are not billed, which can matter when pages contain bot checks or intermittent resources. Choose a cache TTL when repeated captures can use the same result, and use async jobs with signed webhooks for long-running or bulk work.
FAQ
Does cropping itself duplicate Google Chart text?
No. Crop coordinates select the source region and output dimensions. Duplication happens earlier, during rendering or reconstruction.
Should I call getImageURI() before or after draw()?
Register the ready listener before draw(), then call getImageURI() inside that callback.
Will this work for every Google visualization?
No. Google’s documented PNG export covers core charts and geocharts. Verify support for the exact visualization type you use.
Can I keep the chart interactive?
Yes. Keep the live chart in the user-facing container and use a separate, image-only clone for capture.
Is the old NodeParser patch safe?
It was an early-version workaround with acknowledged side-effect risk. Treat it as historical evidence and test any internal change against your complete page.