Profiling and Improving Browser Automation Performance
Find slow browser tests with traces, stable waits, isolation, and measured concurrency. Includes Playwright workflows and a hosted screenshot path.
Browser automation feels slow for several different reasons: browser startup, page navigation and third-party requests, locator waits, backend work, retries, and teardown. Treating the whole run as one number hides the fix. The reliable approach is to capture evidence from representative runs, localize the slow action, then change one variable at a time.
1. Establish a useful baseline
Run the same scenario repeatedly in a controlled CI image. Record the median and a tail value such as p95, plus browser and version, operating system, worker count, retries, shard count, and whether tracing was enabled. Classify elapsed time into browser and context startup; navigation, DNS/TLS, API calls, and third-party resources; locator resolution and actionability waits; application backend work; assertions, retries, and hooks; and teardown, artifact upload, and report generation.
Do not call a functional WebDriver run a page-performance benchmark. Selenium documents that performance testing with Selenium and WebDriver is generally not advised because startup, HTTP servers, third-party CSS and JavaScript, and WebDriver instrumentation add uncontrolled variation. Use a dedicated performance tool and a controlled environment for page-performance claims.
A small timing wrapper
import { test } from '@playwright/test';

test('checkout baseline', async ({ page }) => {
  const started = performance.now();
  await page.goto('https://example.test/checkout', { waitUntil: 'domcontentloaded' });
  await page.getByRole('button', { name: 'Review order' }).click();
  await page.getByRole('heading', { name: 'Order review' }).waitFor();
  console.log(JSON.stringify({ test: 'checkout baseline', elapsedMs: Math.round(performance.now() - started) }));
});
Repeat this in CI rather than relying on one laptop run. Keep the scenario and data stable, and save raw durations so a later optimization can be compared with the same method.
2. Use traces to find the slow action
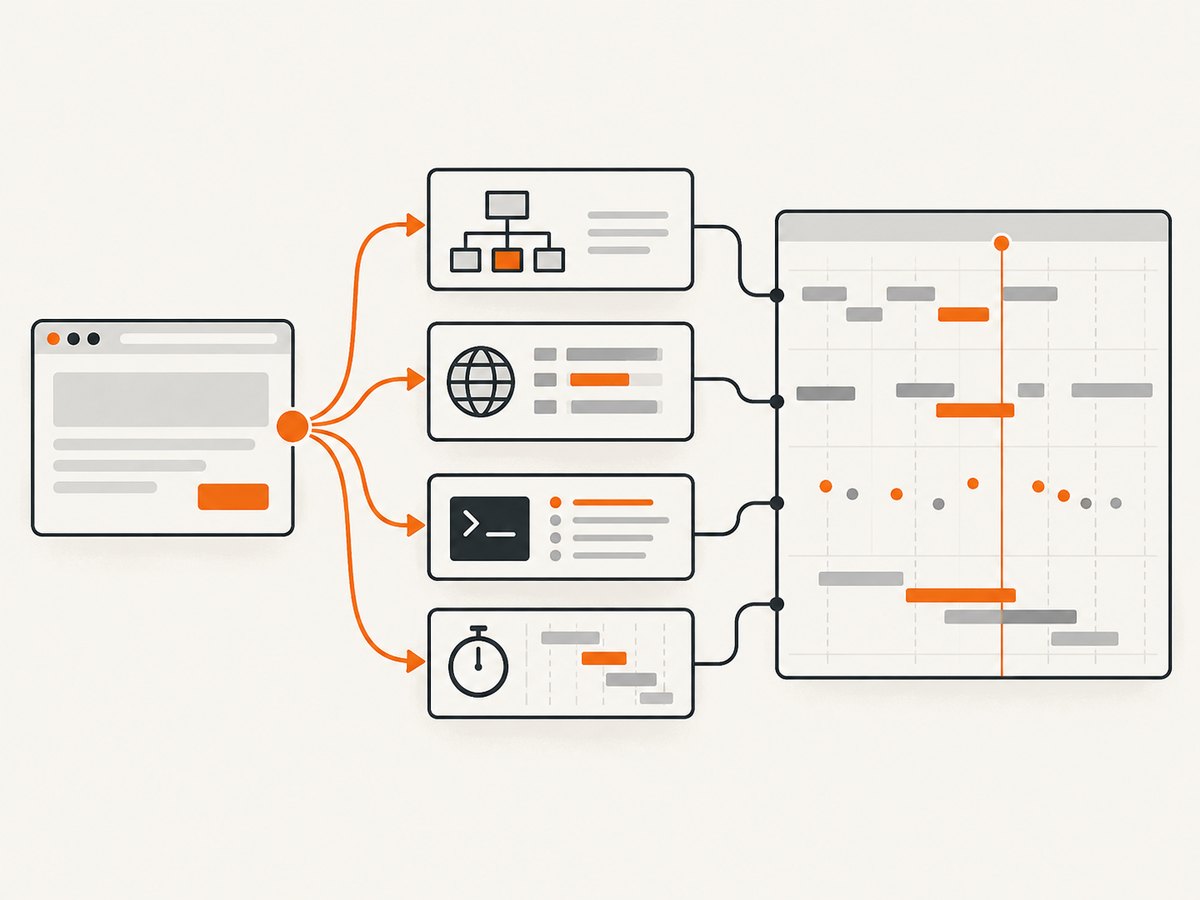
Playwright Trace Viewer combines a timeline with DOM snapshots, network requests, action details, console messages, and source context. That makes a trace the fastest way to localize a slow step. Playwright recommends collecting traces on the first retry in CI because tracing every test has substantial overhead.
// playwright.config.ts
import { defineConfig } from '@playwright/test';
export default defineConfig({ retries: process.env.CI ? 2 : 0, use: { trace: 'on-first-retry' } });
npx playwright test tests/checkout.spec.ts --trace on
npx playwright show-trace test-results/**/trace.zipIn the viewer, inspect the longest action and correlate it with the network waterfall, DOM snapshot, console output, and source line. A long click often means the target was not actionable yet; a long navigation can be backend or third-party latency; a gap after the last assertion may be teardown or artifact handling.
Interactive diagnostics
For a locally reproducible case, use the Inspector and Chrome DevTools integration. Playwright’s verbose API logging shows locator resolution, visibility and stability checks, pending actions, and other activity:
DEBUG=pw:api npx playwright test tests/checkout.spec.ts --headed --workers=1Pause at the suspected step with await page.pause(), inspect the DOM and network panel, and remove the pause before committing. Keep diagnostics focused on the slow test so logs and traces do not become the new bottleneck.
3. Fix synchronization and selectors
Most avoidable slowness comes from waiting on the wrong condition. Prefer user-facing, resilient locators such as roles, labels, and stable test IDs. Use web-first assertions, which wait and retry, instead of a manual read that checks once.
await expect(page.getByRole('status')).toHaveText('Saved');

// Avoid arbitrary sleeps and one-time reads
await page.waitForTimeout(2000);
Replace fixed sleeps with a condition that represents readiness: a response, a visible heading, an enabled button, or a stable application state. Set a deliberate timeout for genuinely slow operations rather than raising every timeout globally. A selector that matches many nodes can cause repeated retries; tighten it with a role, name, or scope.
4. Control state and isolation
Playwright workers use isolated BrowserContexts, but backend records, files, accounts, queues, and external services can still be shared. Races look like random slowness because one test waits for another test’s data or retries after a conflict.
- Generate a unique user, order, or database key per test or worker.
- Use a worker-specific temporary directory for downloads and screenshots.
- Do not reuse mutable accounts across parallel tests unless the application guarantees isolation.
- Stub unstable third-party systems when the test is about your own UI.
- Reset state through an API or fixture instead of a long UI cleanup chain.
import { test as base } from '@playwright/test';
export const test = base.extend({
  testId: async ({}, use, testInfo) => {
    const id = `${testInfo.workerIndex}-${testInfo.parallelIndex}-${Date.now()}`;
    await use(id);
  },
});
5. Tune workers, parallel mode, and sharding
More workers reduce wall-clock time only while the CI host, browsers, and dependencies can sustain the extra concurrency. Once CPU or memory is saturated, queueing and garbage collection increase tail latency and retries. Measure a small matrix instead of assuming that the largest worker count wins.
npx playwright test --workers=1
npx playwright test --workers=2
npx playwright test --workers=4
Use file-level parallelism by default, test.describe.configure({ mode: 'parallel' }) for an independent group, or fully parallel projects when every test is safe to run concurrently. Shard across machines when one runner has reached its useful capacity:
npx playwright test --shard=1/4
npx playwright test --shard=2/4
npx playwright test --shard=3/4
npx playwright test --shard=4/4
Before increasing concurrency, check CPU, memory, open files, browser process count, database connection limits, rate limits, and service queues. Compare median and p95, not just the fastest run. Profile Chromium, Firefox, and WebKit projects separately because engine and resource behavior differ.
6. Reduce expensive work without hiding failures
Reuse setup carefully
Authenticate once per worker with storage state when account isolation allows it. Keep per-test data creation small and deterministic. Avoid launching a new browser for every assertion; let the test runner manage browser and context lifetimes.
Control resources
Block analytics, ads, and video in tests that do not cover them, or route them to local fixtures. Do not block resources required by the behavior under test.
await page.route('**/*', async route => {
  const type = route.request().resourceType();
  if (['image', 'media', 'font'].includes(type)) return route.abort();
  await route.continue();
});
Keep artifacts targeted
Retain traces on the first retry, screenshots on failure, and video only for a narrow diagnostic job. Uploading large artifacts can dominate teardown even when browser steps are fast.
7. A repeatable optimization loop
- Capture repeated representative runs and save median and p95.
- Use a trace and API logs to identify the longest action or wait.
- Form one hypothesis, such as an unstable locator or slow third-party request.
- Change one thing: selector, readiness condition, fixture, routing rule, or worker count.
- Run the same scenario and compare the same statistics.
- Run the full suite, including retries and all browser projects, before keeping the change.
Report the environment, browser version, workers, shards, retries, trace policy, and test data. The primary Playwright and Selenium documentation provides guidance rather than a comparable universal speed ratio, so avoid promising a fixed percentage improvement.
8. Troubleshooting checklist
| Symptom | Likely cause | Fix |
|---|---|---|
| Every test has a long first step | Browser or context startup | Reuse the runner-managed browser, cache dependencies, and measure startup separately. |
| Clicks spend most of their timeout | Ambiguous locator or non-actionable element | Use a role or label, scope the locator, inspect actionability logs, and wait for the real readiness signal. |
| Navigation is slow only in CI | Network, DNS, backend, or third-party requests | Inspect the trace waterfall, test a controlled endpoint, and stub nonessential third parties. |
| Parallel runs are flaky | Shared accounts, records, files, or rate limits | Generate per-test IDs and paths, isolate accounts, and lower workers until dependencies are sized. |
| More workers make p95 worse | CPU, memory, database, or queue contention | Compare worker counts, watch host metrics, and shard to additional machines. |
| Traces make the suite much slower | Tracing every test | Use trace: 'on-first-retry' in CI and enable full tracing only for a focused investigation. |
| Results vary by browser | Engine-specific scheduling or resources | Profile each project independently and keep browser-specific findings separate. |
9. Or skip the browser setup
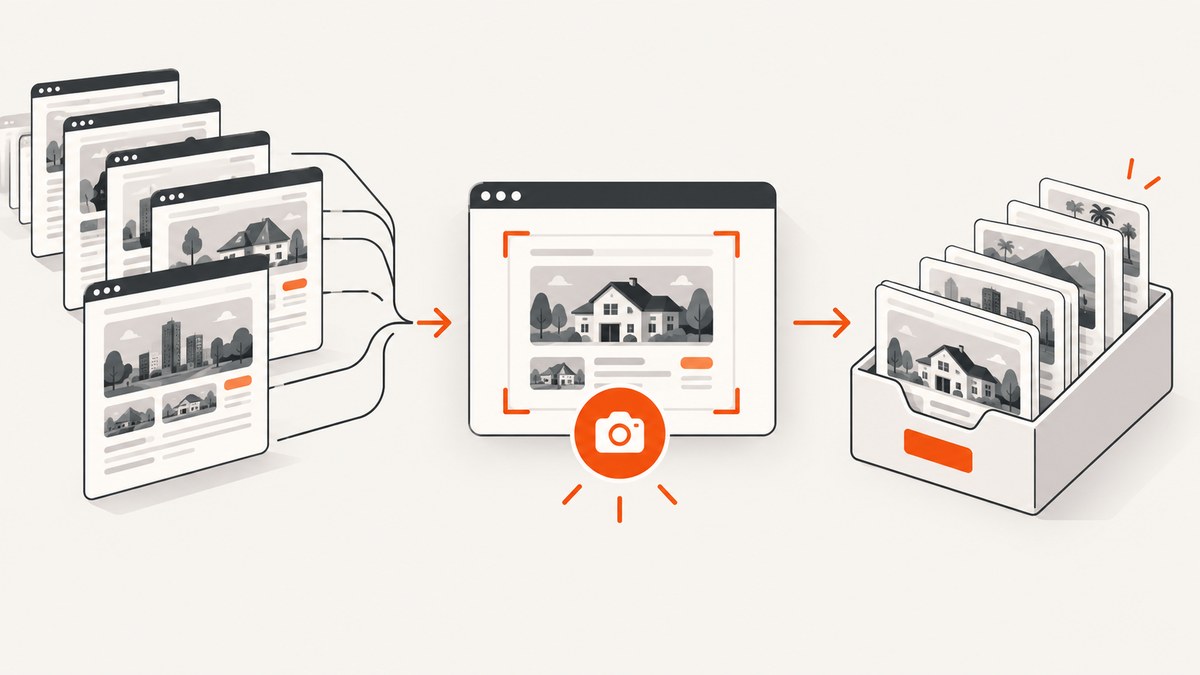
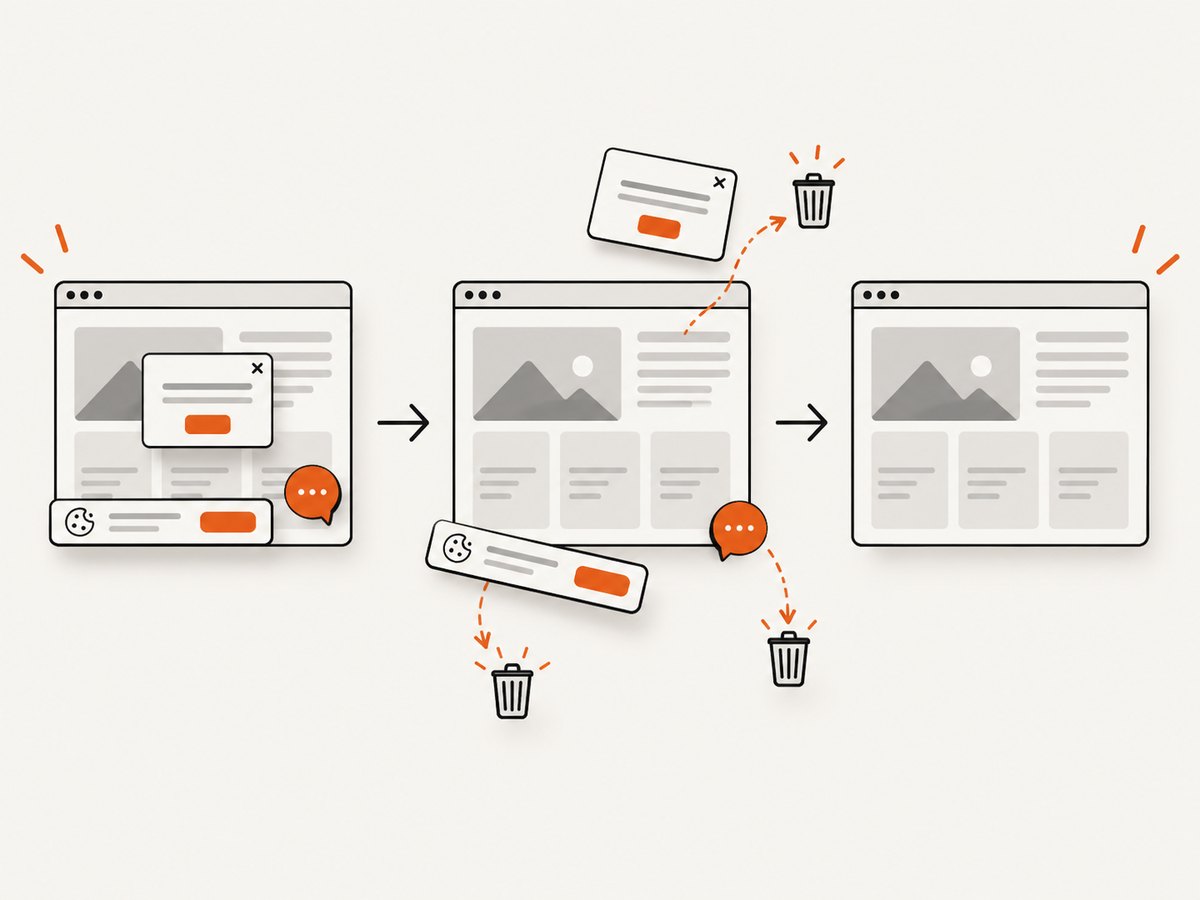
If your goal is a clean screenshot for a visual diff, report, or documentation artifact, ScreenshotNeo removes browser lifecycle work from your test runner. One GET request returns PNG, JPEG, WebP, or PDF. Cookie and consent banners are accepted and 60+ known consent platforms, newsletter popups, and chat widgets are removed before capture. Bot checks, blank pages, timeouts, failed loads, and cache hits are not billed; response headers identify the page verdict and whether it was billed.
See the ScreenshotNeo API documentation for full-page capture with lazy images, CSS element capture, device presets, retina scale, custom CSS and JavaScript, click and wait controls, request blocking, headers, cookies, user agents, authorization, timezone, geolocation, transparent backgrounds, resizing, TTL caching, signed links, async webhooks, bulk capture, usage, and PDF settings.
cURL
curl -G "https://api.screenshotneo.com/v1/shot" \
  -d access_key=YOUR_API_KEY \
  --data-urlencode url=https://stripe.com \
  -o shot.webp
Python
import requests
r = requests.get("https://api.screenshotneo.com/v1/shot", params={"access_key": "YOUR_API_KEY", "url": "https://stripe.com"}, timeout=90)
r.raise_for_status()
open("shot.webp", "wb").write(r.content)
Node.js
const q = new URLSearchParams({ access_key: 'YOUR_API_KEY', url: 'https://stripe.com' });
const res = await fetch(`https://api.screenshotneo.com/v1/shot?${q}`);
if (!res.ok) throw new Error(`HTTP ${res.status}`);
require('fs').writeFileSync('shot.webp', Buffer.from(await res.arrayBuffer()));
Use verdict headers in your pipeline so a bot check or failed load can be retried or reported without charging for a clean shot. Caching with a TTL you choose can remove repeated work; async jobs and signed webhooks keep long captures out of request threads; bulk capture supports up to 100 URLs per call. The free plan includes 1,000 shots each month with no card. Paid plans start at $5 for 3,000 shots, and every feature is available on every plan. An MCP server provides take_screenshot, get_page_info, and capture_pdf tools for Claude, Cursor, and other MCP clients.
Create a free ScreenshotNeo account and start with 1,000 screenshots per month at no charge.
10. Performance, reliability, and cost notes
- Measure test speed and page speed separately. Browser automation includes instrumentation and orchestration overhead.
- Optimize the largest repeated wait first; shaving milliseconds from assertions rarely matters if navigation dominates.
- Keep retries for diagnosis, then fix the underlying race. A faster retry loop is not a reliable suite.
- Size workers against the slowest dependency and monitor tail latency.
- For hosted screenshots, use caching and bulk capture when content allows it, and inspect billed verdict headers so failed pages do not become surprise cost.
FAQ
Should I always enable tracing?
No. Collect it on the first retry in CI, and enable it for a focused investigation when needed.
Is a higher worker count always faster?
No. It helps until the runner or a dependency saturates; after that, queueing and tail latency can increase.
Can Selenium timings prove page performance?
No. Selenium’s own guidance warns that WebDriver runs include uncontrolled browser, server, third-party, and instrumentation variation. Use a dedicated performance-testing setup.
How do I compare an optimization fairly?
Keep the CI image, browser version, scenario, data, retries, workers, and trace policy constant, then compare repeated median and tail durations.