How to Connect Puppeteer to a Remote Browser Using a Local IP Address
Connect Puppeteer to Chrome on another machine over your LAN: start remote debugging safely, find the browser WebSocket URL, and fix common connection errors.
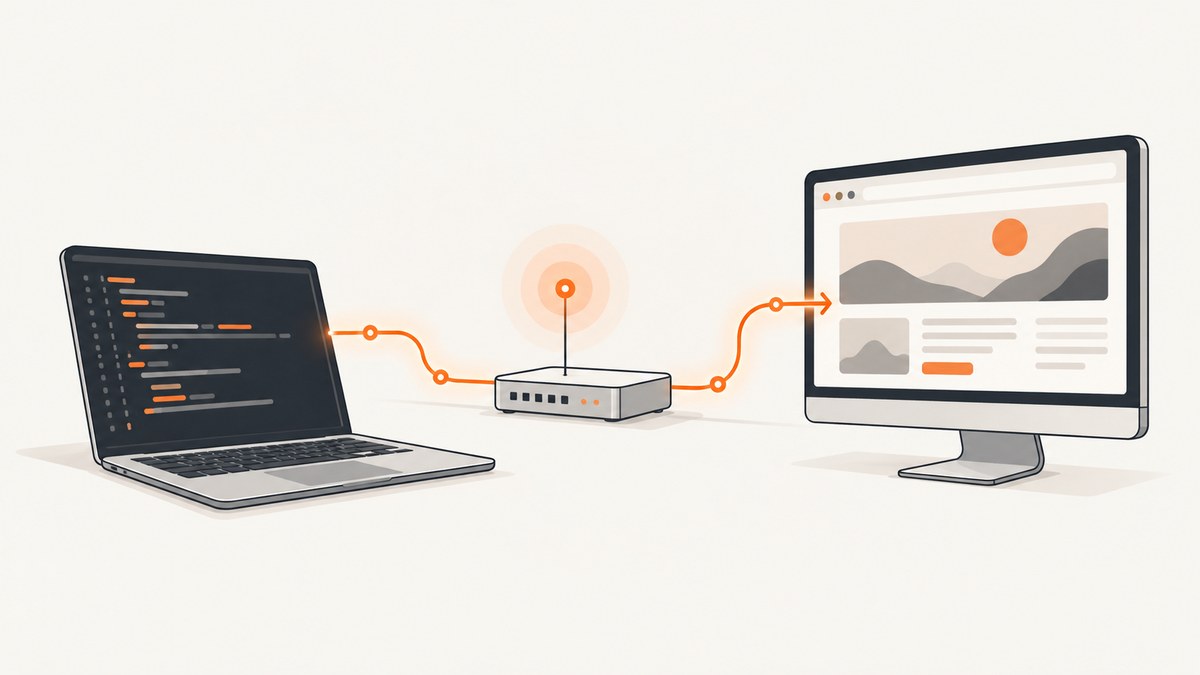
To connect Puppeteer to Chrome running on another computer on your local network, start Chrome there with remote debugging enabled and a dedicated profile, fetch its browser WebSocket URL from http://REMOTE_IP:9222/json/version, then pass the webSocketDebuggerUrl value to puppeteer.connect({ browserWSEndpoint }). Use the browser endpoint containing /devtools/browser/, not a page target URL containing /devtools/page/.
This guide uses 192.168.1.50 as an example remote machine address. Replace it with the actual LAN IP of the computer running Chrome. The client and browser host must be able to reach one another on the chosen port.
1. Start Chrome on the remote computer
Run Chrome or Chromium with a remote debugging port and a separate user data directory. The directory separates this automation profile from your normal browser data. Chrome 136 and later require a non-default user data directory for remote debugging switches; see Chrome’s remote debugging security changes.
Linux example
google-chrome \
  --remote-debugging-port=9222 \
  --user-data-dir=/tmp/puppeteer-remote-profile
Depending on the distribution, the executable may be named chromium or chromium-browser. The options are the same:
chromium \
  --remote-debugging-port=9222 \
  --user-data-dir=/tmp/puppeteer-remote-profile
macOS example
"/Applications/Google Chrome.app/Contents/MacOS/Google Chrome" \
  --remote-debugging-port=9222 \
  --user-data-dir=/tmp/puppeteer-remote-profile
Windows example
"C:\Program Files\Google\Chrome\Application\chrome.exe" ^
  --remote-debugging-port=9222 ^
  --user-data-dir="C:\puppeteer-remote-profile"
Keep that Chrome process running while Puppeteer is connected. If Chrome is already open, launch a distinct process with the dedicated profile rather than assuming that adding flags to an existing process will change its debugging configuration. A separate profile also avoids sharing your everyday cookies, saved sessions, and browsing state with the automation process.
2. Find the remote computer’s LAN IP
Use the address assigned to the remote computer on the same network as the Puppeteer client, such as 192.168.1.50. Do not use 127.0.0.1 on the client: loopback refers to the client computer itself. The Chrome setup guide uses loopback when connecting from the same machine; for a different machine, substitute the browser host’s reachable LAN address.
Check that the client can reach the remote host and port before debugging Puppeteer. Network isolation, host firewalls, VPN routing, or a port that only listens on loopback can prevent access. Permit connections only from trusted peers that need the browser.
3. Read webSocketDebuggerUrl
The CDP HTTP service exposes /json/version. Fetch it from the Puppeteer computer using the remote IP:
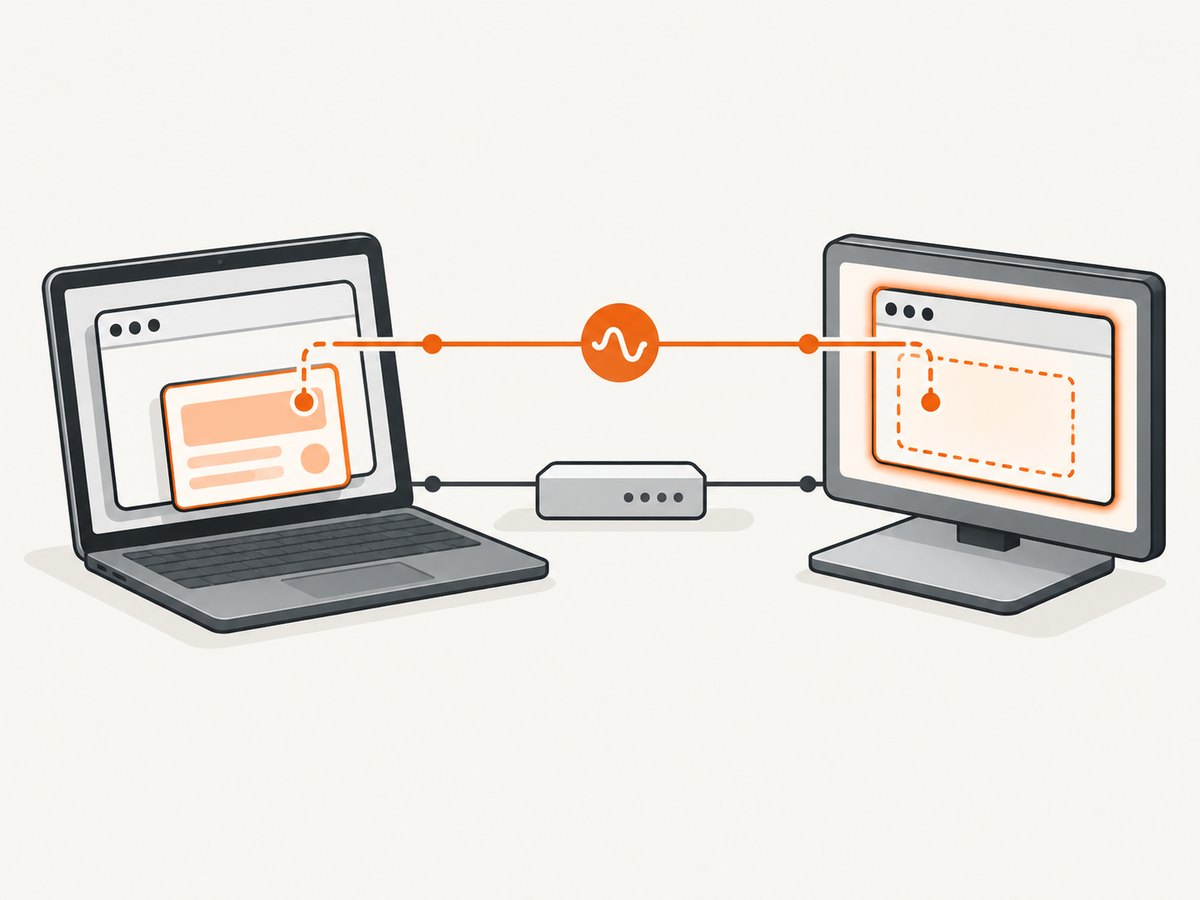
curl http://192.168.1.50:9222/json/versionThe response is JSON containing a field similar to:
{
  "Browser": "Chrome/...",
  "webSocketDebuggerUrl": "ws://192.168.1.50:9222/devtools/browser/01234567-89ab-cdef-0123-456789abcdef"
}
Use the complete value of webSocketDebuggerUrl. The ID is generated for the running browser, so copy the value returned by your instance rather than reusing the illustrative one above. Puppeteer documents that this browser URL can be found at /json/version, and that its format is ws://HOST:PORT/devtools/browser/<id> in its Browser.wsEndpoint API reference.
Inspect the endpoint with Python
import json
from urllib.request import urlopen

version_url = "http://192.168.1.50:9222/json/version"
with urlopen(version_url, timeout=5) as response:
    version = json.load(response)

print(version["webSocketDebuggerUrl"])
Inspect the endpoint with Node.js
const versionUrl = 'http://192.168.1.50:9222/json/version';
const response = await fetch(versionUrl);
if (!response.ok) {
  throw new Error(`Version endpoint returned HTTP ${response.status}`);
}
const version = await response.json();
console.log(version.webSocketDebuggerUrl);
These checks confirm that the HTTP discovery endpoint responds and show the exact WebSocket address to use. They do not establish that every network device between the computers will permit the subsequent WebSocket connection.
4. Connect Puppeteer and control a page
On the client machine, install Puppeteer in a Node.js project:
npm init -y
npm install puppeteer
Create connect-remote.mjs. Paste the current browser WebSocket URL from step 3 into browserWSEndpoint:
import puppeteer from 'puppeteer';

const browser = await puppeteer.connect({
  browserWSEndpoint:
    'ws://192.168.1.50:9222/devtools/browser/01234567-89ab-cdef-0123-456789abcdef',
});

try {
  const page = await browser.newPage();
  await page.goto('https://example.com', { waitUntil: 'domcontentloaded' });
  console.log('Title:', await page.title());
  console.log('URL:', page.url());
} finally {
  // Detach this Puppeteer client; leave remote Chrome running.
  browser.disconnect();
}
Run it with:
node connect-remote.mjsPuppeteer’s browser management guide shows connecting to a browser launched outside Puppeteer. It also distinguishes browser.disconnect() from browser.close(): disconnecting detaches the client without shutting down the browser or closing its pages. Use browser.close() only when you intend Puppeteer to close the browser it is connected to.
Browser endpoint versus page target
The response from /json/version provides the browser-level endpoint that belongs in browserWSEndpoint. By contrast, /json/list describes individual targets, often with WebSocket URLs containing /devtools/page/. Those URLs refer to a page target and are not the browser WebSocket endpoint expected by this connection pattern. If you need an existing tab, connect to the browser endpoint first and then select a page.
const pages = await browser.pages();
console.log(`Open pages: ${pages.length}`);

const page = pages[0] ?? await browser.newPage();
await page.goto('https://example.com');
Use browser.newPage() when a new tab is appropriate. Use browser.pages() when you need to inspect or reuse tabs already open in the remote browser. A new page is still controlled by the same remote Chrome process and shares its machine’s browser resources.
Connection options and practical choices
| Choice | Use | What to check |
|---|---|---|
--remote-debugging-port=9222 |
Expose Chrome’s CDP HTTP and WebSocket endpoints on a port. | Use the same port in the discovery URL and returned endpoint. |
--user-data-dir=... |
Give the debug browser a dedicated profile directory. | Choose a writable path on the remote host; keep it separate from your normal profile. |
browserWSEndpoint |
Connect Puppeteer directly to the browser’s WebSocket endpoint. | Copy the full webSocketDebuggerUrl from /json/version. |
browser.disconnect() |
End Puppeteer’s connection while leaving Chrome running. | Use cleanup logic so disconnect occurs after work finishes. |
The endpoint is tied to the running browser process. If Chrome restarts, query /json/version again rather than assuming that the prior browser ID remains valid. If your remote host uses a different port, substitute it consistently in the HTTP discovery address, the returned WebSocket URL, and any firewall rules.
Or skip the browser setup
If your goal is a website screenshot rather than managing a remote Chrome session, ScreenshotNeo provides a screenshot API and MCP server. One GET request returns an image or PDF; the call below saves a WebP response. See the ScreenshotNeo API documentation for parameters.
curl -G "https://api.screenshotneo.com/v1/shot" -d access_key=YOUR_API_KEY --data-urlencode url=https://stripe.com -o shot.webpScreenshotNeo removes cookie banners, popups, and chat widgets before the shot. Bot checks, blank pages, and failed loads are never billed. Its MCP server lets AI agents take screenshots. The free plan includes 1,000 screenshots a month with no card; paid plans start at $5 for 3,000. Sign up for the free plan.
Troubleshooting
| Symptom | Likely cause | Fix |
|---|---|---|
/json/version does not load |
Chrome is stopped, remote debugging is not enabled, the port is wrong, or the client cannot reach the host. | Confirm Chrome was launched with the debugging and profile flags. Check the IP and port, then check the local network route and firewall from the client. |
| Works on the remote host but not from the client | The test used 127.0.0.1, which points to the machine running the test, or the port is not reachable across the LAN. |
Use the remote computer’s LAN IP. Check that network policy and firewall rules permit the client to reach the debugging port. |
| “Target closed,” protocol, or endpoint error | The copied WebSocket address may be stale, malformed, or a page target address. | Fetch /json/version again and copy the full webSocketDebuggerUrl. Confirm it contains /devtools/browser/. |
| Chrome starts but debugging is unavailable | A default profile may be in use, or another Chrome process may have absorbed the launch request. | Start a separate process with a fresh dedicated --user-data-dir, then inspect its version endpoint. |
| Connection drops during work | The browser process may have exited or the network path may have interrupted the WebSocket. | Keep Chrome running, check host sleep and network stability, and reconnect using the endpoint returned by the newly started process. |
| Need more protocol detail | The failure is not apparent from the thrown error alone. | Enable Puppeteer debugging with NODE_DEBUG="puppeteer:*" in the environment, then reproduce. Debug logs may contain sensitive information; protect and redact them. |
Security, reliability, performance, and cost
Restrict access to the debugging port
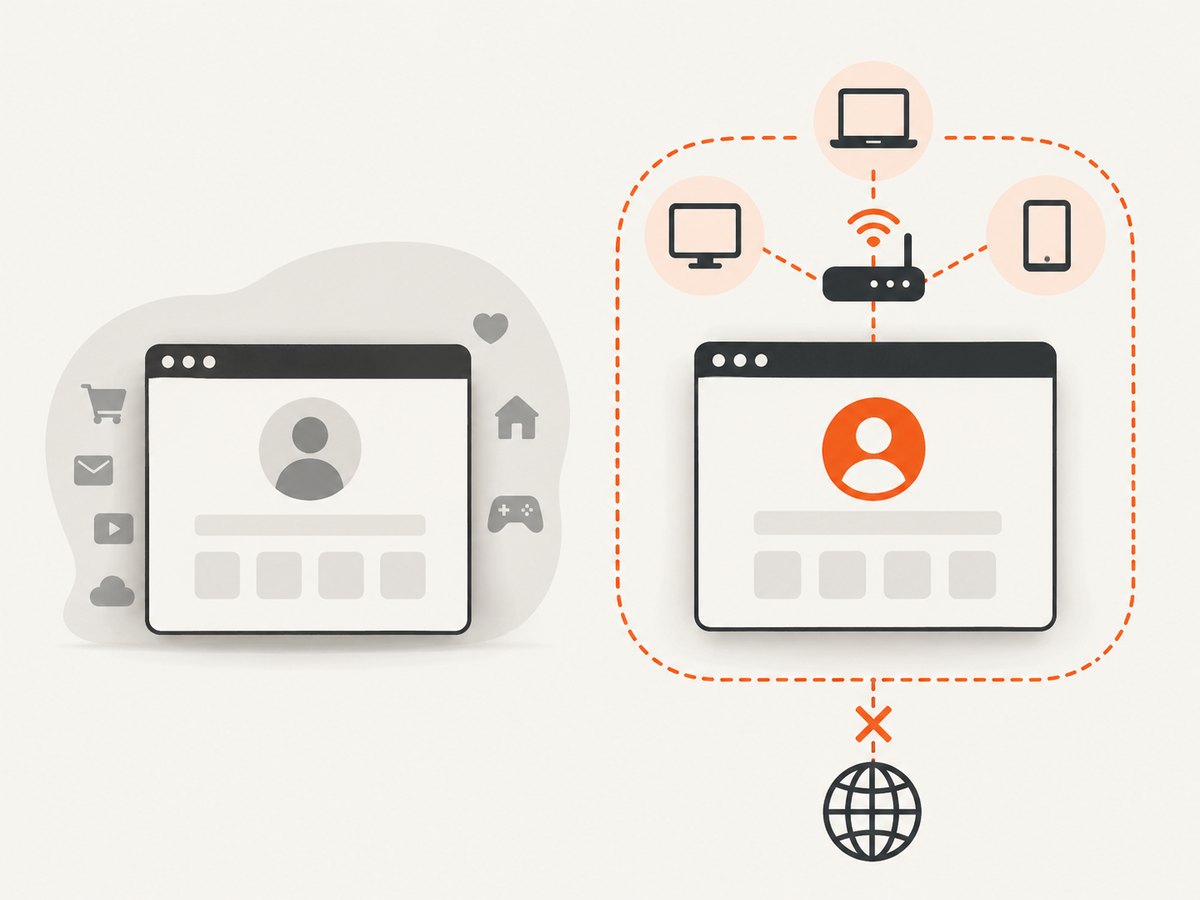
A reachable browser debugging endpoint gives its clients control over the browser session. Use a dedicated profile and restrict the port to trusted network peers. Avoid exposing the port to the public internet. The cited official guidance explains endpoint mechanics and the custom profile requirement; it does not provide a complete firewall or authentication recipe, so apply the controls supported by your operating system and network.
Plan for browser and network failures
The browser host must remain available, and the endpoint must match the current Chrome process. Treat connection setup and page navigation as separate failure points: first verify the version endpoint, then connect, then navigate. In automation, use bounded timeouts and report which step failed. On a Chrome restart, rediscover the endpoint instead of retrying a stale WebSocket URL indefinitely.
Keep work near the browser
Page rendering, JavaScript execution, and network requests happen on the remote Chrome host. The Puppeteer client sends browser commands and receives results over the connection. Long-distance networks add latency to command-response cycles; a LAN generally avoids the extra routing distance of a remote region. Actual timing depends on the page, host, network, and workload, so test with your own pages before setting throughput expectations.
Manage concurrency and operating cost
This arrangement makes you responsible for the remote machine, Chrome installation, profile storage, updates, process supervision, and capacity planning. Multiple pages consume resources on that host; choose concurrency based on observed CPU and memory use for your workload. If sessions must survive client restarts, manage Chrome lifecycle and endpoint discovery separately. The dossier contains no benchmark or capacity figure, so there is no universal safe number of concurrent pages.
Self-hosting can make sense when you need control of the machine and profile and already operate a suitable host. Compare the full operating cost: host resources, maintenance, network access controls, and time spent diagnosing failures. For the narrower need to produce screenshots, an API can avoid operating a remote browser endpoint; ScreenshotNeo’s plans and included features are listed above.
FAQ
Can I use Puppeteer from a different computer on Wi-Fi?
Yes, if the client can reach the Chrome host’s LAN IP and debugging port, and the host returns a browser WebSocket URL reachable from that client.
Can I use the same endpoint after restarting Chrome?
Do not assume so. Query /json/version after restart and use the current webSocketDebuggerUrl.
Does disconnecting Puppeteer close the remote browser?
No. browser.disconnect() detaches Puppeteer. browser.close() closes the browser.
Why does localhost work in one place but fail elsewhere?
Loopback names the local machine from the perspective of the program using it. On the client, use the remote host’s IP instead.


