11 React Charting Libraries for Charts and Diagrams
Compare React charting libraries by chart type, rendering, accessibility, licensing, and whether you need a chart or a diagram editor.

There is no universal best React charting library. Choose based on the chart families you need, how people will interact with them, the size of the data, the rendering approach, and how much custom visualization code your team is prepared to own. Also decide whether “diagrams” means a graph that displays relationships or an editor where people create and rearrange nodes; those are different jobs.
This guide compares eleven options as a shortlist, but the supplied research dossier verifies detailed facts for only Recharts, Apache ECharts, Chart.js, and some licensing context for Highcharts. The other names below are candidates to investigate, not fully researched recommendations. Check their current React integration, maintenance, license, and documentation before adopting them.
1. Start by defining the visualization
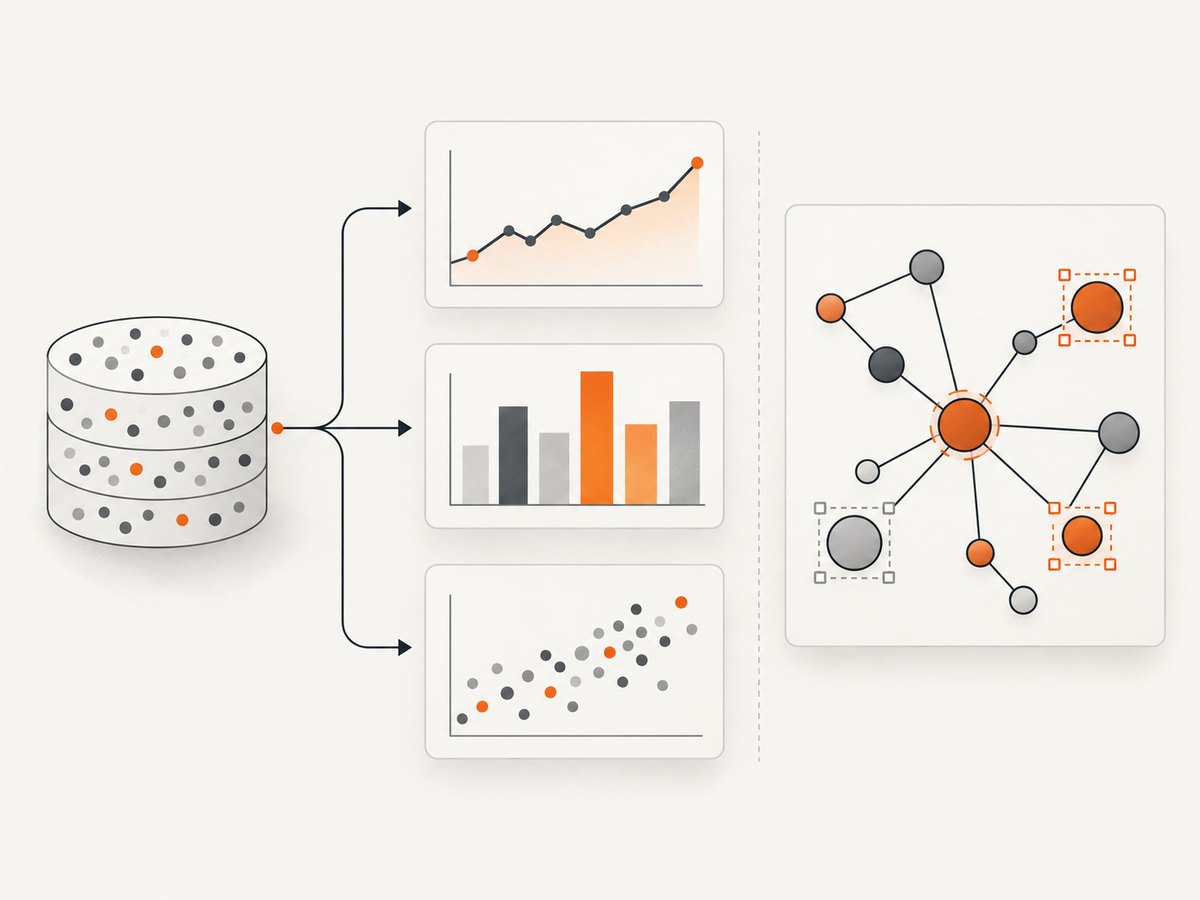
Write down the actual user task before comparing APIs. A dashboard with a few line and bar charts has different constraints from a streaming time series, a graph of connected entities, or a flowchart editor. “Supports charts” is too broad to make a useful selection.
| Need | Questions to answer |
|---|---|
| Chart families | Do you need line, bar, scatter, pie, heatmap, map, financial, hierarchical, or combined charts? |
| Interaction | Will users filter, zoom, pan, select, brush, drill down, or only read a static summary? |
| Data and device | How many points are visible at once? Which phones, browsers, and lower-powered devices must work? |
| React ownership | Do you want JSX components, a React adapter around a JavaScript library, a declarative specification, or low-level drawing primitives? |
| Accessibility | What information must be available to keyboard users and screen readers, and what equivalent table or summary will you provide? |
| License | Can the exact package and version be used in your deployment and commercial model? |
Decide whether “diagram” means a visualization or an editor. A graph chart can show entities and connections; an editor must also support actions such as adding, moving, connecting, and deleting nodes. A library suited to one does not automatically solve the other.
2. Eleven libraries to put on your shortlist
The first three have the clearest evidence in the research dossier. The remaining entries are names surfaced in the TanStack comparison map; treat them as research leads, not as conclusions about suitability. The comparison itself warns that documented feature rows are not bundle-size or performance claims.
- Recharts. A React-component-first option for conventional charts. Its official project describes composable React components, SVG elements, and D3 submodules. Consider it when JSX composition and React-oriented APIs match your team’s approach. The project page identified version 3.10.1 during research; verify the version you plan to install. Recharts project.
- Apache ECharts. A JavaScript visualization library with more than 20 documented chart types, Canvas and SVG renderers, and interactive components. Its feature page describes graph series for relationships, and its homepage describes generated chart descriptions and decal patterns. It is a candidate when broad chart coverage or configurable interactions matter; confirm the React adapter and integration details for your application. The project claims incremental rendering can handle millions of points, but that is not an independent benchmark or a guarantee for your workload. ECharts and its feature page.
- Chart.js. A Canvas-rendering JavaScript chart library with TypeScript typings and documented compatibility with React. The core project and its React wrapper are separate integration choices: check the wrapper’s installation and lifecycle guidance rather than assuming Chart.js itself is a React component. Chart.js documentation.
- Nivo. Investigate it if you want a React-oriented charting API. Verify the specific chart families, rendering paths, accessibility approach, and maintenance status your application needs.
- Victory. Add it to the evaluation if its component composition and chart coverage suit your UI. Confirm the current package and React support before choosing.
- Highcharts. Evaluate it with licensing early. A secondary comparison describes commercial licensing with separate non-commercial terms; confirm current official terms for your organization and deployment before making a purchasing decision.
- D3. Consider it when you need low-level control and are prepared to build more of the chart behavior, layout, and interaction yourself. A rendering toolkit is not the same as a ready-made React chart component.
- visx. Investigate it as a lower-level React visualization toolkit if you want to compose charts from primitives. Verify how much behavior you will need to implement and maintain.
- Plotly.js. Include it if the interactions and chart types it documents fit your product. Check the React wrapper, chart-specific requirements, and licensing for the exact usage.
- ApexCharts. Compare its chart coverage and licensing terms against your deployment. Do not infer commercial permission from a free package or a feature table; review current official terms.
- React Flow or another diagram editor. If users create and edit node-based workflows, evaluate a dedicated diagramming tool rather than treating a chart library’s graph series as a full editor. This is a category candidate, not a claim that it belongs in a chart-library comparison.
The title promises eleven libraries, but the evidence here does not establish an equally detailed, verified roster of eleven chart packages. In particular, the last item intentionally names a diagramming category rather than presenting an unverified chart library as fact. Use the list to structure evaluation, and verify candidates against current official documentation before publishing a production choice.
3. Compare rendering, integration, and workload
Rendering affects memory, interaction, output, and accessibility, but there is no universal rule that one renderer is fastest. Recharts describes SVG output. Chart.js documents Canvas rendering. ECharts offers Canvas or SVG. SVG elements can be inspected and styled individually; Canvas paints into a bitmap surface; WebGL can be relevant for specialized large or 3D visualizations. Actual responsiveness depends on the dataset, chart configuration, redraw frequency, browser, device, and interaction.
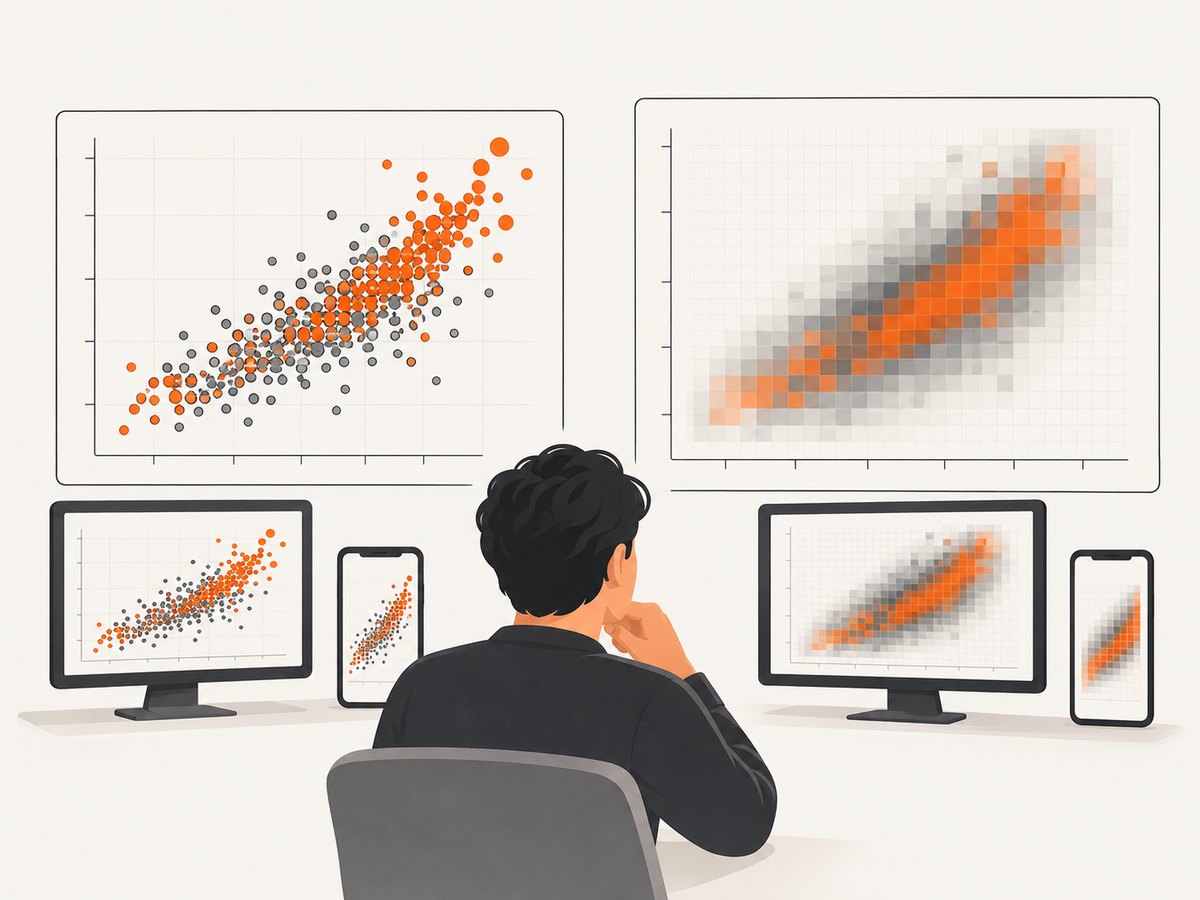
ECharts says its incremental rendering can visualize millions of points. Treat that as the project’s own feature claim, not evidence that it will outperform another library for your data. Test your actual chart with representative data and interactions. A line chart with static data is not a meaningful proxy for a graph with hover tooltips, live updates, and frequent resizing.
React integration also ranges from composing components to passing a configuration object into a renderer or assembling lower-level primitives. For wrappers, check whether updates replace the full chart, update only data, or require explicit cleanup. Confirm behavior under React rerenders and component unmounts. Avoid storing mutable chart instances in state in a way that triggers unwanted rerenders.
4. Accessibility and maintainability are product requirements
A chart that looks clear may still fail a screen reader user. Add a useful title and text summary, expose important values in an accessible table when precision matters, and ensure interactions can be reached by keyboard. Test the complete experience with assistive technology. Generated descriptions or patterns can help, but do not assume they replace application-specific explanations or manual review.
Before committing, verify the license for the exact package version and all add-ons. The dossier identifies Recharts as MIT and ECharts’ FAQ identifies Apache License 2.0. Highcharts has distinct licensing considerations, so confirm current official terms. Check project activity, release notes, issue handling, peer dependency requirements, and compatibility with your React version. Avoid treating a comparison chart’s checkmarks as evidence of production quality, bundle size, or speed.
5. A practical evaluation plan
- Choose representative cases. Pick one ordinary chart, one demanding interaction, and one edge case such as missing values or an empty result.
- Build the same slice in two candidates. Match data, dimensions, labels, and interactions so the comparison is useful.
- Use real device targets. Check narrow screens, keyboard use, and at least one lower-powered device relevant to your audience.
- Measure the work your team cares about. Record load and update responsiveness, memory symptoms, bundle impact in your own build, and implementation time. Do not substitute vendor point-count claims for a local test.
- Review the accessibility and license path. Test keyboard and screen-reader flows, then obtain a clear answer for the exact deployment and commercial use.
- Make the choice reversible where possible. Keep data shaping and business rules outside library-specific components so changing renderers later does not require rewriting the application.
6. Runnable React examples for the best-documented candidates
Recharts: composable React components
Install recharts in an existing React app, then render a responsive chart. The container needs a measurable height; otherwise the chart can collapse.
import { ResponsiveContainer, LineChart, Line, XAxis, YAxis, Tooltip } from 'recharts';

const data = [
  { day: 'Mon', visits: 120 },
  { day: 'Tue', visits: 180 },
  { day: 'Wed', visits: 145 },
];

export function VisitsChart() {
  return (
    <div style={{ width: '100%', height: 280 }}>
      <ResponsiveContainer>
        <LineChart data={data}>
          <XAxis dataKey="day" />
          <YAxis />
          <Tooltip />
          <Line type="monotone" dataKey="visits" stroke="#2563eb" />
        </LineChart>
      </ResponsiveContainer>
    </div>
  );
}
Apache ECharts: configuration-driven chart
Install echarts and use a React adapter compatible with your app. The example below shows the ECharts option object; the host must initialize the chart after its container has dimensions, update the option when data changes, resize it when the container changes, and dispose the instance on unmount.
const option = {
  title: { text: 'Daily visits' },
  tooltip: { trigger: 'axis' },
  xAxis: { type: 'category', data: ['Mon', 'Tue', 'Wed'] },
  yAxis: { type: 'value' },
  series: [{ type: 'line', data: [120, 180, 145] }],
};

// Pass `option` to the ECharts instance created by your chosen React adapter.
// Ensure the chart container has an explicit width and height.
Chart.js: Canvas core with a React wrapper
Install chart.js and a React wrapper such as the one you select for your application. Register the required chart components as directed by the wrapper and Chart.js documentation; the following shows the data and options shape to pass to a line chart component.
const data = {
  labels: ['Mon', 'Tue', 'Wed'],
  datasets: [{ label: 'Visits', data: [120, 180, 145], borderColor: '#2563eb' }],
};

const options = {
  responsive: true,
  plugins: { legend: { display: true } },
};

// Render the wrapper's Line component with `data` and `options`.
// Register the required Chart.js scales and elements for your chosen setup.
7. Or skip the browser setup
If your goal is to capture a chart or diagram already rendered on a web page, ScreenshotNeo can return a screenshot or PDF from one GET request. Its clean capture removes cookie banners, popups, and chat widgets before the shot. Bot checks, blank pages, and failed loads are never billed. An MCP server lets AI agents use screenshot tools. There are 1,000 screenshots a month free with no card; paid plans start at $5 for 3,000. See ScreenshotNeo and the API documentation.
curl -G "https://api.screenshotneo.com/v1/shot" \
  -d access_key=YOUR_API_KEY \
  --data-urlencode url=https://stripe.com \
  -o shot.webp
Sign up for 1,000 free screenshots per month with no card.
8. Troubleshooting
| Symptom | Likely cause | Fix |
|---|---|---|
| Chart is blank | The container has zero width or height, the renderer did not initialize, or required chart modules were not registered. | Give the container explicit dimensions, initialize after mount, and check the library’s setup steps and browser console. |
| Chart is clipped after resize | The chart did not receive a resize event or the responsive parent has no measurable size. | Use the library’s responsive integration or call its resize mechanism when the host dimensions change. |
| Tooltip or legend covers data | The plot area is too small for labels or controls. | Adjust chart margins/grid, reduce label density, rotate or format labels, or move the legend. |
| Values do not match the source | Stacking, aggregation, missing-value handling, or data-key mapping is wrong. | Inspect the transformed series and axis configuration; ECharts’ FAQ specifically suggests checking the stack setting when line ticks seem inconsistent. |
| Slow interaction with large data | Too many rendered marks, expensive tooltips, frequent React updates, or a device constraint. | Profile with realistic data, reduce visible points, aggregate or downsample where appropriate, and test renderer choices under the same workload. |
| React warnings or leaks | An imperative chart instance survives unmount or is recreated on each render. | Follow the adapter lifecycle, dispose instances, stabilize options where useful, and avoid putting mutable instances into deeply reactive state. |
9. Performance, reliability, and cost notes
Keep data transformation separate from rendering. Avoid rebuilding large arrays on every render when the source data has not changed. For live feeds, decide how often the UI must update and whether to batch incoming points. Test memory as well as frame responsiveness: large chart datasets can become memory-intensive. Rendering claims are workload-specific and should not be translated into a guaranteed point limit.
Reliability includes empty, delayed, malformed, and partial data states. Render a useful loading state, an explicit no-data message, and a recoverable error state. If a chart library depends on browser APIs, account for server rendering and hydration behavior in your chosen framework. For cost, compare license obligations and engineering time as well as package cost; open-source availability does not remove the need to review license terms and maintenance risk.
10. FAQ
Which one is best?
The best fit is the library that meets your chart and interaction requirements with an acceptable implementation, accessibility, maintenance, and license cost. Start with a representative prototype.
Is an ECharts graph series a flowchart editor?
No. A graph series visualizes relationships. Editing workflows requires a separate evaluation of diagram editing behavior.
Can I compare vendor point-count claims?
Not as if they were measured in the same benchmark. Use your dataset, devices, rendering configuration, and interactions.
Do I need a React wrapper for Chart.js?
The core Chart.js project is JavaScript and documents React compatibility; decide whether to use a separate React wrapper and follow its current setup guidance.
What should I verify before shipping?
Check current React compatibility, lifecycle behavior, accessibility with your actual chart, license terms, and maintenance activity for the exact versions you plan to deploy.
Sources: Recharts, Apache ECharts, ECharts features, ECharts FAQ, Chart.js documentation, and the TanStack library comparison. The comparison’s feature map is not a universal performance test.


