How to Open a Remote Headless Chrome Debugging Page with Selenium
Learn how Selenium Grid URLs differ from Chrome’s remote debugger, how to connect safely, troubleshoot remote sessions, and capture clean screenshots.
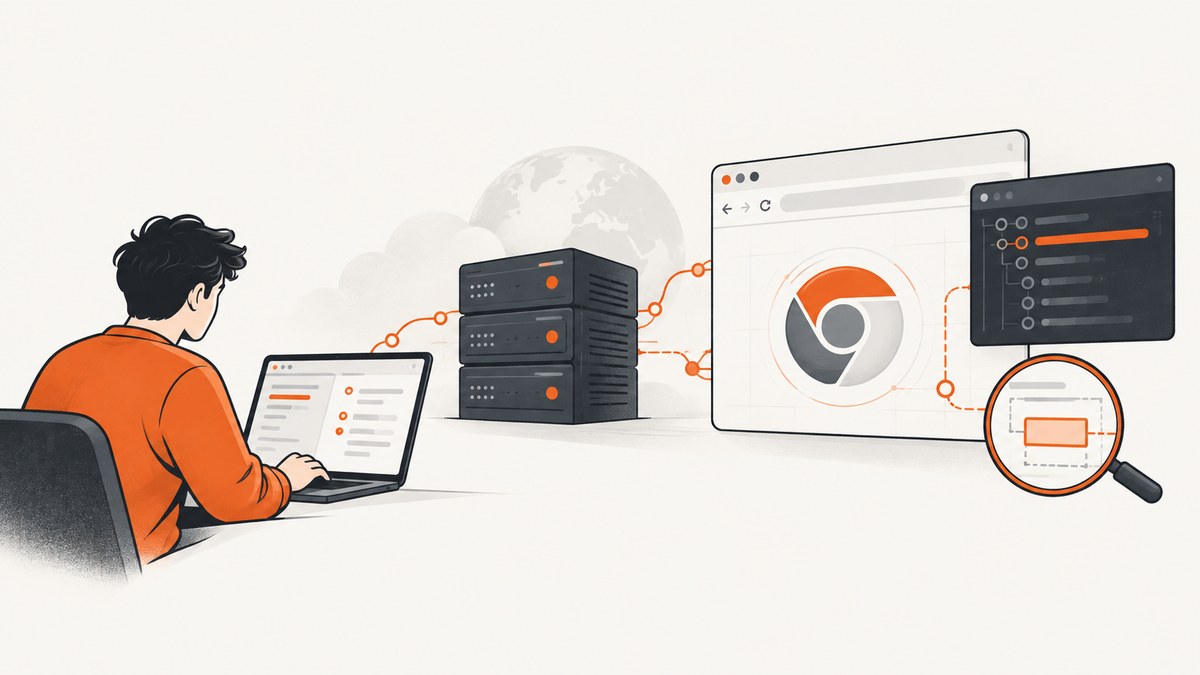
Direct answer: Selenium Grid and Chrome’s remote debugging service are different endpoints. Use the Grid URL to create and control a remote WebDriver session. Use Chrome’s debugging address only when that Chrome process was started with remote debugging enabled. Selenium’s standalone Grid commonly uses http://localhost:4444, while Selenium’s JavaScript Chromium API documents localhost:9222 as an example debugger address. Opening the Grid URL does not automatically open the DevTools page for the browser tab.
This distinction matters when Chrome runs on another host, inside a container, or on a Grid node. Your Selenium client must reach the Grid service, and any process using Chrome DevTools Protocol (CDP) must separately reach the browser’s debugging endpoint. The exact debugging URL, port exposure, authentication, and tunnel depend on how Chrome is launched and networked, so verify them in the target environment instead of assuming that one public URL works everywhere.
Grid URL versus Chrome debugging URL
| What you need to do | Endpoint or API | What it represents |
|---|---|---|
| Create and control a remote WebDriver session | Grid server URL, such as http://grid-host:4444 |
Selenium’s session service and Grid deployment |
| Check Grid health and slots | Grid UI or /status on the Grid server |
Nodes, sessions, and Grid state |
| Inspect a Chrome target with browser debugging tools | Chrome remote debugging address, such as browser-host:9222 |
Chrome’s browser-level debugging service |
Selenium’s Remote WebDriver documentation describes a client connecting to a browser on another machine by supplying a remote server URL and browser options. The Grid documentation describes standalone Grid as a convenient single-machine setup and identifies port 4444 as its default. The Grid UI and status endpoint report Grid information; they are not established as Chrome’s DevTools frontend.
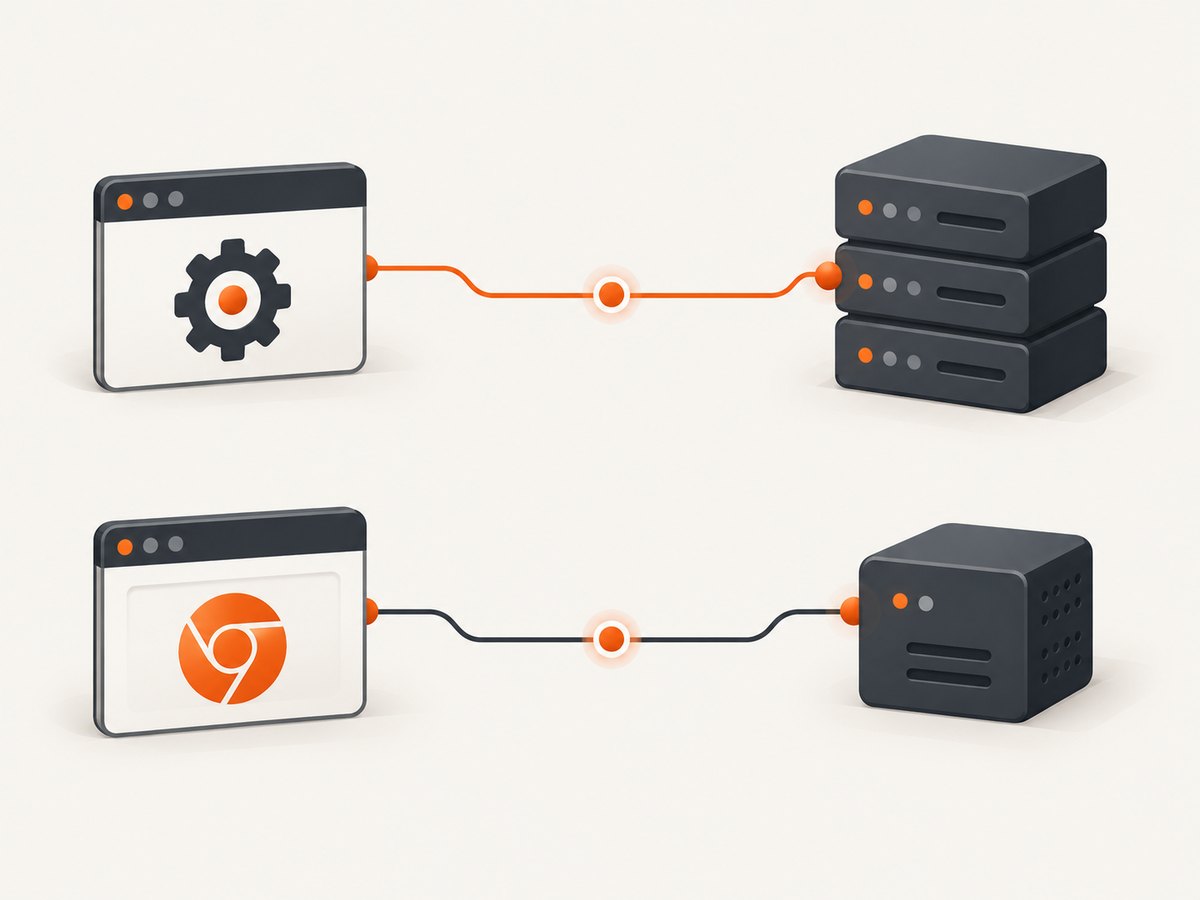
Chrome’s debugger address belongs to the Chrome process. Selenium’s JavaScript Chromium API exposes it as an option in the form hostname:port and gives localhost:9222 as an example. Read the Chromium API reference for the binding version you use.
Choose the page you actually want
To inspect Grid state
Open the Grid server address in a browser. For a local standalone Grid, that is commonly:
http://localhost:4444
http://localhost:4444/status
For a remote Grid, replace localhost with the host name reachable from your workstation. The status response helps confirm that the Grid service is responding. It does not prove that a Chrome node has exposed a DevTools endpoint.
To inspect a Chrome target
Chrome must have been launched with remote debugging enabled, and the debugging port must be reachable from the process that will use it. Selenium’s researched documentation does not define one universal Chrome launch command, firewall policy, tunnel, or authentication scheme for every bare-metal, Docker, Kubernetes, and hosted-browser deployment. Treat the debugger address as a deployment-specific interface and keep it on a trusted network unless your environment provides an authenticated, protected route.
If your goal is console, network, or JavaScript-error inspection, first confirm that the Chrome version, Selenium binding, and CDP features you need are supported together. Selenium describes CDP support as temporary and version-dependent while WebDriver BiDi is implemented as the standards-based, cross-browser direction. See Selenium’s Chrome DevTools documentation and WebDriver documentation.
Start a remote headless Chrome session through Grid
The following Python example creates a headless Chrome session through a reachable Grid URL. It assumes the Grid host is grid-host and that the node has Chrome and a compatible ChromeDriver. Selenium says Chrome and ChromeDriver major versions should match; Selenium Manager can configure drivers when enabled in supported setups. This example illustrates the connection pattern and should be adapted to your deployment.
from selenium import webdriver
from selenium.webdriver.chrome.options import Options

GRID_URL = "http://grid-host:4444"

options = Options()
options.add_argument("--headless=new")
options.add_argument("--window-size=1440,1000")

# The Grid URL belongs to Selenium, not Chrome DevTools.
driver = webdriver.Remote(command_executor=GRID_URL, options=options)

try:
    driver.get("https://example.com")
    print("title:", driver.title)
    print("current URL:", driver.current_url)
    driver.save_screenshot("remote-headless.png")
finally:
    driver.quit()
Install the binding with pip install selenium. Run the script from the client machine, replacing grid-host with a DNS name or IP address that resolves from that machine. Do not use localhost unless the client process and Grid service share the same host or network namespace.
Java example with RemoteWebDriver
Java is useful when your project already runs on a Selenium Grid. Selenium’s Grid getting-started material lists Java 11 or newer, a browser, and a driver among the prerequisites.
import java.net.MalformedURLException;
import java.net.URL;

import org.openqa.selenium.WebDriver;
import org.openqa.selenium.chrome.ChromeOptions;
import org.openqa.selenium.remote.RemoteWebDriver;

public class RemoteChrome {
    public static void main(String[] args) throws MalformedURLException {
        URL gridUrl = new URL("http://grid-host:4444");

        ChromeOptions options = new ChromeOptions();
        options.addArguments("--headless=new");
        options.addArguments("--window-size=1440,1000");

        WebDriver driver = new RemoteWebDriver(gridUrl, options);
        try {
            driver.get("https://example.com");
            System.out.println(driver.getTitle());
            System.out.println(driver.getCurrentUrl());
        } finally {
            driver.quit();
        }
    }
}
The Grid URL is still the session endpoint. Adding a headless argument changes how Chrome renders; it does not make a DevTools page appear at the Grid address.
Attach to an existing Chrome debugger in Selenium JavaScript
When a Chrome instance already runs with a remote debugging server, Selenium’s JavaScript Chromium options API provides debuggerAddress. The documented example uses localhost:9222:
const { Builder } = require('selenium-webdriver');
const chrome = require('selenium-webdriver/chrome');

(async function attachToChrome() {
  const options = new chrome.Options();
  options.debuggerAddress('browser-host:9222');

  const driver = await new Builder()
    .forBrowser('chrome')
    .setChromeOptions(options)
    .build();

  try {
    console.log(await driver.getTitle());
    console.log(await driver.getCurrentUrl());
  } finally {
    await driver.quit();
  }
})();
Install it with npm install selenium-webdriver. Replace browser-host:9222 with an address reachable from the process running this code. If the browser is on a private node, the client needs an approved route such as an internal network path or environment-specific tunnel. The API option does not create the debugger server; Chrome must already be configured to provide it.
Inspect a headless session without attaching DevTools
Many debugging tasks do not require the Chrome DevTools frontend. Selenium can expose useful evidence directly:
# Python examples inside an active driver session
print(driver.current_url)
print(driver.title)
print(driver.page_source[:1000])
driver.save_screenshot("failure.png")
Capture these values when a test fails, together with the Grid session identifier and node logs available in your deployment. A screenshot of the rendered page can reveal a login redirect, consent dialog, blank response, or bot check even when the test error is generic.
Remote routing and deployment checklist
- Locate the client. Determine which machine or container runs your Selenium code. Every host name, including
localhost, is resolved from that process. - Locate the Grid. Confirm the Grid service address and its listening port. Standalone Grid is intended for a single machine; Hub/Node and distributed topologies place components on multiple machines.
- Locate the browser. Identify the node where Chrome runs. The node may be different from the Grid host.
- Decide whether CDP is necessary. Use WebDriver APIs for normal navigation and assertions. Use CDP only for Chrome-specific capabilities that your binding and browser version support.
- Verify each route. The client-to-Grid route and any client-to-debugger route are separate checks. A working Grid session does not imply a reachable debugger port.
- Keep ports private. Do not expose a debugging endpoint to the public internet as a shortcut. Use the access controls and network design supplied by your infrastructure.
- Record versions. Store Chrome, ChromeDriver, Selenium binding, and Grid versions with failure logs. Selenium documents major-version matching between Chrome and ChromeDriver.
Common errors and fixes
| Error or symptom | Likely cause | Fix |
|---|---|---|
| The Grid page opens but no DevTools target appears | You opened the Selenium service, not Chrome’s debugger | Use the browser’s configured debugger address and confirm that remote debugging was enabled for that Chrome process. |
localhost:4444 refuses the connection |
Nothing is listening locally, or the Grid is on another host/container | Use the Grid host reachable from the client and verify the Grid process and port. |
localhost:9222 refuses the connection |
Chrome was not started with a debugging server, or the port is not routed | Check the Chrome launch configuration and network path. Do not infer the debugger port from the Grid port. |
| Connection works locally but fails in CI | localhost resolves inside the CI runner or container |
Use a routable service name, container network alias, or approved tunnel. |
| Session creation reports a version mismatch | Chrome and ChromeDriver major versions differ | Align the major versions and review Selenium Manager or node image configuration. |
| CDP command is unavailable | The command is not supported by the binding or browser version | Check Selenium’s version-specific CDP documentation, update compatible components, or use WebDriver BiDi where supported. |
| DevTools shows the wrong tab | Several targets exist and the selected target is not the one under test | Identify the active WebDriver window and target in your deployment, then confirm the attachment behavior before automating against it. |
| Headless output is blank | Navigation failed, content is delayed, a bot check appeared, or the page requires extra resources | Log the final URL and page source, save a screenshot, wait for a meaningful selector, and inspect node logs. |
Performance, reliability, and cost considerations
Remote control adds network hops: client to Grid, Grid to node, and possibly client to Chrome’s debugger. Keep the Grid and browser nodes close to the workloads that use them, and avoid repeatedly creating sessions when a test suite can safely reuse one. At the same time, always call quit() in a finally block so abandoned sessions do not consume node capacity.
Headless mode reduces the need for a desktop display, but it does not remove page variability. A page may wait on JavaScript, lazy images, third-party requests, authentication, or a consent dialog. Use explicit waits for application conditions rather than a large fixed sleep. Record timing around session creation and navigation so slow Grid startup can be distinguished from slow page loading.
Grid capacity is constrained by CPU, memory, browser processes, and the number of parallel sessions your nodes can sustain. Increase concurrency only after measuring failure rates and resource pressure in your own environment. CDP calls can be tightly coupled to Chrome versions, so pin compatible versions and plan upgrades as a coordinated change.
Selenium itself does not charge per screenshot. Your costs come from the machines, containers, hosted Grid, network, and engineering time required to maintain browser images and routes. If you only need an image or PDF rather than an interactive browser session, a screenshot API can remove that operational work.
Or skip the browser setup
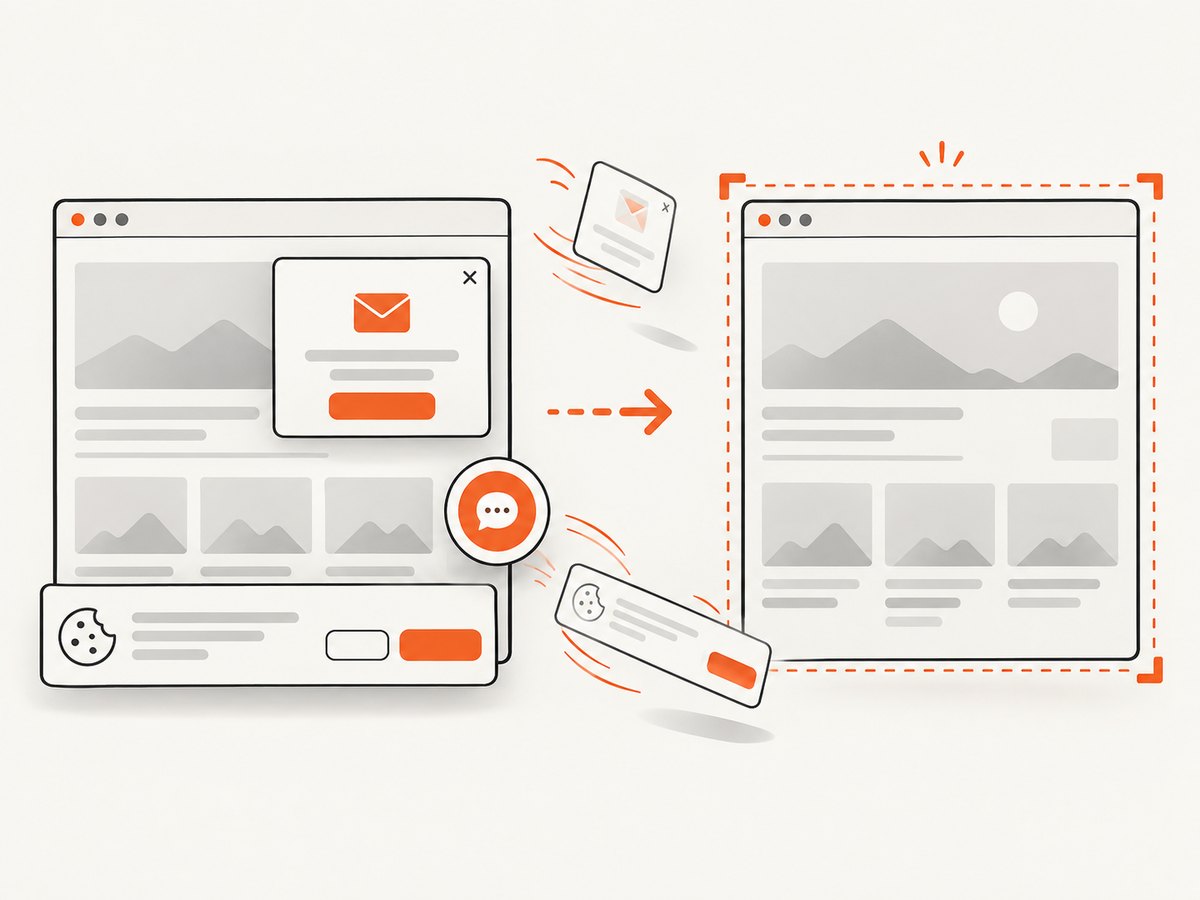
ScreenshotNeo provides a website screenshot API and MCP server. One GET request returns a PNG, JPEG, WebP, or PDF. It accepts cookie and consent banners like a visitor, then removes more than 60 known consent platforms, newsletter popups, and chat widgets before capture; each cleanup step can be turned off. Bot checks, blank pages, timeouts, failed loads, and cache hits are not billed, and the response reports the result with X-Page-Verdict and X-Billed headers.
See the ScreenshotNeo documentation for the complete parameter list. The API supports full-page capture with lazy images, CSS-element capture, dark mode, device presets, arbitrary viewports, retina scale, PDF paper sizes and page ranges, custom CSS and JavaScript, clicks, selector waits, delays, network idle waits, request blocking, headers, cookies, user agents, authorization, timezone, geolocation, transparent backgrounds, resizing, custom-TTL caching, signed image links, asynchronous jobs with signed webhooks, bulk capture for up to 100 URLs, usage reporting, and an OpenAPI specification. Existing parameter names used by other screenshot APIs also work to ease migration.
cURL
curl -G "https://api.screenshotneo.com/v1/shot" \
  -d access_key=YOUR_API_KEY \
  --data-urlencode url=https://stripe.com \
  -o shot.webp
Python
import requests

r = requests.get(
    "https://api.screenshotneo.com/v1/shot",
    params={"access_key": "YOUR_API_KEY", "url": "https://stripe.com"},
    timeout=90,
)
r.raise_for_status()
open("shot.webp", "wb").write(r.content)
Node.js
const q = new URLSearchParams({
  access_key: 'YOUR_API_KEY',
  url: 'https://stripe.com'
});
const res = await fetch(`https://api.screenshotneo.com/v1/shot?${q}`);
if (!res.ok) throw new Error(`Screenshot failed: ${res.status}`);
const fs = await import('node:fs/promises');
await fs.writeFile('shot.webp', Buffer.from(await res.arrayBuffer()));
ScreenshotNeo includes an MCP server with take_screenshot, get_page_info, and capture_pdf tools for Claude, Cursor, and other MCP clients. The Free plan includes 1,000 screenshots per month with no card; paid plans start at $5 for 3,000 shots, with every feature available on every plan. Create a free ScreenshotNeo account.
FAQ
Is port 4444 the Chrome debugging port?
No. In Selenium’s standalone Grid documentation, 4444 is the default Grid service port. Chrome’s debugger is a separate service; Selenium’s JavaScript example uses 9222 for a debugger address.
Can Selenium open a DevTools window for a headless browser?
Headless Chrome has no normal visible desktop window. You can connect to a configured debugging endpoint or use supported CDP APIs, but the exact frontend and target URL depend on your Chrome launch and network setup.
Should I use CDP or WebDriver BiDi?
Use the API that matches your requirement and browser support. Selenium describes CDP as temporary and version-dependent, while WebDriver BiDi is the standards-based cross-browser direction.
Why does a remote WebDriver example work on my laptop but not from a container?
Names such as localhost resolve from the container. Replace them with a reachable Grid or browser service name and verify routing from inside the container.
Can I use ScreenshotNeo for a page that requires a full Selenium session?
Use Selenium when you need interactive control, assertions, or application-specific workflows. Use ScreenshotNeo when the deliverable is a clean screenshot or PDF and you want consent cleanup, failure verdicts, caching, bulk capture, or an MCP workflow.


