How to Render Charts in Wicked PDF
Render charts reliably in Wicked PDF by making assets reachable and waiting for JavaScript to finish—or use a static SVG or PNG for predictable output.

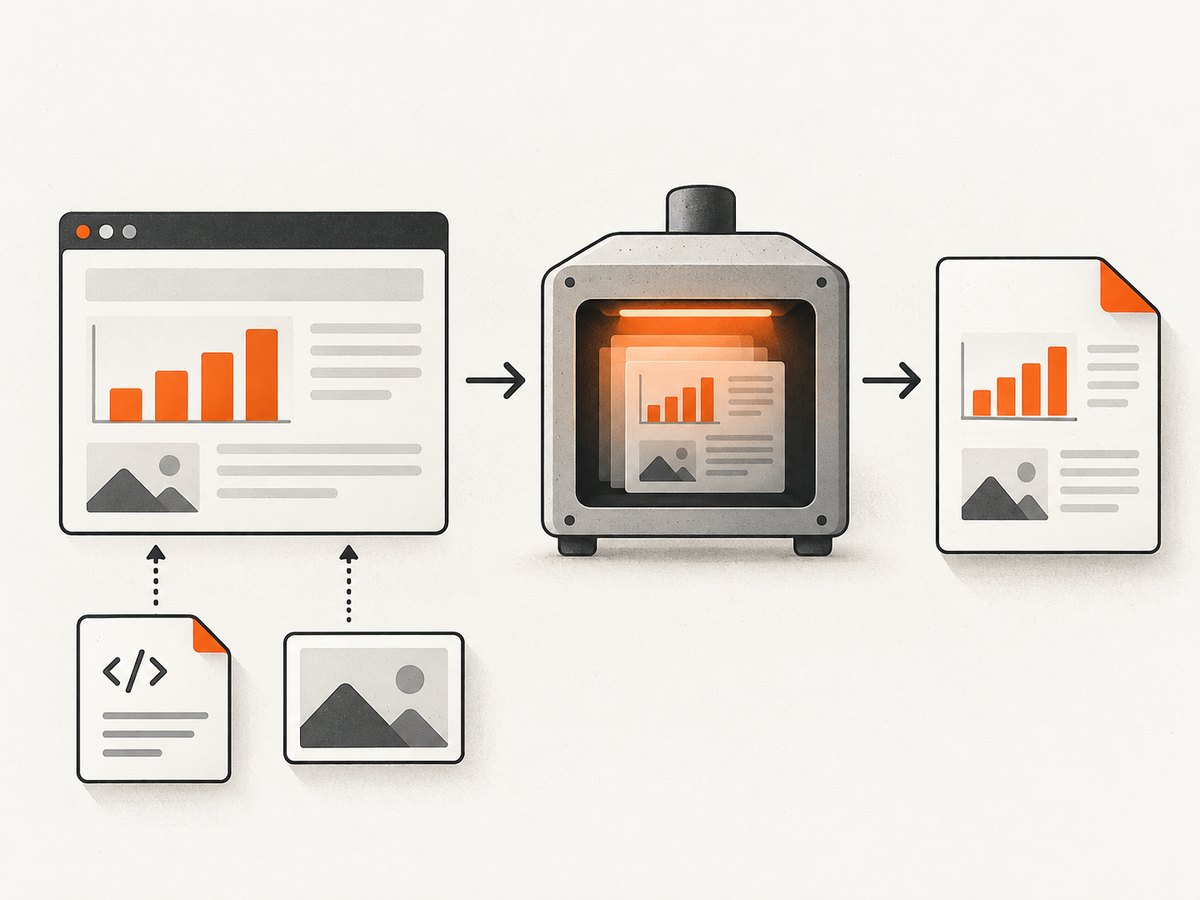
To render charts in Wicked PDF, build the chart in the HTML view that Wicked PDF converts, make its JavaScript, stylesheets, fonts, and images reachable to wkhtmltopdf, and ensure any client-side drawing finishes before conversion. For the most predictable result, render the chart on the server as SVG or PNG and include that image in the PDF view.
Wicked PDF is a Rails wrapper around the external wkhtmltopdf command. It converts HTML; it does not provide a separate chart-drawing API. That distinction explains the common failure: a chart may appear in a normal browser but be blank in the PDF because the converter could not load an asset or began printing before JavaScript finished. See the Wicked PDF README for the project’s view helpers and conversion options.
1. Choose how the chart will be rendered
There are two practical approaches. Pick based on whether the chart must be generated dynamically in the page or whether you can provide a finished image.
| Approach | Best fit | Trade-off |
|---|---|---|
| Server-generated SVG or PNG | Reports that need repeatable output and have chart data available on the server | Requires a chart-rendering step and an asset path the converter can read |
| JavaScript chart in the HTML view | Charts built by an existing browser-side library or page code | Requires reachable scripts and an explicit wait for drawing to finish |
| Inline SVG markup | Small, self-contained vector charts | Still depends on the converter’s SVG and CSS rendering behavior |
Wicked PDF does not promise compatibility for every chart library. Chart.js, Highcharts, D3, and similar libraries should be validated using the same deployed wkhtmltopdf binary, assets, and fonts as production. The project documentation does not publish a chart-library compatibility benchmark.
2. Create a PDF-specific Rails view
Keep the chart’s markup and dimensions explicit. For example, a PDF view can contain a fixed-size container and a canvas:
<!-- app/views/reports/show.pdf.erb -->
<!doctype html>
<html>
  <head>
    <meta charset="utf-8">
    <%= wicked_pdf_stylesheet_link_tag 'pdf' %>
    <%= wicked_pdf_javascript_include_tag 'pdf_chart' %>
  </head>
  <body>
    <h1>Monthly revenue</h1>
    <div id="revenue-chart" style="width: 680px; height: 340px">
      <canvas id="revenue-canvas" width="680" height="340"></canvas>
    </div>
    <script>
      // Draw the chart here, or invoke your chart library after its script loads.
    </script>
  </body>
</html>
The helper names above are documented by Wicked PDF for assets outside the normal asset-pipeline path. The gem also documents Webpacker helpers such as wicked_pdf_stylesheet_pack_tag and wicked_pdf_javascript_pack_tag for applications using Webpacker. Use the asset helpers that match the app’s build setup, and confirm the generated HTML points to files the converter can access.
A controller can render the PDF from that view with options such as:
def show
  @report = Report.find(params[:id])

  respond_to do |format|
    format.html
    format.pdf do
      render pdf: "report-#{@report.id}",
             template: "reports/show.pdf.erb",
             javascript_delay: 1500
    end
  end
end
The delay here is an example value, not a universal setting. The appropriate wait depends on when the page’s scripts and data become ready. Prefer an explicit readiness signal when timing varies between reports.
3. Wait for client-side chart drawing
There are two documented mechanisms. javascript_delay pauses for a fixed duration before conversion. It is straightforward, but can waste time on fast pages and still be too short on slow ones. window_status waits until page JavaScript sets a particular status value, which gives the chart code control of the ready point.
// In the PDF page, after the chart library reports drawing complete:
window.status = 'chart-ready';
# In the controller
render pdf: 'report',
template: 'reports/show.pdf.erb',
window_status: 'chart-ready'Set the status only after data has loaded and the chart has finished drawing. If the chart library has an animation-complete callback, use that callback to set the status. If the page can fail before it signals readiness, conversion may wait until its timeout; inspect application and converter logs when that happens.
Turn JavaScript off only for a view containing no required client-side work, such as a static SVG or PNG. Disabling it to work around an intermittent blank chart will simply make a JavaScript chart consistently blank.
4. Make Rails assets available to wkhtmltopdf
The PDF conversion process must be able to read every dependency. A browser session that can load an asset does not prove that the converter can load it: the converter may run on a server without the same session, host resolution, asset compilation state, or local-file permissions.
- Use PDF-aware helpers or absolute URLs. Wicked PDF documents
wicked_pdf_stylesheet_link_tag,wicked_pdf_javascript_include_tag, andwicked_pdf_image_tagfor its asset paths. Absolute or CDN URLs are another option when the conversion host can reach them. - Precompile production assets. When production does not compile assets at runtime, precompile the stylesheet, JavaScript, fonts, and images referenced by the PDF view.
- Use base64 for small assets only. The README documents
wicked_pdf_asset_base64with normal Rails helpers. Inlining can simplify access for a small image, but encoding large assets adds overhead and bloats the HTML input. - Check fonts and image paths. A missing image can interfere with other images appearing, according to the README. Confirm the actual asset URLs in the rendered HTML and ensure the deployed converter can fetch them.
- Allow local file access only when needed. Configure
enable_local_file_accesswhen the converter must read local files. Avoid broad access when all required files can be delivered another way.
Make sure wkhtmltopdf is installed in each environment where PDF generation runs. The gem’s runtime requirements list the executable. If it is not on the process PATH, configure its location:
WickedPdf.configure do |config|
  config.exe_path = '/usr/local/bin/wkhtmltopdf'
end
Use the real executable path for the deployed host or container. Verify the binary and version in the same runtime that handles PDF requests; local development and production can have different installations.
5. Prefer a static SVG or PNG when reliability matters
If the chart can be produced before rendering the PDF, generate it as a standalone SVG or PNG and insert it into the HTML. That removes browser timing and JavaScript execution from the conversion path. It does not remove the asset-access requirement: wkhtmltopdf still needs to read the image.
<%= wicked_pdf_image_tag(@report.chart_path) %>For SVG, check the actual output in the deployed converter. If the vector image does not render consistently, export a PNG at the target display size. PNG is raster, so choose dimensions adequate for the PDF’s printed size; avoid arbitrarily huge images that increase memory and PDF size.
Static output also makes failures easier to isolate. Open the generated SVG or PNG independently, then verify its URL or local path from the conversion environment. If the standalone chart itself is incomplete, debug chart generation before investigating Wicked PDF.
6. Configure page size and chart dimensions
Set the chart’s CSS width and height explicitly and leave room for the PDF page margins, headings, legends, and labels. A chart wider than the printable content area may be clipped or scaled. A chart that is too short may make labels unreadable after scaling.
Check the PDF’s paper size, orientation, margins, and DPI together with the chart dimensions. The Wicked PDF README notes that Linux commonly renders at 75 DPI and Windows commonly at 96 DPI, and suggests a zoom adjustment of 0.78125 when matching them. Treat that as a platform-specific sizing consideration, not a guaranteed chart correction. Compare output from the actual production platform before choosing final dimensions.
7. Debug the HTML before debugging the PDF
Use Wicked PDF’s HTML debugging mode to inspect the intermediate page:
render pdf: 'report',
       template: 'reports/show.pdf.erb',
       show_as_html: params.key?('debug')
When debugging, follow the README’s guidance to switch between regular Rails tags and Wicked PDF tags as appropriate. In particular, file:/// paths can trigger browser cross-domain restrictions in the HTML debug mode. A failure in debug mode can therefore be caused by the debug browser’s asset rules rather than the PDF conversion itself.
- Open the debug HTML and inspect the chart container size.
- Check the browser console and network requests for missing scripts, stylesheets, fonts, data, and images.
- Confirm the chart appears in that HTML after scripts run.
- Inspect the generated asset URLs and test access from the conversion host.
- Try a static chart image to distinguish asset access from JavaScript timing.
- Compare the local and production
wkhtmltopdfversions and configuration.
8. Production checklist
- Install and identify the deployed
wkhtmltopdfbinary. - Precompile every PDF stylesheet, JavaScript file, font, and image needed in production.
- Use reachable absolute URLs or the appropriate Wicked PDF asset helpers.
- Give JavaScript charts fixed dimensions and wait with a delay or readiness status.
- Validate the exact chart library and output using production’s converter build.
- Check paper size, orientation, margins, chart dimensions, and platform DPI.
- Test missing assets and slow chart-data responses so failures are diagnosable.
- Sanitize user-controlled HTML, CSS, and JavaScript, and restrict network access available to conversion. The project warns that conversion executes
wkhtmltopdfagainst temporary HTML and assets; arbitrary URLs can expose internal resources.
9. Troubleshooting common chart failures
| Symptom | Likely cause | Fix |
|---|---|---|
| Blank chart, but the page title and layout appear | Conversion happened before JavaScript drew the chart, or JavaScript is disabled | Use javascript_delay or signal window_status after drawing completes. Enable JavaScript for a JS chart. |
| Chart works in HTML but not in production PDF | Production asset was not precompiled, URL is inaccessible to the converter, or production uses a different binary | Inspect rendered HTML, check asset requests from the conversion host, and verify the production executable and version. |
| JavaScript or stylesheet returns a missing-file error | Asset path is relative, fingerprinted differently, or not included in the production build | Use Wicked PDF helpers, absolute reachable paths, and include the assets in precompilation. |
| SVG is missing or malformed in output | SVG path is inaccessible or the deployed converter handles the document differently than expected | Verify the SVG independently and from the conversion environment; try an exported PNG if necessary. |
| Conversion waits or times out | A readiness status is never set, a dependency is slow, or the page cannot load a required resource | Ensure every success path sets the status, inspect network failures, and use a bounded delay when explicit signaling is not practical. |
| HTML debug view shows broken local assets | file:/// paths encounter browser cross-domain restrictions |
Follow the README’s debug-mode instructions and use the appropriate standard or Wicked PDF tags for that mode. |
| Chart is clipped or text is too small | Chart dimensions do not account for printable area, margins, orientation, or DPI | Set explicit dimensions and inspect output with the deployed page settings and platform. |
| One missing image causes other images to disappear | Asset resolution or loading failure in the converted HTML | Check all image paths and use the documented image helper or reachable URLs. |
10. Performance, reliability, and cost considerations
Rendering cost and latency depend on your Rails application, chart-generation work, asset loading, and converter configuration; the research sources provide no benchmark that applies across deployments. A fixed JavaScript delay adds that wait to the conversion path even when drawing finishes earlier. An explicit readiness signal can avoid a guessed fixed pause, though the page must reliably signal completion. Server-generated static charts reduce browser work but add chart-export and image-transfer costs.
For reliability, keep the conversion page self-contained where practical, use explicit dimensions, and avoid unnecessary remote dependencies. Cache or reuse chart output at the application level only when the report’s data and access rules allow it. Treat external assets as failure points: if a CDN, font, or data endpoint is unavailable to the converter, the PDF may differ from the HTML you viewed in a logged-in browser.
Wicked PDF’s own cost depends on your infrastructure and how often you run conversions; the cited documentation does not publish a service price or performance guarantee. Monitor your application’s conversion failures and duration, and validate changes to the binary and assets before deploying them.
11. Or skip the browser setup
If your actual need is a screenshot of a page or rendered chart, rather than a Rails-generated PDF report, ScreenshotNeo provides a website screenshot API and MCP server. One GET request returns an image or PDF. Its API supports PNG, JPEG, WebP, and PDF output, and accepts many parameter names used by other screenshot APIs. See the ScreenshotNeo API documentation for request options.

curl -G "https://api.screenshotneo.com/v1/shot" \
  -d access_key=YOUR_API_KEY \
  --data-urlencode url=https://stripe.com \
  -o shot.webp
import requests
r = requests.get(
"https://api.screenshotneo.com/v1/shot",
params={"access_key": "YOUR_API_KEY", "url": "https://stripe.com"},
timeout=90,
)
open("shot.webp", "wb").write(r.content)const q = new URLSearchParams({ access_key: 'YOUR_API_KEY', url: 'https://stripe.com' });
const res = await fetch(`https://api.screenshotneo.com/v1/shot?${q}`);
if (!res.ok) throw new Error(`Screenshot request failed: ${res.status}`);
await Bun.write('shot.webp', res);Before capture, ScreenshotNeo accepts cookie or consent banners and removes more than 60 known consent platforms, newsletter popups, and chat widgets; each step can be turned off. Bot checks and CAPTCHAs, blank pages, timeouts, failed loads, and cache hits cost nothing, and response headers identify the page verdict and billing status. Its MCP server offers take_screenshot, get_page_info, and capture_pdf for Claude, Cursor, and other MCP clients. The free plan includes 1,000 screenshots per month without a card; paid plans start at $5 for 3,000 shots. All listed features are on every plan.
Sign up free for 1,000 screenshots a month, with no card required.
12. Frequently asked questions
Can I use Chart.js, Highcharts, or D3?
Possibly, but the project documentation does not guarantee compatibility for specific chart libraries. Test with the exact assets and converter build used in production; use static SVG or PNG when client-side execution proves unreliable.
Should I use a delay or window status?
Use a delay when a small, stable wait is adequate. Use a readiness status when the chart’s completion time varies and your page can reliably signal when drawing has finished.
Does a static image still need asset configuration?
Yes. The converter must be able to read the SVG or PNG through its local path or URL, so use an accessible path and configure local file access only if needed.
Why does the chart render on my laptop but fail after deployment?
Compare the deployed binary, precompiled assets, URLs, fonts, and file-access settings. Those environment differences determine what the converter can load and how it renders the page.