How to Render Google Charts in wkhtmltopdf PDFs
Make Google Charts appear in wkhtmltopdf PDFs by waiting for JavaScript and chart readiness, then use a static-image or browser fallback when WebKit cannot cope.

Short answer: wkhtmltopdf can render a Google Chart only when its JavaScript runs successfully, the chart library and data finish loading, and the PDF conversion waits until drawing is complete. Enable JavaScript, give the page a readiness signal, and wait for that signal with --window-status. A fixed --javascript-delay can help, but it is only a timing guess. If the chart still fails, generate a static chart image before conversion or move PDF generation to a modern browser engine.
wkhtmltopdf is a headless HTML-to-PDF and image tool built on Qt WebKit. Google Charts is a JavaScript API that draws HTML5/SVG visualizations, so the renderer must execute the page code and capture the DOM after the chart has been drawn. See the Google Charts documentation and the wkhtmltopdf command-line manual.
1. Use an explicit chart-ready signal
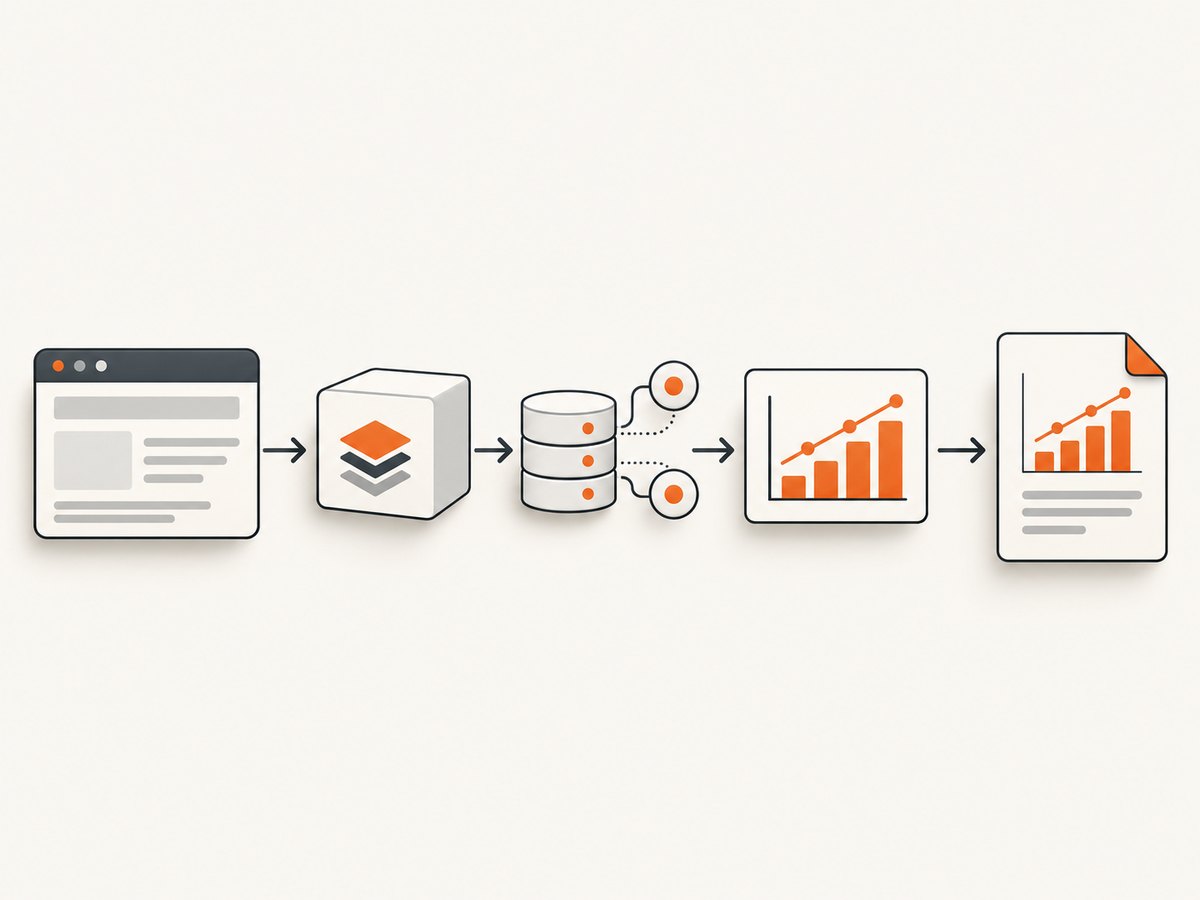
The most reliable pattern is to set window.status only after the Google Charts loader, data request, and chart.draw() callback have completed. Then tell wkhtmltopdf to wait for that value.
<!doctype html>
<html>
<head>
  <meta charset="utf-8">
  <title>Sales report</title>
  <style>
    body { font-family: Arial, sans-serif; margin: 24px; }
    #chart { width: 900px; height: 500px; }
  </style>
  <script src="https://www.gstatic.com/charts/loader.js"></script>
  <script>
    window.status = 'chart-loading';

    google.charts.load('current', { packages: ['corechart'] });
    google.charts.setOnLoadCallback(drawChart);

    function drawChart() {
      const data = google.visualization.arrayToDataTable([
        ['Month', 'Revenue'],
        ['Jan', 120],
        ['Feb', 180],
        ['Mar', 240],
        ['Apr', 210]
      ]);

      const chart = new google.visualization.LineChart(
        document.getElementById('chart')
      );

      google.visualization.events.addListener(chart, 'ready', function () {
        window.status = 'chart-ready';
      });

      chart.draw(data, {
        title: 'Monthly revenue',
        legend: { position: 'bottom' },
        chartArea: { left: 70, top: 50, width: '80%', height: '70%' }
      });
    }
  </script>
</head>
<body>
  <h1>Sales report</h1>
  <div id="chart" aria-label="Monthly revenue chart"></div>
</body>
</html>
Convert it with:
wkhtmltopdf \
  --enable-javascript \
  --window-status chart-ready \
  report.html report.pdf
The ready event is preferable to guessing how long drawing takes. If your chart type does not expose the event as expected, set window.status immediately after chart.draw() as a diagnostic, then verify the output carefully; that signal means your code called draw, not necessarily that every remote resource is visible in the PDF.
2. A complete example with asynchronous data
Many blank charts are caused by a data request that finishes after wkhtmltopdf has already captured the page. Set the status only in the successful response path and set an error status in the failure path.
<script src="https://www.gstatic.com/charts/loader.js"></script>
<script>
  window.status = 'chart-loading';
  google.charts.load('current', { packages: ['corechart'] });
  google.charts.setOnLoadCallback(loadData);

  function loadData() {
    const query = new google.visualization.Query(
      'https://example.com/chart-data'
    );
    query.send(function (response) {
      if (response.isError()) {
        console.error(response.getMessage(), response.getDetailedMessage());
        window.status = 'chart-error';
        return;
      }

      const chart = new google.visualization.ColumnChart(
        document.getElementById('chart')
      );
      google.visualization.events.addListener(chart, 'ready', function () {
        window.status = 'chart-ready';
      });
      chart.draw(response.getDataTable(), { title: 'Orders' });
    });
  }
</script>
For production PDF generation, prefer server-owned data embedded in the HTML or an authenticated endpoint that the renderer can reach. Cross-origin requests, cookies, firewalls, DNS, TLS, and private APIs can all prevent the data callback from succeeding.
3. wkhtmltopdf options that affect charts
| Option | What it controls | When to use it | Limit |
|---|---|---|---|
--enable-javascript |
Allows page JavaScript to run | Use explicitly in scripts and CI commands | Does not add support for browser APIs Qt WebKit lacks |
--javascript-delay <ms> |
Waits a fixed number of milliseconds | Quick diagnostic or pages without a readiness signal | Too short produces blank output; too long wastes time; network latency varies |
--window-status <text> |
Waits until window.status matches |
Preferred when you control the page | Your page must set the exact value on every success path |
--no-stop-slow-scripts |
Prevents wkhtmltopdf from stopping slow scripts | Only when a known long-running script is required | Can make stuck jobs run indefinitely; fix the script first |
--debug-javascript |
Prints JavaScript warnings and errors | Use while diagnosing a blank chart | Output varies by build and may be incomplete |
--load-error-handling ignore |
Controls handling of page-load errors | Use only when you have a deliberate fallback | Ignoring errors can hide a missing library or data source |
--enable-local-file-access |
Allows local files to be read | Needed when HTML references local assets in builds that block them | Do not expose untrusted paths |
A fixed-delay diagnostic command looks like this:
wkhtmltopdf \
  --enable-javascript \
  --javascript-delay 5000 \
  --debug-javascript \
  report.html report.pdf
Do not treat five seconds as a universal solution. Google library download time, data-source latency, chart complexity, CPU load, and the wkhtmltopdf build all change the required time.
4. Why charts are blank or missing
JavaScript did not execute
Check that the command has JavaScript enabled and that the HTML does not contain syntax unsupported by the old WebKit engine. Run with --debug-javascript and inspect stderr.
The PDF was captured too early
If the HTML looks correct in a normal browser but the PDF contains an empty chart container, the capture likely happened before the loader, data request, or draw operation finished. Add the ready event and use --window-status chart-ready.
The chart has no dimensions
Give the chart container an explicit width and height in CSS or inline HTML. Google’s chart guidance notes that omitting a size can prevent proper rendering. Avoid percentage heights whose parent has no fixed height.
Remote assets or data are unreachable
Verify DNS and outbound network access from the machine running wkhtmltopdf. Check that https://www.gstatic.com/charts/loader.js and every data endpoint are reachable without an interactive login. A page that works in your desktop browser may depend on browser cookies, extensions, a VPN, or a different proxy.
The WebKit engine is too old
The wkhtmltopdf downloads page lists 0.12.6 as the stable series, released June 11, 2020. It is not equivalent to current Chrome. Modern JavaScript syntax, TLS behavior, browser APIs, or Google changes can expose compatibility problems. A historical wkhtmltopdf issue about Google Maps shows this class of failure; it is an adjacent warning, not evidence that every Google Chart fails.
The chart is drawn but clipped
Set a deterministic page width and chart size, then choose a matching paper size or orientation. For wide charts, try --orientation Landscape, a larger --page-width, or CSS that reduces the chart width. Check margins and print-specific CSS.
Fonts or SVG features differ
Install the fonts required by the report on the conversion host. Test SVG-heavy chart types separately because the output depends on the Qt WebKit build and installed font/rendering libraries.
5. A step-by-step troubleshooting checklist
- Open the exact HTML in a supported browser and confirm that the chart appears with the same data and URL.
- Save the HTML and data payload used by the failing job so you can reproduce it without application timing.
- Run
wkhtmltopdf --versionand record the binary, operating system, and package source. - Run with
--enable-javascript --debug-javascriptand capture stderr. - Confirm the chart container has explicit dimensions and is visible when
chart.draw()runs. - Check every external script and data URL from the conversion host.
- Add a page-side readiness value such as
chart-readyand wait with--window-status chart-ready. - Use a short fixed delay only as a comparison test. If changing the delay changes the result, your readiness condition is incomplete or the page is slow.
- Try a static image fallback. If that succeeds, the problem is JavaScript execution, browser compatibility, or timing rather than PDF layout.
- Compare a modern browser-based PDF workflow if the page requires APIs that Qt WebKit cannot provide.
6. Static-image fallback
When JavaScript cannot run reliably during conversion, render the chart before PDF generation and place the resulting PNG or SVG in the HTML. This makes PDF capture deterministic and removes the need for the PDF process to download Google’s loader or query live data.
<div class="chart-frame">
  <img src="file:///srv/report/chart.png" width="900" height="500" alt="Monthly revenue">
</div>
Use a trusted chart-rendering step that has access to the same data, then pass the generated HTML to wkhtmltopdf. If you use SVG, verify that your wkhtmltopdf build preserves it correctly; PNG is often easier to inspect and cache.
7. Choosing between wkhtmltopdf, an image fallback, and a browser renderer
| Approach | JavaScript during PDF capture | Fidelity and timing | Deployment considerations |
|---|---|---|---|
| Keep wkhtmltopdf | Required for a live Google Chart | Can work when the page and chart fit Qt WebKit; readiness must be explicit | Small established command-line workflow, but compatibility must be checked against your build |
| Pre-render a chart image | No | Deterministic capture; interactivity is lost and image resolution must be chosen | Adds a rendering step and storage or temporary-file handling |
| Use a browser-based PDF renderer | Yes, in a modern browser | Better fit for current browser APIs; startup and resource usage may be higher | Requires operating a browser runtime or a hosted browser service |
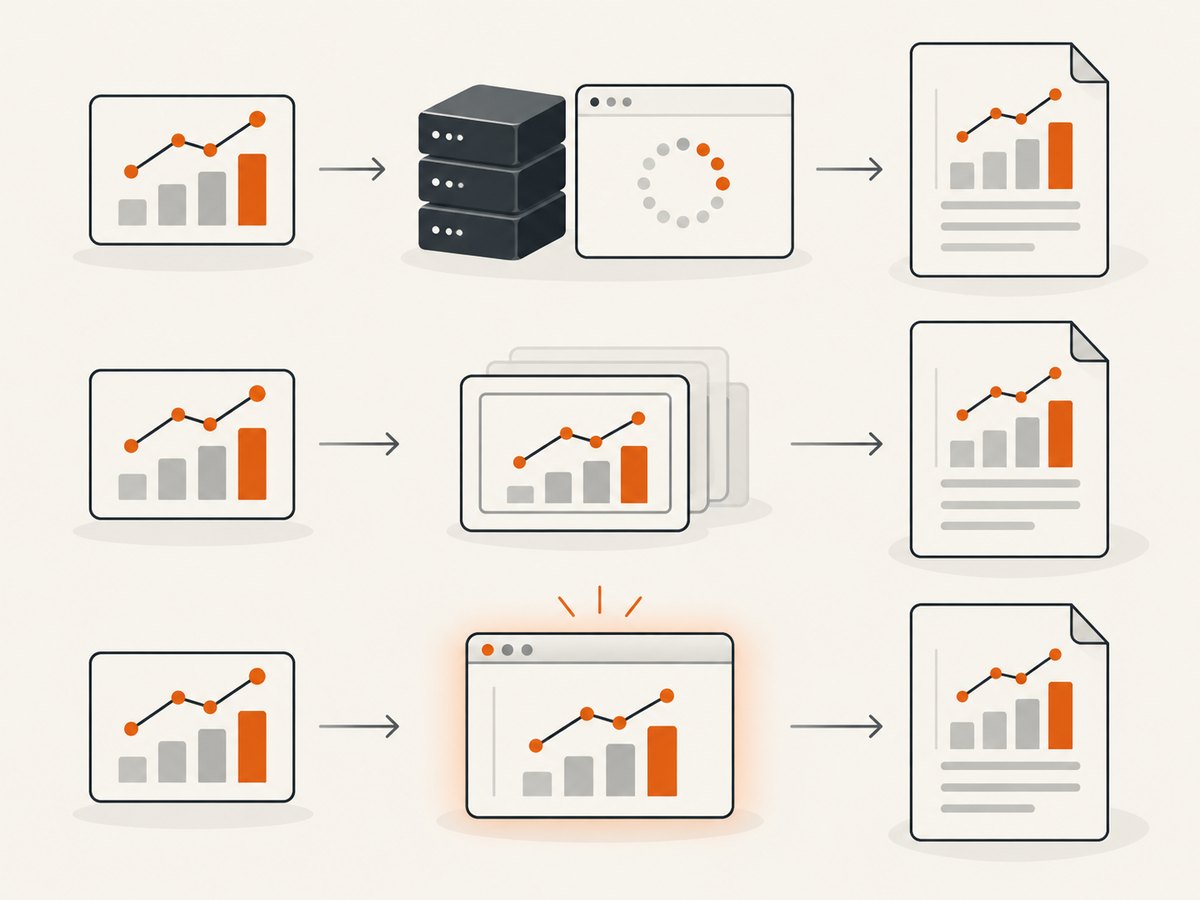
Choose based on JavaScript requirements, chart fidelity, deployment footprint, timing determinism, data access, and how often browser compatibility must be maintained. The available sources do not establish a universal winner or benchmark.
8. Performance, reliability, and cost notes
- Prefer
--window-statusover a long global delay so fast pages finish quickly while slow data loads still have a defined completion condition. - Keep chart data local to the job when possible. Each remote dependency adds DNS, TLS, network, and service-availability failure modes.
- Reuse a stable wkhtmltopdf binary and record its version in build logs. Distribution packages can differ in patches and security settings.
- Set an outer process timeout in your job runner. A page that never sets the expected status must not hold a worker forever.
- Cache downloaded assets or pre-rendered chart images when the same report is generated repeatedly.
- Do not assume a chart that works once is reliable. Run representative pages with slow data, empty data, large data, and failed requests.
- Do not render untrusted HTML or JavaScript directly. The wkhtmltopdf downloads page warns that user-supplied HTML/JavaScript must be sanitized because unsafe input can compromise the server.
9. Or skip the browser setup
ScreenshotNeo is a hosted website screenshot API with a one-request capture flow. It can return PNG, JPEG, WebP, or PDF, and its capture options include full-page screenshots, custom CSS and JavaScript, waits for a selector or delay, custom headers and cookies, device and viewport settings, and PDF paper, margin, landscape, and page-range controls. For AI workflows, its MCP server exposes take_screenshot, get_page_info, and capture_pdf.
Use the same chart page as the target URL:
curl -G "https://api.screenshotneo.com/v1/shot" \
  -d access_key=YOUR_API_KEY \
  --data-urlencode url=https://example.com/report \
  -d format=pdf \
  -o report.pdf
Python:
import requests

r = requests.get(
    "https://api.screenshotneo.com/v1/shot",
    params={
        "access_key": "YOUR_API_KEY",
        "url": "https://example.com/report",
        "format": "pdf",
    },
    timeout=90,
)
r.raise_for_status()
open("report.pdf", "wb").write(r.content)
Node.js:
const q = new URLSearchParams({
  access_key: 'YOUR_API_KEY',
  url: 'https://example.com/report',
  format: 'pdf'
});
const res = await fetch(`https://api.screenshotneo.com/v1/shot?${q}`);
if (!res.ok) throw new Error(`${res.status} ${await res.text()}`);
const buffer = Buffer.from(await res.arrayBuffer());
require('fs').writeFileSync('report.pdf', buffer);
See the ScreenshotNeo API documentation for the full parameter list. Cookie banners, newsletter popups, and chat widgets are removed before the shot. Bot checks, blank pages, timeouts, failed loads, and cache hits are not billed, and the response identifies the page verdict and billing state in X-Page-Verdict and X-Billed headers. There is also an MCP server for AI agents, 1,000 screenshots per month free with no card, and paid plans starting at $5 for 3,000 shots. Create a free ScreenshotNeo account.
10. FAQ
Does adding --javascript-delay 10000 guarantee a chart?
No. It only waits a fixed amount of time. The chart can still fail because of an API error, blocked network request, unsupported browser feature, or missing dimensions.
Should I use --window-status or a delay?
Use a page-side status tied to chart completion when you control the HTML. Keep a bounded outer timeout and use a delay mainly for diagnosis or pages where you cannot add a readiness signal.
Can every Google Chart type be rendered by wkhtmltopdf?
There is no universal guarantee. Results depend on the chart, page code, data source, network access, and the exact wkhtmltopdf build. Test the chart type and data path you actually deploy.
Why does the chart work in Chrome but not in wkhtmltopdf?
Chrome and Qt WebKit do not expose the same JavaScript, TLS, SVG, and browser APIs. A page can be valid in a current browser while relying on capabilities absent from the older engine.
Is a screenshot service the same as a PDF chart renderer?
A hosted browser capture service can render a URL and return a PDF or image, but it does not remove the need to make your chart page load correctly. You still need reachable data and a page that can draw the chart.