How to Render Plotly.js Charts as Images
Export Plotly.js charts to PNG, JPEG, WebP, or SVG in the browser, or render them in automated server-side jobs with Kaleido.
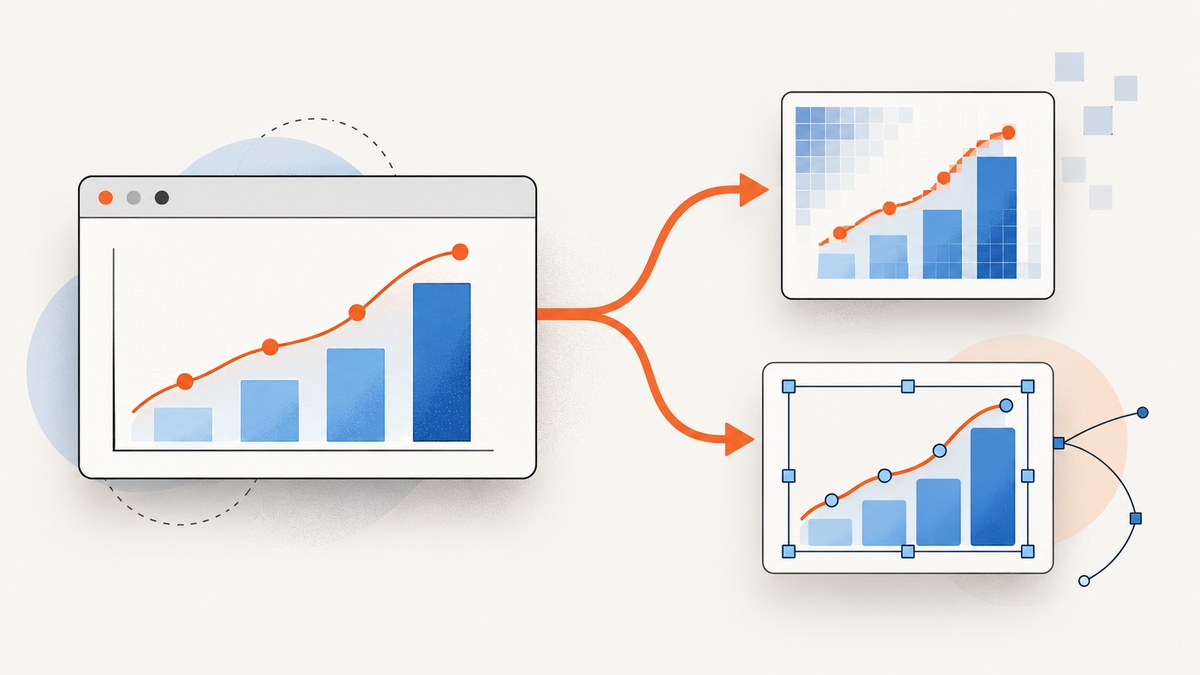
To render a Plotly.js chart as an image in the browser, wait for Plotly.newPlot to finish, then call Plotly.toImage(graphDiv, options). It returns a promise that resolves to a data URL. Use Plotly.downloadImage(graphDiv, options) when you want the browser to download the image directly. Plotly.js supports PNG, JPEG, WebP, and SVG output; full-json returns figure JSON rather than an image.
For a browser export, include Plotly.js, create the chart, and export its graph div. Set explicit dimensions for the placement where the image will be used. For queued or headless server jobs, use Kaleido-backed tooling and make sure a compatible Chrome or Chromium runtime is available. [Plotly static image export](https://plotly.com/javascript/static-image-export/) and the [Plotly.js function reference](https://plotly.com/javascript/plotlyjs-function-reference/) document these APIs and options.
1. Render an existing chart in the browser
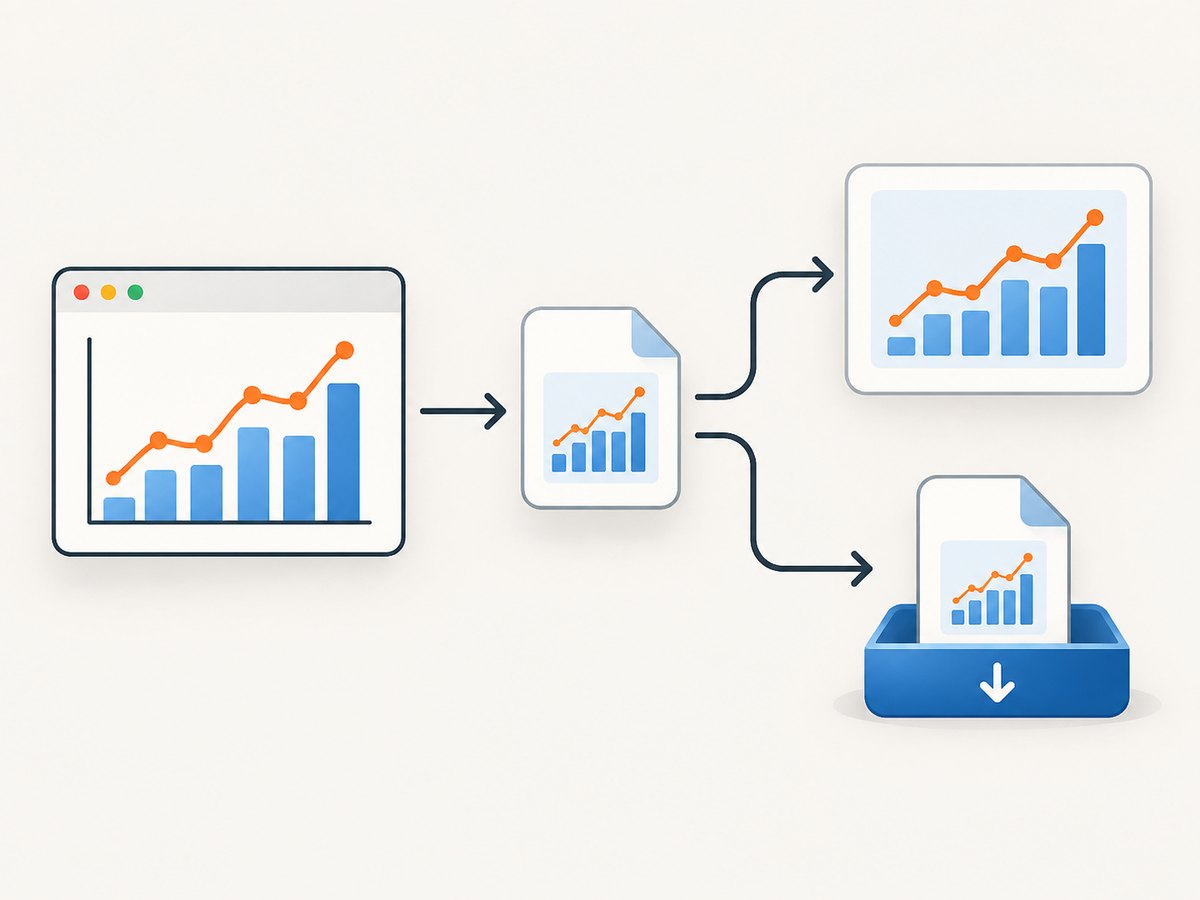
This complete HTML example creates a chart, converts it to PNG, displays the returned data URL in an image element, and provides a separate download button. Save it as plotly-export.html and open it in a browser with an internet connection so the Plotly.js CDN script can load.
<!doctype html>
<html lang="en">
<head>
  <meta charset="utf-8">
  <meta name="viewport" content="width=device-width, initial-scale=1">
  <title>Export a Plotly chart</title>
  <script src="https://cdn.plot.ly/plotly-2.35.2.min.js"></script>
  <style>
    #chart { width: 100%; max-width: 900px; height: 500px; }
    #preview { display: block; max-width: 100%; margin-top: 1rem; }
  </style>
</head>
<body>
  <div id="chart"></div>
  <button id="export">Create PNG preview</button>
  <button id="download">Download PNG</button>
  <img id="preview" alt="Exported chart preview">
  <script>
    const data = [{
      x: ["Jan", "Feb", "Mar", "Apr"],
      y: [12, 19, 14, 23],
      type: "bar"
    }];
    const layout = {
      title: { text: "Quarterly activity" },
      margin: { t: 60, r: 24, b: 48, l: 52 },
      paper_bgcolor: "white",
      plot_bgcolor: "white"
    };

    const chartReady = Plotly.newPlot("chart", data, layout, {
      responsive: true
    });

    document.querySelector("#export").addEventListener("click", async () => {
      const graphDiv = await chartReady;
      const dataUrl = await Plotly.toImage(graphDiv, {
        format: "png",
        width: 1200,
        height: 700
      });
      document.querySelector("#preview").src = dataUrl;
    });

    document.querySelector("#download").addEventListener("click", async () => {
      const graphDiv = await chartReady;
      await Plotly.downloadImage(graphDiv, {
        format: "png",
        width: 1200,
        height: 700,
        filename: "quarterly-activity"
      });
    });
  </script>
</body>
</html>
The key detail is to pass the resolved graph div to the export function. The promise returned by Plotly.newPlot resolves when the plot is ready. Calling export before that point can fail or produce an incomplete result, especially when chart setup is asynchronous.
Use toImage when your code needs the image data
Plotly.toImage produces a data URL, so it suits previews, uploads, and client-side processing. The result begins with a data URL prefix, such as data:image/png;base64,. When sending it to an endpoint that expects raw base64, remove the prefix first. When the receiver accepts a data URL, pass the full string.
async function chartDataUrl(graphDiv, format = "png") {
  return Plotly.toImage(graphDiv, {
    format,
    width: 1200,
    height: 700
  });
}

const graphDiv = await Plotly.newPlot("chart", data, layout);
const url = await chartDataUrl(graphDiv, "webp");
document.querySelector("#preview").src = url;
Use downloadImage for a user-triggered file
Plotly.downloadImage starts a browser download and accepts the same format and dimensions, plus a filename. Use a short filename without an extension; the selected format determines the image extension.
const graphDiv = await Plotly.newPlot("chart", data, layout);
await Plotly.downloadImage(graphDiv, {
  format: "svg",
  width: 1200,
  height: 800,
  filename: "sales-chart"
});
Start downloads from a user action such as a button click. Browser download behavior can be restricted when triggered indirectly or after a long-running chain that is no longer associated with a user gesture.
2. Pick the right output format and dimensions
| Format | Best fit | Limit to remember |
|---|---|---|
| PNG | Default choice for dashboards, documentation, and compatibility. | Raster output; enlarging it later can look soft. |
| JPEG | Photographic or dense raster use when transparency is unnecessary. | Does not preserve transparency. |
| WebP | Modern web delivery where consumers support WebP. | Check that the destination workflow accepts it. |
| SVG | Scalable vector output for editing and print workflows. | WebGL traces can contain raster portions inside the SVG. |
| full-json | Serializing the figure specification with defaults filled in. | This is JSON data, not rendered pixels. |
The documented raster and vector image formats are PNG, JPEG, WebP, and SVG. Plotly.js also accepts full-json for a different purpose. Choose the format based on where the result will go, not just on the chart type. PNG is a safe default for common image embedding; SVG is useful when downstream tools need vector geometry. A chart with WebGL traces—including scattergl, scatter3d, surface, mesh3d, cone, streamtube, splom, or parcoords—may have rasterized content embedded in its SVG export. [Plotly format and WebGL notes](https://plotly.com/javascript/static-image-export/)
width and height control the exported image dimensions in pixels. They are export options, not a guarantee that your existing chart’s labels will fit any arbitrary aspect ratio. If the target is a report column, social preview, or slide, use its intended aspect ratio and inspect the result for clipped labels and legends. For high-density output, export at larger dimensions and downsample in the consuming workflow.
Export when the chart is actually ready
- Wait for
Plotly.newPlotbefore exporting. - If you update the figure, await the update operation before taking the image.
- For asynchronously loaded data, wait until your application has supplied it and the chart has completed rendering.
- Keep the graph div mounted while export runs; do not remove or replace it mid-capture.
- Use explicit dimensions, then check the result at its final size.
3. Export after updates or from a reusable helper
For a chart that changes over time, await the Plotly update before exporting. The precise update method depends on the change: Plotly.react is useful for updating data and layout, while the export call still receives the resulting graph div.
async function renderAndExport(graphDiv, nextData, nextLayout) {
  await Plotly.react(graphDiv, nextData, nextLayout);
  return Plotly.toImage(graphDiv, {
    format: "png",
    width: 1600,
    height: 900
  });
}

const graphDiv = await Plotly.newPlot("chart", initialData, initialLayout);
const updatedImage = await renderAndExport(
  graphDiv,
  updatedData,
  updatedLayout
);
For downloads, keep export parameters in one place so filenames, format, and dimensions stay consistent across buttons and automated paths.
const exportOptions = {
  format: "png",
  width: 1200,
  height: 700
};

async function downloadChart(graphDiv, name) {
  await Plotly.downloadImage(graphDiv, {
    ...exportOptions,
    filename: name
  });
}
4. Render images in automated server-side jobs
Browser export is appropriate when a user has the chart open in a browser. For reports, CI, queues, or services that need images without a user-controlled browser, use Plotly’s static image tooling backed by Kaleido. Plotly’s current documentation describes Kaleido 1.0.0 or later as the static image engine and says Kaleido v1 looks for a compatible Chrome or Chromium already installed on the machine. Plotly documents plotly_get_chrome and plotly.io.get_chrome() as installation routes. [Plotly static export setup](https://plotly.com/python/static-image-export/) [Kaleido project](https://github.com/plotly/Kaleido)
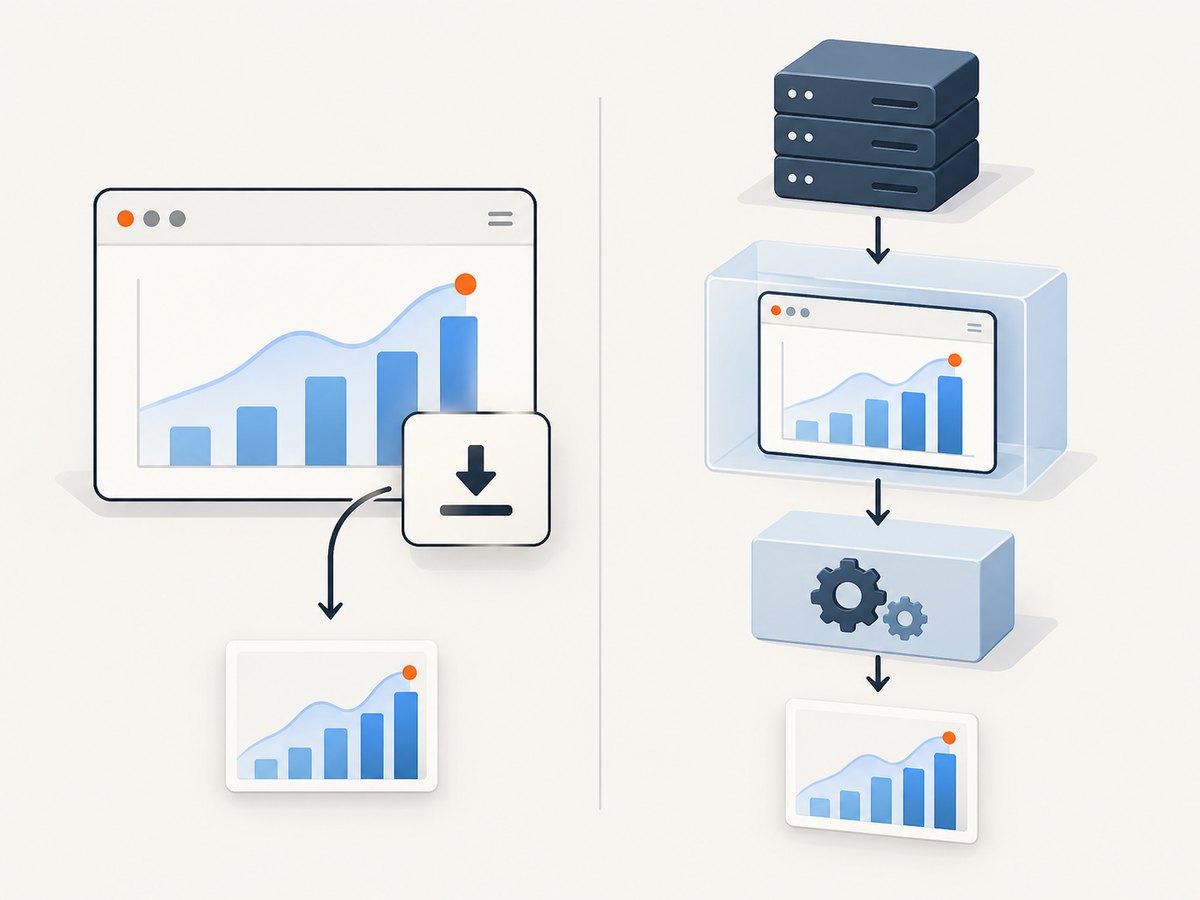
The server-side approach is often simplest through Plotly’s Python package, even when the application that consumes the image is written in another language. This runnable example installs the package and writes a PNG. Install a compatible Chrome or Chromium runtime in the environment as well; installing the Python package alone may not be enough.
python -m pip install plotly kaleido

python -c 'import plotly.express as px; fig = px.bar(x=["Jan", "Feb", "Mar"], y=[12, 19, 14]); fig.write_image("chart.png", width=1200, height=700)'
For repeated exports, the Kaleido project describes reusing a Chrome process with its synchronous server. This can avoid repeatedly starting a browser for each figure. Account for Chrome startup, memory use, and concurrency in the job design. [Kaleido project documentation](https://github.com/plotly/Kaleido)
Browser-side JavaScript versus Kaleido
| Question | Browser export | Server-side static export |
|---|---|---|
| Where does rendering run? | In the page with the existing Plotly.js graph. | In an automated runtime with Kaleido and Chrome/Chromium. |
| How do you receive the output? | Data URL with toImage, or browser download with downloadImage. |
Write an image file or return bytes from your job’s output path. |
| Best fit | Interactive product UI and user-triggered exports. | Scheduled reports, CI, batch work, and server queues. |
| Operational dependency | Plotly.js and a functioning browser page. | Kaleido plus a compatible installed Chrome or Chromium runtime. |
5. Or skip the browser setup
If your goal is an image of a web page that contains a Plotly chart, ScreenshotNeo can capture that page through one API request. It captures the rendered page, so it is useful when you need the chart as it appears in its surrounding page rather than only the chart figure export. It does not replace Plotly’s figure-level export when you specifically need a standalone chart asset.
Use this with a page URL that is publicly reachable by the service. See the ScreenshotNeo API documentation for request options and response details.
curl -G "https://api.screenshotneo.com/v1/shot" -d access_key=YOUR_API_KEY --data-urlencode url=https://stripe.com -o shot.webpScreenshotNeo accepts cookie and consent banners like a visitor and removes 60+ known consent platforms, newsletter popups, and chat widgets before capture; each step can be turned off. Bot checks and CAPTCHAs, blank pages, timeouts, failed loads, and cache hits cost nothing, and response headers report the page verdict and billing status. Its MCP server gives AI agents tools for taking screenshots, getting page information, and capturing PDFs. The free plan includes 1,000 shots per month with no card; paid plans start at $5 for 3,000 shots.
Create a free ScreenshotNeo account to get 1,000 screenshots a month with no card.
6. Troubleshooting common export problems
| Symptom | Likely cause | Fix |
|---|---|---|
toImage rejects or produces no usable image |
The plot is not ready, or the wrong value was passed instead of the graph div. | Await Plotly.newPlot and pass its resolved graph div to the export call. |
| Image omits recent data or layout changes | Export began before the update finished. | Await Plotly.react or the relevant update promise, then export. |
| Labels or legends are clipped | The chosen width, height, margins, or aspect ratio do not fit the figure. | Adjust the layout margins and export dimensions; inspect at the intended output size. |
| SVG contains pixelated regions | The chart uses WebGL traces, which can be rasterized inside SVG. | Use PNG for a fully raster result, or avoid WebGL traces if editable vector geometry is required. |
| Download does not start | The browser may block a download initiated outside a user action. | Call downloadImage from a click handler and handle promise rejection. |
| Server export cannot find Chrome | Kaleido v1 expects a compatible Chrome or Chromium installation. | Install a compatible runtime using the documented setup route and verify it is available to the job process. |
| Server job works locally but fails in CI | The CI image may not include Chrome/Chromium or may differ from the local runtime. | Provision the browser in the CI environment and keep the runtime configuration consistent. |
| Export is slow or memory use rises in a batch | Each job may start browser work, or too many renders may run concurrently. | Bound concurrency and consider Kaleido’s documented reusable Chrome process for repeated exports. |
7. Performance, reliability, and cost
Plotly’s documented export controls are format, width, and height, with filename for direct downloads. Those settings also affect the size and work involved in the output: very large dimensions create more pixels to render and store. Use the dimensions the consumer needs rather than exporting at an arbitrarily huge size. If a high-density image is required, render larger and downsample as part of the delivery pipeline.
For browser reliability, make rendering order explicit: load the figure data, await chart creation or update, then export. Treat the promise as an asynchronous operation and handle failures in the UI. Keep a visible retry path if exporting is user-facing. For server reliability, provision Chrome or Chromium alongside Kaleido, test that dependency in the same container or CI image used in production, and constrain concurrency to match available resources. A repeated export service can use the reusable Chrome process described by Kaleido.
Local browser and Kaleido rendering do not have a ScreenshotNeo API charge, but they do consume the user’s or server’s compute, memory, storage, and maintenance time. Server-side jobs also require you to manage the browser runtime. If the task is a screenshot of a rendered web page, ScreenshotNeo charges only clean shots; bot checks/CAPTCHAs, blank pages, timeouts, failed loads, and cache hits are not billed. Current plan allowances and prices are Free for 1,000 shots/month, Starter $5 for 3,000, Growth $15 for 15,000, Pro $39 for 60,000, Scale $99 for 250,000, and Business $249 for 1,000,000. Yearly billing gives two months free, and every feature is on every plan.
8. Frequently asked questions
Can I export a Plotly.js chart without downloading it?
Yes. Use Plotly.toImage and assign the returned data URL to an image element or send it to application code.
Can I save a Plotly.js chart as an SVG?
Yes. Set format: "svg". WebGL-based traces may still include raster regions inside the SVG.
Does full-json make a picture?
No. It returns the figure specification with defaults filled in. Choose PNG, JPEG, WebP, or SVG for image output.
Do I need Chrome for browser export?
The browser workflow runs in the user’s existing browser. Kaleido v1 server-side static export expects a compatible Chrome or Chromium runtime.
Can a page screenshot replace Plotly’s image export?
For a screenshot of the complete web page, yes. For a standalone chart file with Plotly’s figure-level export behavior, use toImage, downloadImage, or a static-image renderer.


