How to Enable Remote Debugging with Ruby, Selenium, and Headless Chrome
Enable Chrome DevTools for Ruby Selenium, find the debugging endpoint, fix common errors, and capture screenshots without browser setup.

Direct answer: pass Chrome’s headless and remote debugging flags through Selenium’s Chrome options, keep the driver session alive, then connect from another Chrome window through chrome://inspect. Use --remote-debugging-port=0 when you want Chrome to choose an available port and report it.
This guide covers the complete Ruby setup, endpoint discovery, fixed and automatic ports, version checks, troubleshooting, reliability, and a browser-free screenshot option.
What remote debugging does
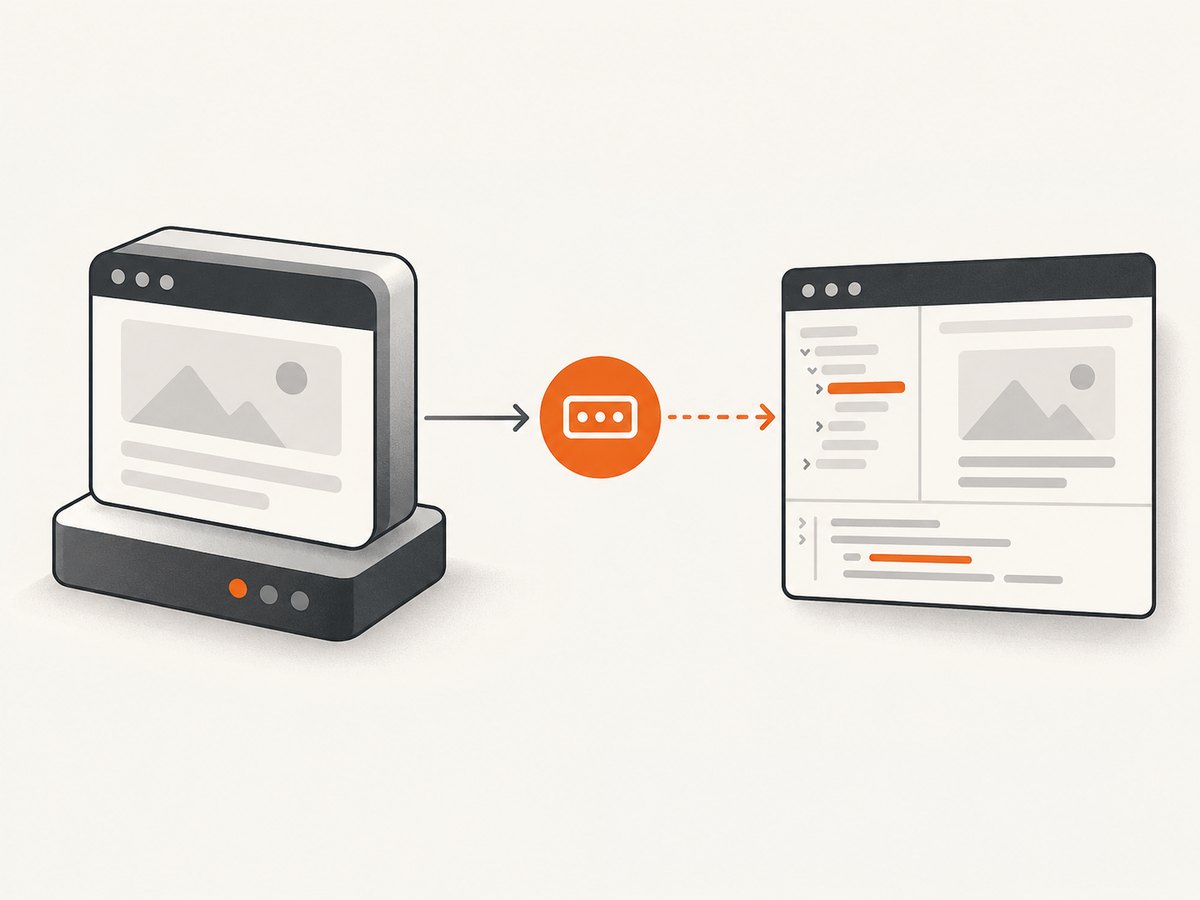
Remote debugging exposes Chrome’s DevTools Protocol endpoint while Selenium controls the browser. A second Chrome instance can attach to that endpoint so you can inspect the DOM, console, network requests, storage, and performance data in a normal DevTools UI. Headless Chrome still has a debuggable target; it simply has no visible browser window.
Prerequisites
- Ruby and the
selenium-webdrivergem. - Chrome or Chromium and ChromeDriver available to the process.
- A separate regular Chrome installation for
chrome://inspect.
Selenium’s Chrome documentation says Selenium 4 is compatible with Chrome v75 and greater and warns that Chrome and ChromeDriver must match on their major version.
Enable remote debugging in Ruby
1. Install Selenium
gem install selenium-webdriver2. Launch headless Chrome with an automatic port
require 'selenium-webdriver'

options = Selenium::WebDriver::Chrome::Options.new
options.add_argument('--headless=new')
options.add_argument('--remote-debugging-port=0')

driver = Selenium::WebDriver.for(:chrome, options: options)

begin
  driver.navigate.to('https://example.com')
  puts "Inspect Chrome's reported DevTools endpoint or DevToolsActivePort file"
  puts 'Leave this process running while you inspect the page. Press Enter to quit.'
  STDIN.gets
ensure
  driver.quit
end
The --headless=new spelling is commonly shown in Selenium examples. Chrome’s headless debugging documentation also demonstrates --headless; use the spelling supported by the Chrome release in your environment.
3. Find and open the endpoint
- Read Chrome’s stderr output for the selected debugging port, or inspect the
DevToolsActivePortfile in the temporary browser profile. - In a separate regular Chrome window, open
chrome://inspect. - Choose Configure…, add the reported host and port, such as
localhost:49152, and select the target page. - Keep the Ruby process running. Calling
driver.quitcloses Chrome and removes the target.
With a fixed port, the DevTools Protocol reference documents http://localhost:9222/json/version as an endpoint that returns the browser WebSocket URL in webSocketDebuggerUrl. Do not assume port 9222 when you used port zero.
Automatic port versus fixed port
| Choice | Argument | Use it when | Trade-off |
|---|---|---|---|
| Automatic | --remote-debugging-port=0 |
CI, parallel runs, or unknown port availability | You must read the reported port or file |
| Fixed | --remote-debugging-port=9222 |
A local workflow expects a stable endpoint | The port can already be occupied |
Fixed-port Ruby example
require 'selenium-webdriver'

options = Selenium::WebDriver::Chrome::Options.new
options.add_argument('--headless=new')
options.add_argument('--remote-debugging-port=9222')

driver = Selenium::WebDriver.for(:chrome, options: options)
begin
  driver.navigate.to('https://example.com')
  puts 'Open chrome://inspect and configure localhost:9222'
  puts 'Browser metadata: http://localhost:9222/json/version'
  STDIN.gets
ensure
  driver.quit
end
Only bind or forward a debugging port where you control access. CDP can expose powerful browser actions.
Useful Selenium and Chrome options
| Option | Purpose |
|---|---|
--headless=new or --headless |
Run without a visible browser window; confirm syntax against your Chrome version. |
--remote-debugging-port=0 |
Ask Chrome to select a free port. |
--remote-debugging-port=9222 |
Listen on a known port. |
--user-data-dir=/path/to/profile |
Use a known writable profile so you can locate DevToolsActivePort; use a separate profile per concurrent run. |
--window-size=1440,1000 |
Make responsive layout inspection deterministic. |
Selenium’s Ruby Chromium options API also exposes debugger_address. That is relevant when investigating an attach-to-existing-browser design, but attach behavior depends on the exact gem, browser, and driver setup.
Inspecting a session step by step
- Start the Ruby script and navigate to the page.
- Capture the host and port printed by Chrome, or read the two lines in
DevToolsActivePort. - Open
chrome://inspectin regular Chrome and configure that host and port. - Click inspect beside the target and use Sources, Console, Network, Application, and Performance.
- Call
driver.quitwhen finished.
Diagnostic checklist
- Confirm Chrome and ChromeDriver are available to the process.
- Compare their major versions.
- Try
--headlessif--headless=newis rejected. - Use a writable, unique
--user-data-dirin containers or parallel jobs. - Keep the Ruby process alive while DevTools is attached.
- For a fixed port, check that no other process owns it.
Troubleshooting common errors
| Symptom | Cause | Fix |
|---|---|---|
SessionNotCreatedError |
ChromeDriver and Chrome major versions differ. | Install a matching browser and driver pair. |
| Address already in use | A fixed debugging port is occupied. | Stop the owner, select another port, or use port zero. |
No target in chrome://inspect |
Wrong host or port, Chrome exited, or the script quit. | Read the current endpoint and keep the session alive. |
DevToolsActivePort is missing |
Chrome failed before writing it, the profile is not writable, or you checked the wrong profile. | Set a writable unique --user-data-dir, inspect stderr, and verify the remote-debugging flag. |
| Chrome exits in CI | Sandbox, permissions, display, or profile-lock constraints. | Use headless mode and a writable unique profile; fix the startup error in logs. |
| Blank or loading page | Inspection began before navigation settled or the page failed. | Inspect Network and Console and add an explicit Selenium wait. |
Performance and reliability notes
- Port selection does not make page loads faster; it changes endpoint allocation.
- Port zero is useful for parallel jobs because each instance receives a different available port.
- A fixed port simplifies scripts but requires collision handling and access controls.
- Use one temporary profile per concurrent browser to avoid locks and mixed cookies.
- Store the endpoint with a run identifier so you connect to the intended session.
- Close sessions in an
ensureblock to avoid orphaned Chrome processes.
Or skip the browser setup
If your goal is a clean screenshot rather than interactive DevTools inspection, ScreenshotNeo provides a single GET request for PNG, JPEG, WebP, or PDF. See the ScreenshotNeo API documentation.
curl -G "https://api.screenshotneo.com/v1/shot" -d access_key=YOUR_API_KEY --data-urlencode url=https://stripe.com -o shot.webpimport requests
r = requests.get("https://api.screenshotneo.com/v1/shot", params={"access_key": "YOUR_API_KEY", "url": "https://stripe.com"}, timeout=90)
open("shot.webp", "wb").write(r.content)const q = new URLSearchParams({ access_key: 'YOUR_API_KEY', url: 'https://stripe.com' });
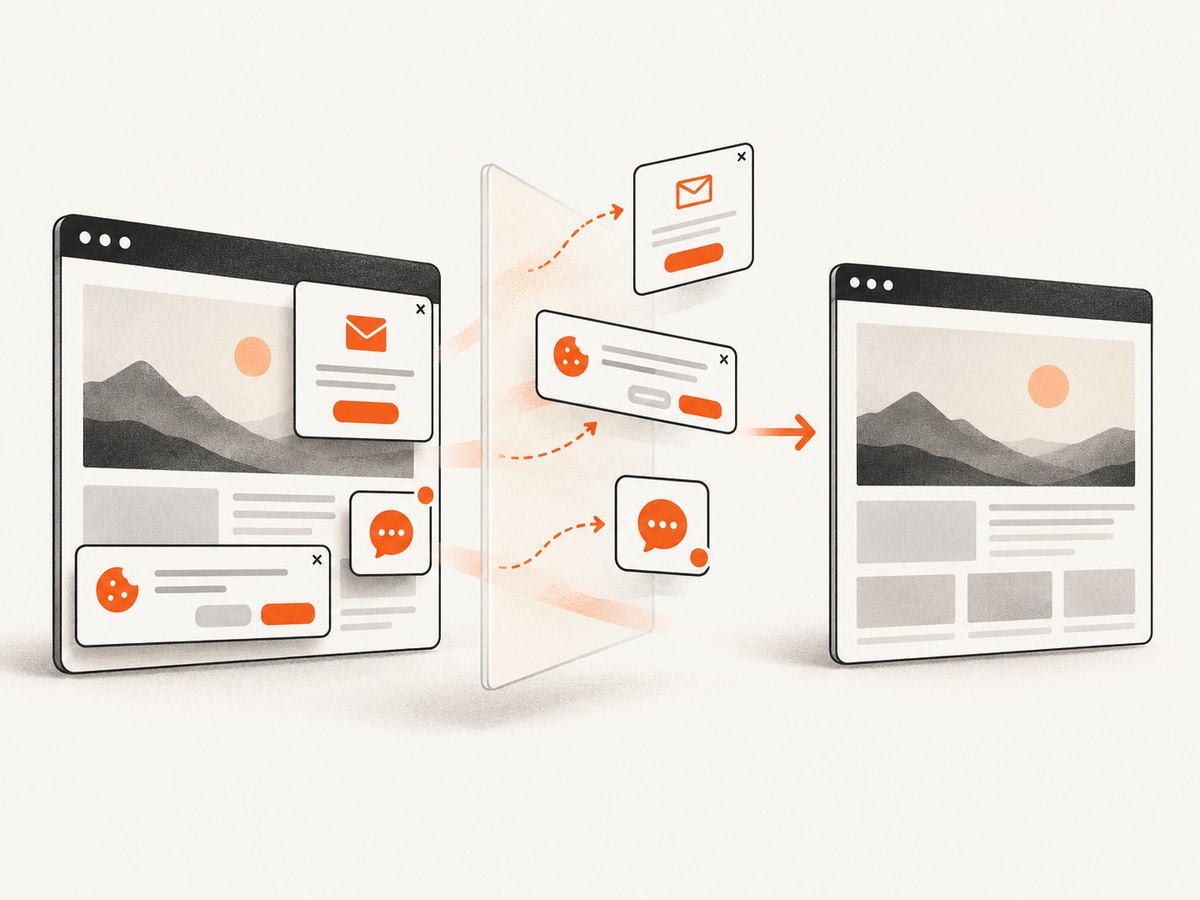
const res = await fetch(`https://api.screenshotneo.com/v1/shot?${q}`);Cookie and consent banners are accepted and removed before the shot, along with more than 60 known consent platforms, newsletter popups, and chat widgets. Bot checks, blank pages, timeouts, failed loads, and cache hits are not billed, and each response reports the result in X-Page-Verdict and X-Billed headers. ScreenshotNeo also has an MCP server with take_screenshot, get_page_info, and capture_pdf for Claude, Cursor, and other MCP clients.
The Free plan includes 1,000 screenshots a month with no card; paid plans start at $5 for 3,000 shots. Create a free ScreenshotNeo account.
FAQ
How do I enable remote debugging in headless Chrome?
Add --remote-debugging-port=0 when Selenium launches Chrome, then connect to the reported endpoint from chrome://inspect.
Can I connect to Chrome on port 9222?
Yes. Launch with --remote-debugging-port=9222, configure localhost:9222, and query /json/version for the WebSocket URL.
Where is DevToolsActivePort?
It is written inside the browser profile directory. With a custom --user-data-dir, inspect that directory after Chrome starts.
Can Selenium attach to an already running Chrome?
The Ruby Chromium options API includes debugger_address, but attach-mode constraints vary by browser and gem versions.
Why does ChromeDriver fail when Chrome versions differ?
Selenium’s documentation states that Chrome and ChromeDriver must match on their major version.


