How to Run Playwright Inspector Inside WSL2
Run Playwright Inspector in WSL2 with the right debug command, WSLg setup, browser dependencies, troubleshooting, and practical alternatives.
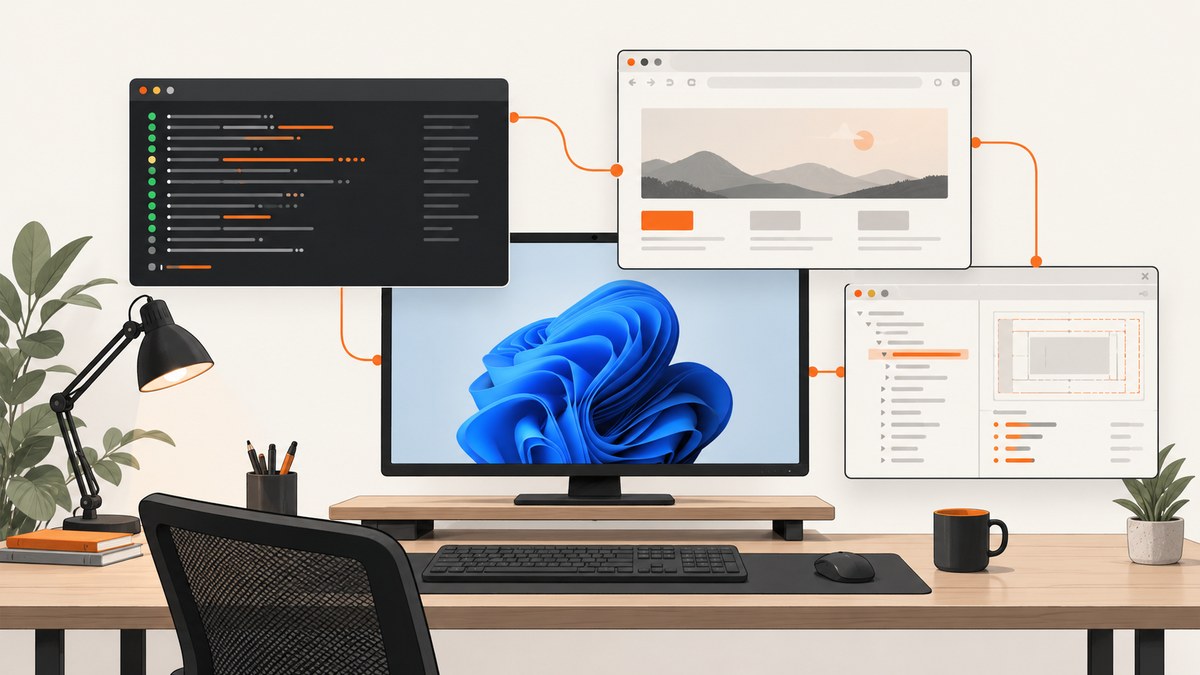
From a WSL2 shell in a Playwright Test project, run npx playwright test --debug. Playwright starts its Inspector and a headed browser, then runs the test with interactive debugging defaults. For the windows to appear on your Windows desktop, the Linux distribution must run under WSL2 and Windows must provide WSLg GUI support.
This guide explains the complete setup, how to focus debugging on one test, what to do when the Inspector window does not appear, and when Playwright UI Mode is a better fit. It also includes a browser-free ScreenshotNeo option for generating screenshots from a URL.
1. Check the WSL2 and Windows prerequisites
WSLg is Microsoft’s path for displaying Linux GUI applications on the Windows desktop. Microsoft documents Linux GUI applications for WSL2, Windows 10 build 19044 or later, and Windows 11. A compatible graphics driver is also part of the documented virtual GPU prerequisites. Linux GUI support depends on the Windows desktop; it is not a complete Linux desktop environment.
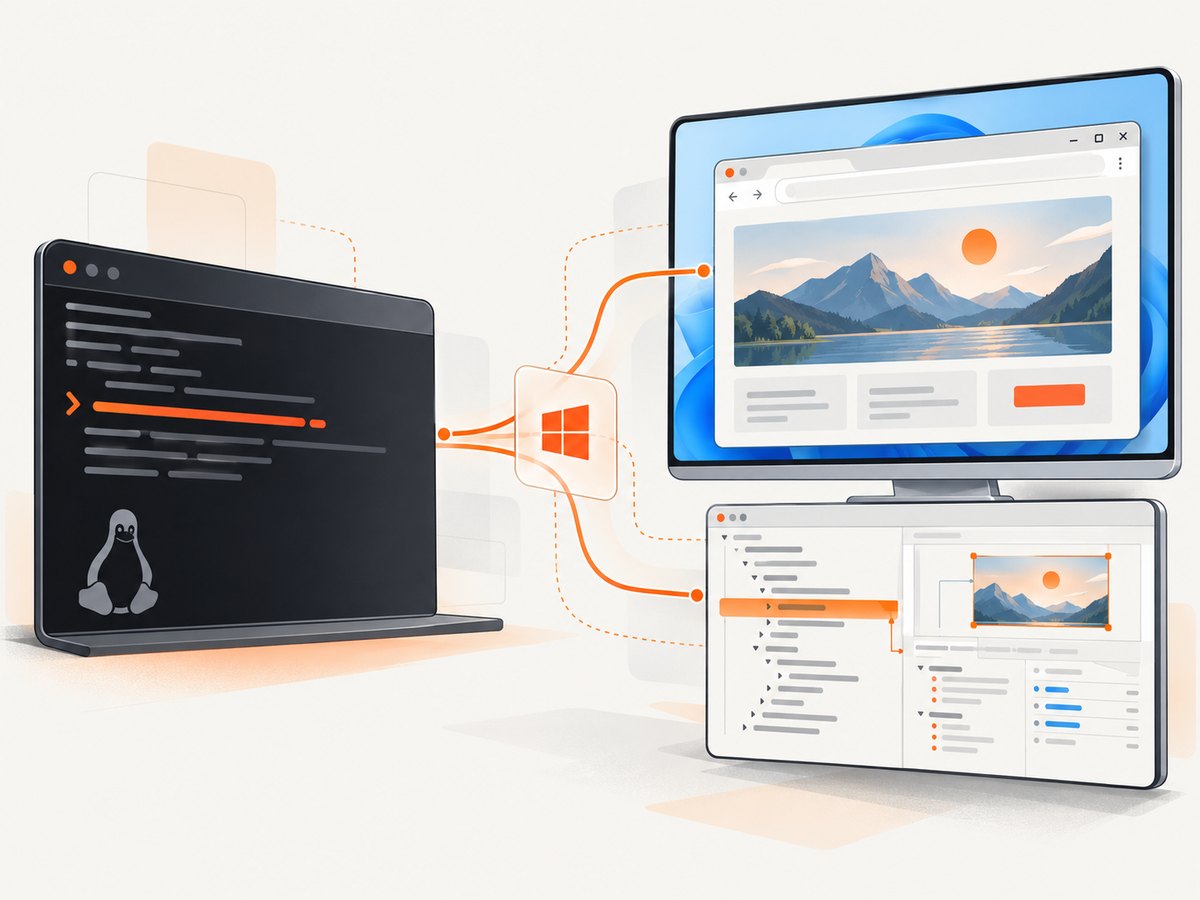
Confirm that your distribution uses WSL2
Run this command from Windows PowerShell or Command Prompt:
wsl -l -vFind the distribution that contains your Playwright project. Its VERSION column should be 2. If it is configured as version 1, convert it from an elevated PowerShell window:
wsl --set-version <distribution-name> 2Replace <distribution-name> with the name shown by wsl -l -v. Microsoft’s WSL GUI guidance states that Linux GUI applications are supported only with WSL2, not with a distribution configured for WSL1.
Check Windows and WSLg
In Windows, open Settings → System → About and verify that you are on Windows 11 or Windows 10 build 19044 or later. If WSLg is stale or missing, update and restart the WSL virtual machine from elevated PowerShell:
wsl --update
wsl --shutdown
Start your distribution again after wsl --shutdown. If GUI applications still cannot open, install the graphics driver recommended for your GPU by your system manufacturer and follow Microsoft’s WSL GUI troubleshooting guidance. A cannot open display error generally indicates a WSLg, Windows build, driver, or environment problem rather than a Playwright test failure.
2. Install Playwright and its browser inside WSL
Open the WSL distribution that contains your project and use the project-local Playwright installation. In a Node.js Playwright Test project, dependencies are normally installed with:
npm install
npx playwright install
To install only Chromium:
npx playwright install chromiumLinux browser libraries may be absent on a new distribution. Playwright can install the selected browser and its Linux dependencies together:
npx playwright install --with-deps chromiumUse the browser name that your project needs. Installing the browser in Windows does not install the Linux browser binary that Playwright launches from WSL.
Verify the project before opening Inspector
A minimal Playwright Test project can contain this test in tests/example.spec.ts:
import { test, expect } from '@playwright/test';

test('home page has a title', async ({ page }) => {
  await page.goto('https://example.com');
  await expect(page).toHaveTitle(/Example Domain/);
});
Run it normally first. This separates an ordinary test or browser-installation problem from a GUI problem:
npx playwright testIf this command fails because a browser is missing, install the browser before trying debug mode. If it passes but no Inspector appears, continue with the WSLg checks above and the troubleshooting section below.
3. Start Playwright Inspector in WSL2
From the project directory in WSL, run:
npx playwright test --debugThis debug shortcut enables the equivalent of PWDEBUG=1 and applies interactive defaults: no test timeout, one failure maximum, headed browser mode, and one worker. The Inspector window and the browser window should open on the Windows desktop.
Use the Inspector to step over actions, pause and resume execution, pick locators, edit locators live, and read actionability logs. The browser is headed so you can see the page at the point where the test is paused.
Debug one test file
Pass a test file after the command:
npx playwright test tests/example.spec.ts --debugYou can target a particular test line by adding a line suffix to the file path, as documented by Playwright:
npx playwright test tests/example.spec.ts:4 --debugThe line number should point to the test declaration or a location Playwright can use to select the test. This is useful in a large suite where running every test would slow down an investigation.
Use the environment variable form
The equivalent environment-variable workflow is:
PWDEBUG=1 npx playwright test tests/example.spec.tsTo pause at a deliberate point in code, add page.pause():
import { test } from '@playwright/test';

test('inspect a checkout page', async ({ page }) => {
  await page.goto('https://example.com');
  await page.pause();
  await page.getByRole('link').first().click();
});
Then run the test with PWDEBUG=1 or --debug. The pause gives you a predictable place to inspect the page rather than stopping only when an action fails.
Browser developer tools mode
Playwright also documents PWDEBUG=console for a workflow involving browser developer tools:
PWDEBUG=console npx playwright test tests/example.spec.tsUse this when you need browser-console inspection in addition to Playwright’s test controls. The normal Inspector flow is usually the faster choice for stepping through actions and refining locators.
4. Inspector versus Playwright UI Mode
| Use case | Inspector | UI Mode |
|---|---|---|
| Start command | npx playwright test --debug |
npx playwright test --ui |
| Best for | Pausing one test and stepping through actions | Exploring a suite visually and repeatedly running tests |
| Locator work | Picker and live locator editing during a paused test | Interactive locator picker while browsing test results |
| History and traces | Focused actionability logs | Broader view of what happened before, during, and after steps |
| WSL2 display requirement | Headed GUI through WSLg | Headed GUI through WSLg |
Choose Inspector when you already know which test and action need investigation. Choose UI Mode when you want a broader interactive test-running interface, watch mode, locator picking, and traces across the suite. Both require WSLg when launched from WSL with visible windows.
5. What happens when the Inspector window does not appear?
Error: cannot open display
Cause: WSLg is unavailable, the distribution is WSL1, Windows is too old, or the graphics setup is incomplete.
Fix:
- Run
wsl -l -vin Windows and confirm the project distribution is version 2. - Confirm Windows 11 or Windows 10 build 19044 or later.
- Run
wsl --update, thenwsl --shutdownfrom elevated PowerShell. - Restart the distribution and retry
npx playwright test --debug. - Check the GPU driver and Microsoft’s WSLg display troubleshooting instructions.
The browser binary is missing
Typical message: Playwright cannot find an executable or asks you to run playwright install.
Fix: Install the browser from inside WSL:
npx playwright install chromiumIf shared libraries are missing, use:
npx playwright install --with-deps chromiumThe test runs but the page is blank
Possible causes: the page has not finished loading, the test navigated to the wrong URL, a site blocks automation, or the browser closed after an earlier failure.
Fix: Run with Inspector, pause immediately after navigation, and inspect the URL and page content. Add an explicit assertion or wait for a meaningful selector rather than relying on a fixed delay:
await page.goto('https://example.com');
await page.getByRole('heading', { name: 'Example Domain' }).waitFor();
await page.pause();
The Inspector opens, but execution races past the interesting action
Add await page.pause() before the action you want to inspect, or target the test and line directly. Debug mode also sets a practical interactive configuration with one worker and no timeout, but it does not know which application state matters to you.
Installation works in Windows but not WSL
Playwright installations are environment-specific. Run npm install, npx playwright install, and any dependency installation inside the WSL project environment. Confirm that which node and node --version point to the Node.js installation used by the WSL project.
6. Reliability and performance while debugging
- Keep debug runs narrow. Select one file or test so the headed browser reaches the failure quickly.
- Use a stable pause point. A selector-based wait or
page.pause()is easier to reproduce than repeated arbitrary delays. - Use one worker for investigation. Debug mode does this automatically, preventing multiple headed browsers from competing for attention.
- Separate GUI failures from test failures. First run
npx playwright testnormally. Then debug the same test. This identifies whether the issue is WSLg or application behavior. - Expect slower interactive runs. Headed rendering, Inspector controls, and pauses add overhead. Debug settings are for diagnosis, not throughput measurement.
- Do not treat WSLg as a production display server. It provides Linux GUI application integration on the Windows desktop. CI jobs usually need their own browser strategy, often headless, unless a documented virtual display is configured.
7. Or skip the browser setup
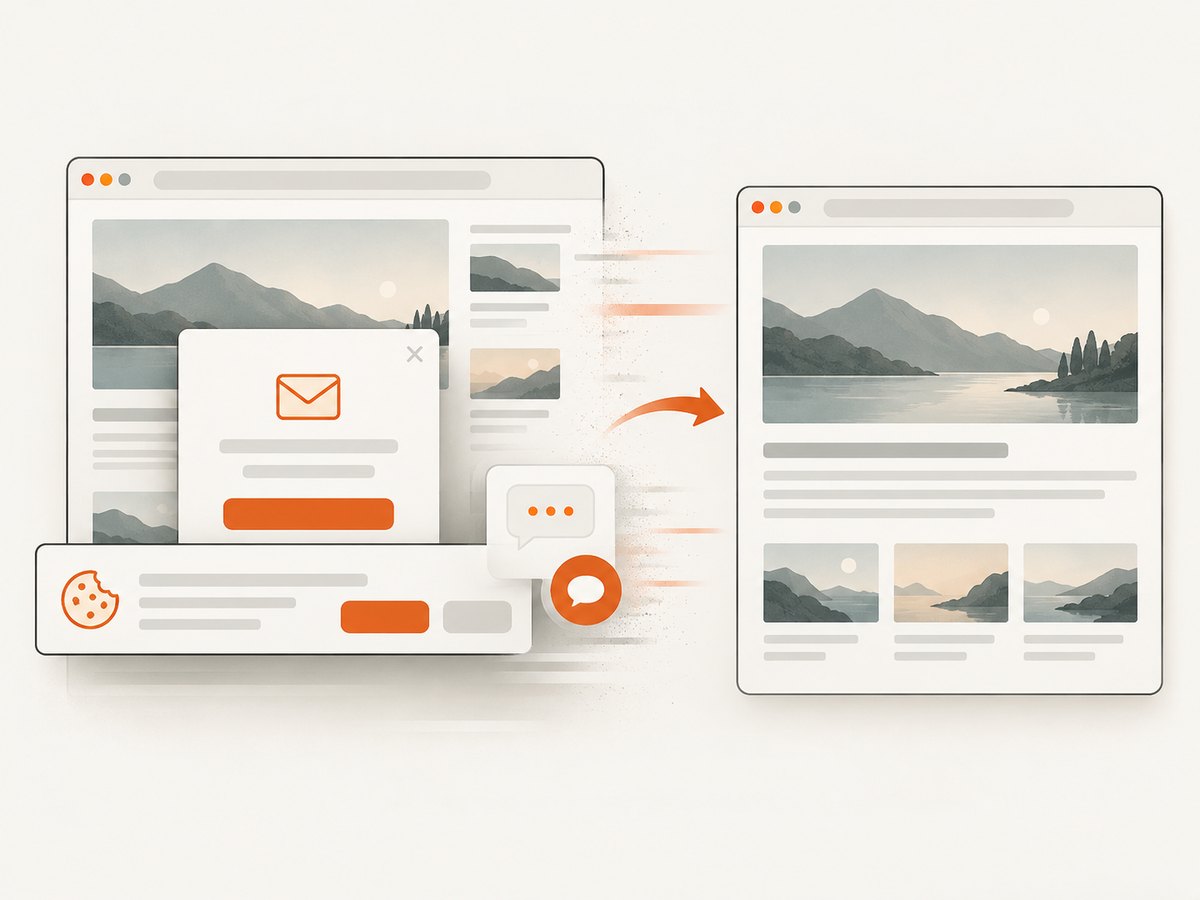
If your goal is to capture a page image rather than step through a Playwright test, ScreenshotNeo provides a single HTTP request. Its API accepts a URL and returns PNG, JPEG, WebP, or PDF. Cookie and consent banners, newsletter popups, and chat widgets are removed before capture; bot checks, blank pages, timeouts, failed loads, and cache hits are not billed.
See the ScreenshotNeo API documentation for the complete option list.
cURL
curl -G "https://api.screenshotneo.com/v1/shot" \
  -d access_key=YOUR_API_KEY \
  --data-urlencode url=https://stripe.com \
  -o shot.webp
Python
import requests

r = requests.get(
    "https://api.screenshotneo.com/v1/shot",
    params={"access_key": "YOUR_API_KEY", "url": "https://stripe.com"},
    timeout=90,
)
r.raise_for_status()
open("shot.webp", "wb").write(r.content)
Node.js
const q = new URLSearchParams({
  access_key: 'YOUR_API_KEY',
  url: 'https://stripe.com'
});
const res = await fetch(`https://api.screenshotneo.com/v1/shot?${q}`);
if (!res.ok) throw new Error(`HTTP ${res.status}`);
const fs = await import('node:fs/promises');
await fs.writeFile('shot.webp', Buffer.from(await res.arrayBuffer()));
For operational workflows, ScreenshotNeo also supports full-page captures with lazy images loaded, CSS-selector element captures, dark mode, device presets, custom viewports, retina scale, custom CSS and JavaScript, click actions, selector waits, network-idle waits, ad and tracker blocking, headers, cookies, user agents, Authorization, timezone, geolocation, transparent backgrounds, resizing, configurable caching TTLs, signed links, asynchronous jobs with signed webhooks, bulk capture for up to 100 URLs per call, a usage API, and an OpenAPI specification. PDF output includes paper size, margins, landscape mode, and page ranges.
Every response includes X-Page-Verdict and X-Billed headers so you can distinguish a clean billed capture from a bot check, blank page, failed load, or cache hit. An MCP server provides take_screenshot, get_page_info, and capture_pdf tools for Claude, Cursor, and other MCP clients.
The free plan includes 1,000 screenshots per month with no card. Paid plans start at $5 for 3,000 shots; yearly billing gives two months free, and every feature is available on every plan. Create a free ScreenshotNeo account.
8. Short FAQ
Can I run Inspector from WSL1?
No. Microsoft documents Linux GUI application support for WSL2. Convert the distribution to version 2 before using a visible Inspector window.
Does --debug run the browser headless?
No. Debug mode enables headed browser execution so the Inspector and browser can be used interactively.
Should I use UI Mode or Inspector for a locator failure?
Use Inspector for a focused pause and step-by-step actionability inspection. Use UI Mode when you need to browse tests, watch changes, and inspect traces across a broader session.
Why does a normal test pass while debug mode fails?
Compare the environments and timing. Debug mode changes execution to headed, one worker, no timeout, and interactive pauses. A display or WSLg problem can affect debug mode even when the test itself is valid.
Can ScreenshotNeo replace Playwright Inspector?
No. Inspector is for debugging Playwright tests and locators. ScreenshotNeo is for retrieving rendered screenshots or PDFs through an API or MCP tools when you do not need to step through browser code.


