How to Save Chrome Performance Timelines with Puppeteer
Record Chrome performance timelines in Puppeteer, save trace.json, open it in DevTools, capture screenshots, tune categories, and troubleshoot large or sensitive traces.
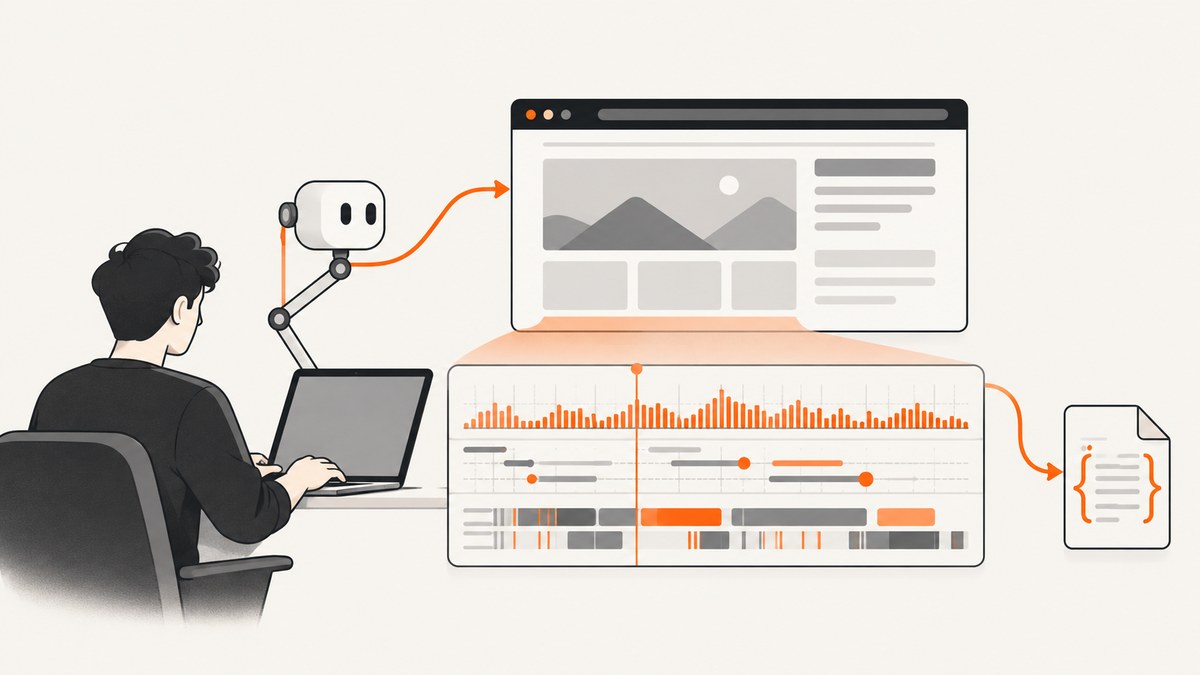
Use Puppeteer’s page.tracing.start() and page.tracing.stop() around the navigation or interaction you want to study. Set a file path to write trace.json, then open that file in Chrome DevTools’ Performance panel or the Chrome timeline viewer.
A minimal recording looks like this:
import puppeteer from 'puppeteer';

const browser = await puppeteer.launch();
const page = await browser.newPage();

await page.tracing.start({ path: 'trace.json' });
await page.goto('https://example.com');
await page.tracing.stop();

await browser.close();
The useful trace is the interval between start and stop. Start immediately before the workload and stop as soon as it finishes, otherwise browser startup, unrelated requests, or teardown can obscure the activity you are trying to diagnose.
What a Puppeteer trace contains
Puppeteer asks Chromium’s tracing machinery, through the Chrome DevTools Protocol, to record timestamped browser events. DevTools can display those events as main-thread work, scripting, rendering, painting, frame activity, network-related timing, and (when enabled) captured visual frames.
Puppeteer’s official tracing API documents the pair of methods as a way to create a trace file that can be opened in Chrome DevTools or the timeline viewer. The API is part of the same automation script that performs navigation and interactions, so the trace can cover a reproducible user journey instead of a manually repeated recording.
By default, Puppeteer records categories such as devtools.timeline, v8.execute, top-level tasks, console and user-timing events, latency information, timeline stack data, and the disabled-by-default V8 CPU profiler. The exact category set is controlled by Puppeteer and Chromium versions; specify categories when you need a narrower or custom recording.
Install Puppeteer and create a complete trace script
1. Create a project
mkdir puppeteer-trace
cd puppeteer-trace
npm init -y
npm install puppeteer
Use an ES module file named record-trace.mjs. The script below records a page load, waits for network idle, performs an example interaction when a matching element exists, and always closes the browser.
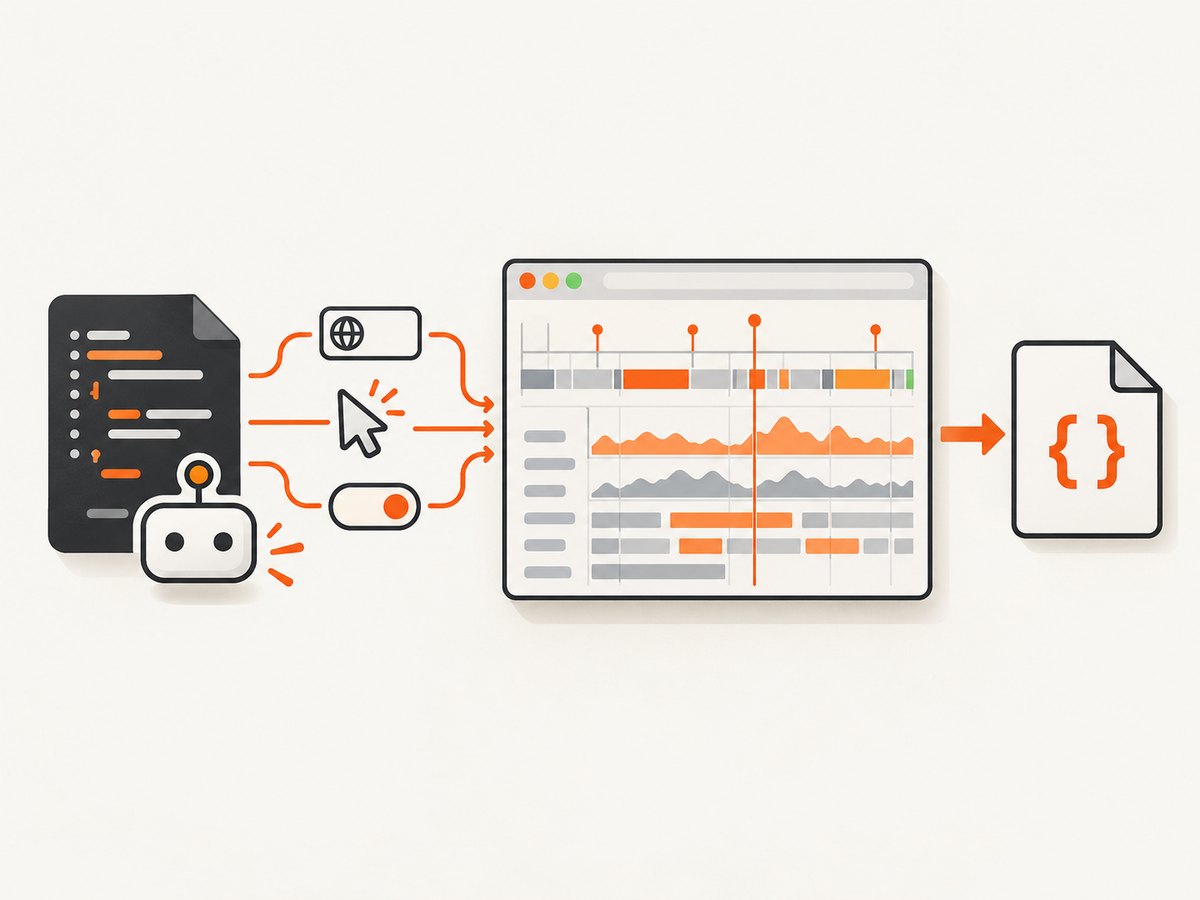
import puppeteer from 'puppeteer';

const url = process.argv[2] ?? 'https://example.com';
const browser = await puppeteer.launch();
const page = await browser.newPage();

try {
  await page.setViewport({ width: 1440, height: 900, deviceScaleFactor: 1 });

  await page.tracing.start({
    path: 'trace.json',
    screenshots: false,
  });

  await page.goto(url, {
    waitUntil: 'networkidle0',
    timeout: 60_000,
  });

  // Add the interactions you want to profile here.
  const button = await page.$('[data-demo-action]');
  if (button) {
    await button.click();
    await page.waitForTimeout(500);
  }

  await page.tracing.stop();
  console.log('Wrote trace.json');
} finally {
  await browser.close();
}
Run it with:
node record-trace.mjs https://example.comThe resulting file is JSON trace data. If your application exits unexpectedly before tracing.stop(), the file may be incomplete, so keep the stop call in a controlled shutdown path for long-running jobs.
Tracing options you should know
| Option | What it does | When to use it |
|---|---|---|
path |
Writes the trace to a file. | Use for DevTools inspection, CI artifacts, or sharing. |
screenshots |
Adds visual frames to the trace. The default is false. |
Enable when layout, paint, or visual jank matters. |
categories |
Overrides the tracing category list. | Reduce noise or focus on a particular subsystem. |
bufferSize |
Controls the trace buffer size when supported by the Chromium/Puppeteer version. The documented default is 200 MB (200,000 KB) when unspecified or zero. | Increase only when a long or event-heavy recording is being truncated. |
Capture screenshots in the timeline
await page.tracing.start({
  path: 'trace-with-frames.json',
  screenshots: true,
});

await page.goto('https://example.com', { waitUntil: 'networkidle0' });
await page.tracing.stop();
Screenshot frames make it possible to correlate a long task or paint event with what the user saw. They also increase trace size and can expose page content, so keep them off when visual evidence is unnecessary.
Choose categories deliberately
Use the default categories for a broad page-load investigation. A custom list is useful when you need a smaller artifact or want to isolate a known area. Category names are Chromium implementation details and can vary across versions, so verify them against the Puppeteer and Chromium versions used by your job.
await page.tracing.start({
  path: 'focused-trace.json',
  screenshots: true,
  categories: [
    'devtools.timeline',
    'v8.execute',
    'blink.user_timing',
    'disabled-by-default-devtools.screenshot',
  ],
});
When you provide categories, include the screenshot category yourself if your version requires it; the normal screenshots: true convenience behavior adds that category to the default set.
Keep the trace in memory instead of writing a file
If you omit path, tracing.stop() can return the trace bytes as a Uint8Array. This is useful when a worker should stream the artifact to object storage or attach it to a build record without creating a local file.
const traceBytes = await page.tracing.stop();

if (traceBytes) {
  await import('node:fs/promises').then(({ writeFile }) =>
    writeFile('trace-from-bytes.json', traceBytes)
  );
}
Use one output strategy per recording. A path is simplest for local debugging; returned bytes give your application control over naming, encryption, retention, and upload.
Record a realistic interaction flow
Page-load traces answer different questions from interaction traces. Start tracing after authentication and setup if those steps are not part of the issue. Then perform the exact action that reproduces the slowdown.
await page.goto('https://app.example.com/dashboard', {
  waitUntil: 'networkidle0',
});

await page.tracing.start({ path: 'dashboard-filter.json', screenshots: true });

await page.click('#open-filter');
await page.type('#search', 'quarterly revenue');
await page.click('#apply-filter');
await page.waitForSelector('.results-ready');

await page.tracing.stop();
Place user-timing marks around application phases so they appear in DevTools:
await page.evaluate(() => performance.mark('report-start'));
await page.click('#load-report');
await page.waitForSelector('#report');
await page.evaluate(() => performance.mark('report-ready'));
These marks make it easier to find the relevant interval than searching the whole recording.
Open, inspect, and share the trace
- Open Chrome and choose DevTools → Performance.
- Use the panel’s load or import control and select
trace.json. - Inspect the overview first, then zoom into the main-thread track and the interval containing your interaction.
- Use captured screenshots, user-timing marks, and long-task regions to connect browser work to the visible symptom.
The Chrome timeline viewer is another supported destination. For team sharing, keep the original file together with the browser version, Puppeteer version, URL, viewport, and the exact script revision that produced it.
Chrome’s Performance-panel save workflow can include annotations, resource content, source maps, and gzip compression. Compression reduces storage and transfer size. Resource content embeds HTML, JavaScript, and CSS so the Sources panel can show them; source maps can reveal authored source names and mappings. Treat traces from private applications as sensitive and disable embedded resources or source maps when they are not needed.
One trace at a time: lifecycle rules and edge cases
- Only one active trace per browser: starting a second recording while one is active is rejected. Use separate browser instances or serialize recordings.
- Stop before closing: call
tracing.stop()beforebrowser.close()so Chromium can flush the trace. - Navigation timeouts: a failed
gotodoes not automatically produce a useful workload trace. Catch the error, stop tracing, and preserve the partial artifact only if it helps diagnose the failure. - Single-page applications: do not rely on a second full navigation. Start tracing, perform the route change or interaction, and stop after the UI reaches a deterministic selector.
- Long recordings: event volume can fill the trace buffer. Narrow the interval, reduce categories, disable screenshots, or adjust the buffer setting supported by your version.
- Parallel tests: give every worker a unique path such as
trace-${process.pid}.jsonto avoid overwriting files.
Performance, reliability, and cost considerations
Tracing adds work to the browser process and can alter timing, especially with screenshots enabled. Use it to find causes and compare repeatable runs, not as a claim about production latency. Keep viewport, CPU conditions, network conditions, cache state, and browser version consistent when comparing two traces.
For reliable automation:
- Wait on explicit application states such as a selector or user-timing mark rather than arbitrary sleeps.
- Record several runs when the issue is intermittent and retain the trace that demonstrates the failure plus a representative normal run.
- Log the URL, commit, browser version, Puppeteer version, and tracing options beside each artifact.
- Compress traces for transport, but retain an uncompressed copy when text inspection is required.
- Apply retention and access controls because traces may contain page data, source code, tokens in URLs, or embedded resources.
Puppeteer and Chromium tracing have no per-trace service charge when run on your own machine or CI worker. Your costs are compute, storage, and transfer. Large traces with screenshots, resource content, and source maps consume more of each.
Or skip the browser setup
If you need a clean visual capture of a page rather than a Chrome performance timeline, ScreenshotNeo provides a website screenshot API. It does not replace a DevTools trace; it removes the browser orchestration required to produce a PNG, JPEG, WebP, or PDF for visual review.
See the ScreenshotNeo API docs for request options. A one-call capture is:
curl -G "https://api.screenshotneo.com/v1/shot" -d access_key=YOUR_API_KEY --data-urlencode url=https://stripe.com -o shot.webpimport requests
r = requests.get(
"https://api.screenshotneo.com/v1/shot",
params={"access_key": "YOUR_API_KEY", "url": "https://stripe.com"},
timeout=90,
)
r.raise_for_status()
open("shot.webp", "wb").write(r.content)const q = new URLSearchParams({ access_key: 'YOUR_API_KEY', url: 'https://stripe.com' });
const res = await fetch(`https://api.screenshotneo.com/v1/shot?${q}`);
if (!res.ok) throw new Error(`Screenshot failed: ${res.status}`);
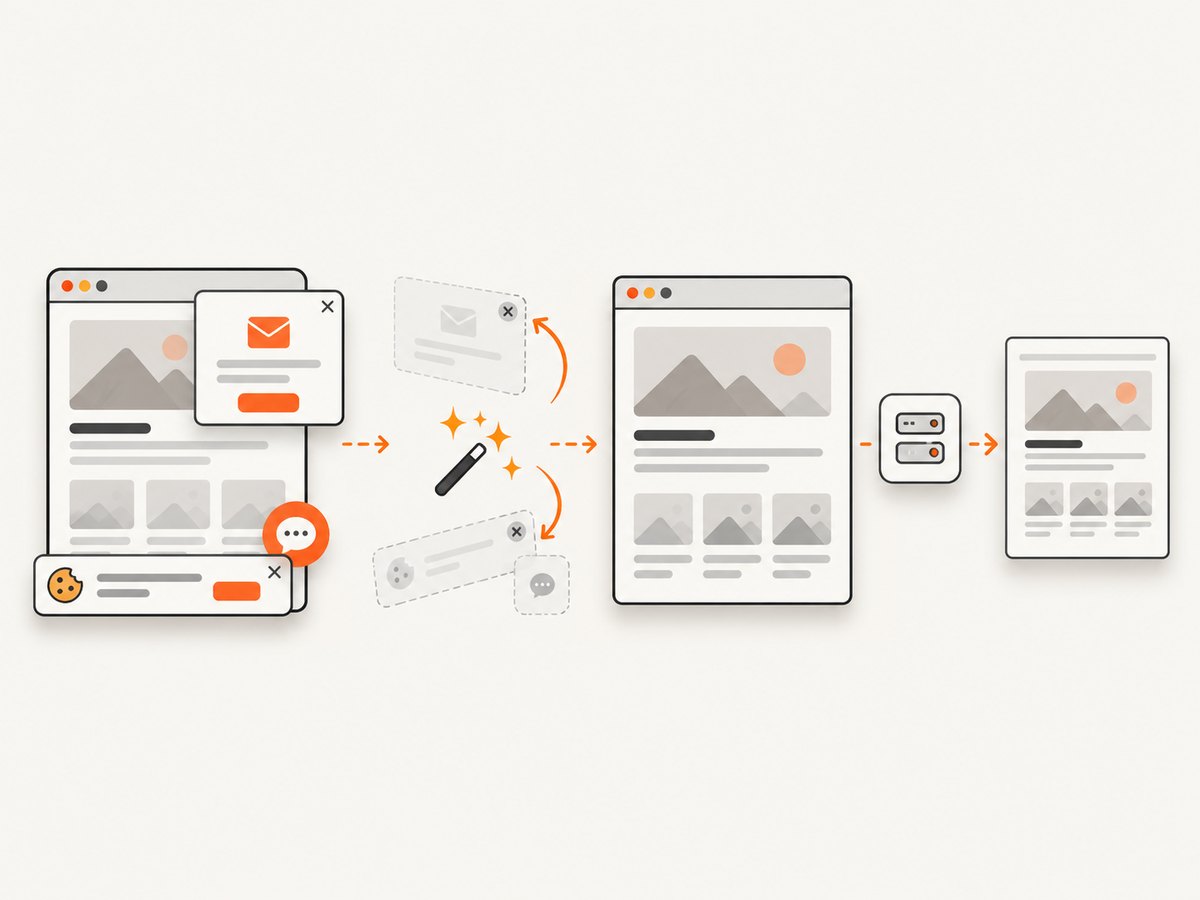
await Bun.write('shot.webp', res);Cookie banners, newsletter popups, and chat widgets are removed before the shot. Bot checks, blank pages, timeouts, failed loads, and cache hits are not billed, and the response identifies the result with X-Page-Verdict and X-Billed headers. ScreenshotNeo also offers an MCP server with take_screenshot, get_page_info, and capture_pdf tools for Claude, Cursor, and other MCP clients. The free plan includes 1,000 screenshots per month with no card; paid plans start at $5 for 3,000 shots. Create a free ScreenshotNeo account.
Troubleshooting Puppeteer traces
| Symptom | Likely cause | Fix |
|---|---|---|
Tracing already started |
A previous recording is still active in the same browser. | Stop it before starting another, or use a separate browser instance. |
| No trace file appears | The path is relative to a different working directory, or the process exited before stop flushed data. | Use an absolute path, await tracing.stop(), and close the browser afterward. |
| Trace opens but has no screenshots | screenshots is false or the screenshot tracing category is missing. |
Set screenshots: true and verify the category configuration. |
| Recording is too large | The interval, category set, screenshots, or embedded resources are excessive. | Shorten the capture, disable screenshots, narrow categories, and omit resource content when exporting from DevTools. |
| Navigation times out | The page never reaches the selected readiness condition. | Choose a condition that matches the app, wait for a known selector, and set a deliberate timeout. |
| Timing changes between runs | Cache, network, CPU load, animations, or page state differ. | Fix the environment, disable nonessential animation, and compare multiple controlled runs. |
| Sensitive source appears in the trace | Resource content or source maps were included. | Disable those export options, restrict access, and delete artifacts according to your retention policy. |
Frequently asked questions
Can Puppeteer save a trace without a file path?
Yes. Omit path and retain the bytes returned by tracing.stop() as a Uint8Array for application-managed storage or upload.
Should screenshots be enabled?
Enable them when you need to connect rendering or paint work to visible frames. Leave them disabled for a smaller, less sensitive trace focused on execution timing.
Can I record two pages at once?
Tracing is limited to one active recording per browser. Coordinate recordings or launch separate browser instances for concurrent jobs.
Where should a trace be opened?
Import it into Chrome DevTools’ Performance panel or open it with the Chrome timeline viewer.
Is a trace suitable for production monitoring?
It is primarily a diagnostic artifact. Continuous tracing adds overhead and produces sensitive, potentially large files, so use targeted recordings in controlled environments.


