How to Save All Website Network Traffic with Python
Capture browser requests reliably with Chrome HAR export or a Python-scriptable mitmproxy, including HTTPS, WebSockets, filtering, storage and troubleshooting.
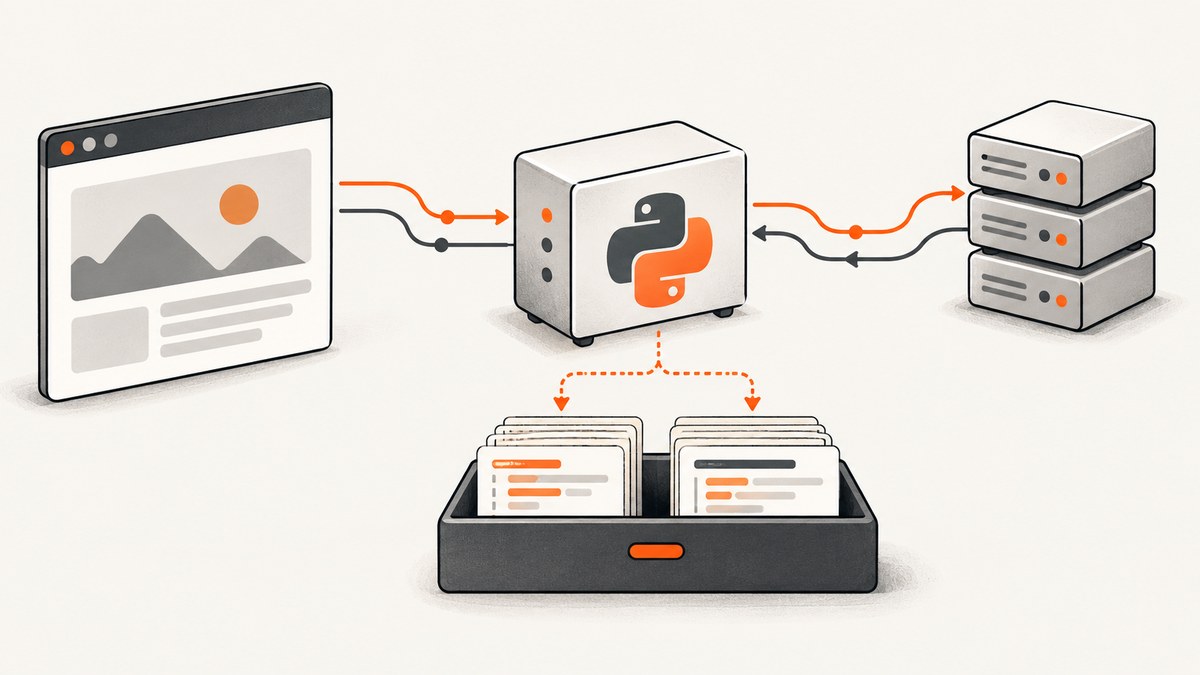
Direct answer: For one browser session, open Chrome DevTools before navigation, reload the page, and export the Network panel as a HAR file. For Python-controlled capture or traffic from several clients, route the browser or device through mitmproxy or mitmdump, install its generated CA certificate for HTTPS inspection, and save flows or HAR output. “All traffic” means everything sent by the instrumented client through your capture point that can be decrypted; requests made before instrumentation, traffic that bypasses the proxy, unsupported protocols and TLS that cannot be decrypted are outside the capture.
Choose the capture architecture
| Approach | Best for | Scope | Output |
|---|---|---|---|
| Chrome DevTools | Investigating one tab manually | Requests known to that DevTools session | HAR |
| Chrome DevTools extension API | Automating browser-visible requests | One attached Chrome profile or tab | HAR entries and request events |
| mitmproxy or mitmdump | Python automation, multiple clients, replay | Clients configured to use the proxy | Native flows or HAR |
Chrome’s Network panel can save all listed requests as HAR and import a HAR back into DevTools. Open DevTools before loading the page and reload it so early requests are recorded. Chrome offers a sanitized export by default; it removes sensitive headers such as Cookie, Set-Cookie and Authorization. A sensitive export is available only after enabling the relevant DevTools preference. See the Chrome DevTools Network reference.
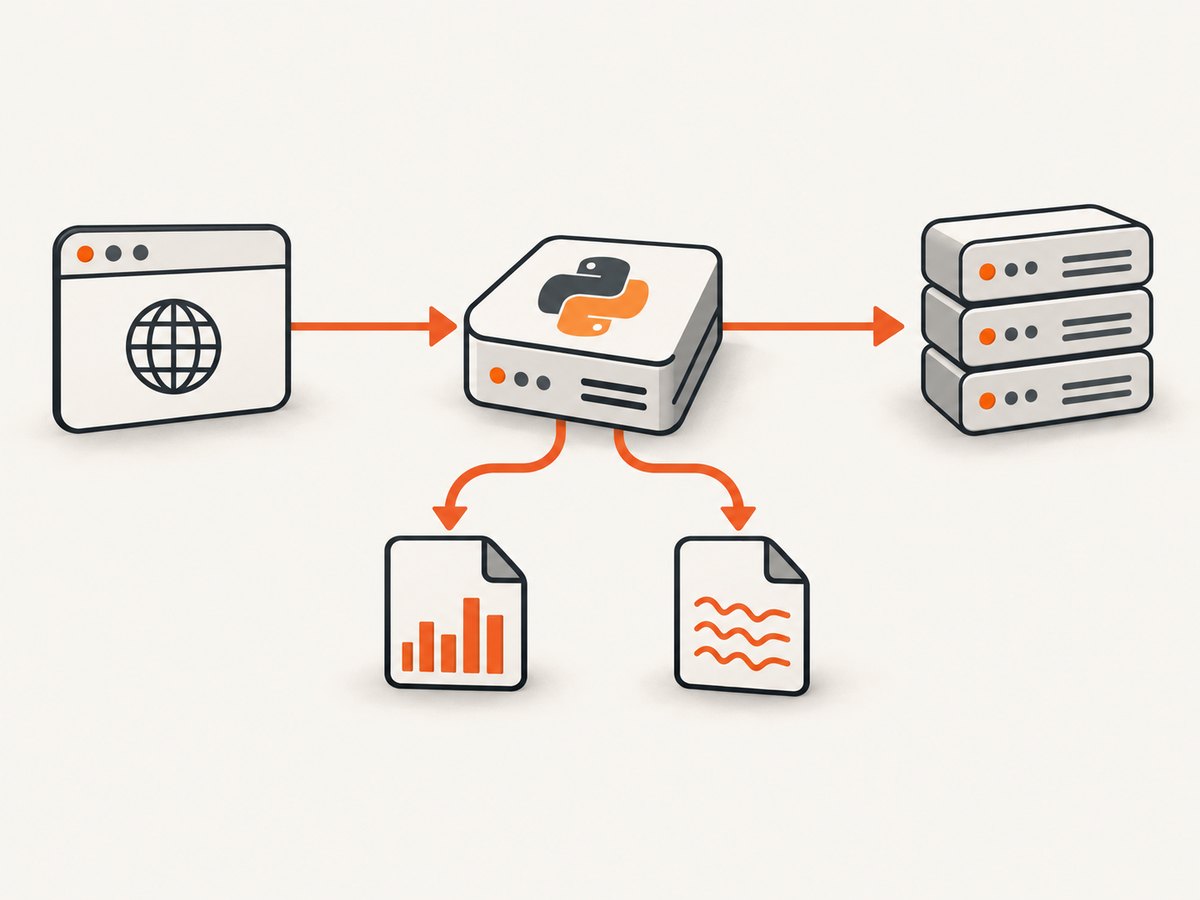
mitmproxy is an SSL/TLS-capable intercepting proxy for HTTP/1, HTTP/2 and WebSockets. It can save complete HTTP conversations for later analysis or replay and can run Python addons. Its documented modes include regular proxy, local capture, WireGuard, transparent, TUN, reverse, upstream, SOCKS and DNS. The regular proxy is the simplest when your client supports an HTTP proxy.
Method 1: Export a complete browser HAR
- Open Chrome and navigate to the target origin, but do not perform the action you want to study yet.
- Open More tools → Developer tools → Network.
- Enable Preserve log if redirects or navigation should remain in one capture. Enable Disable cache when you need requests that a warm browser cache would otherwise avoid.
- Reload the page while DevTools is already open.
- Perform the clicks, form submissions and scrolling that generate the traffic.
- Right-click the request list and choose Save all as HAR with content (wording varies slightly by Chrome version).
The resulting JSON contains a log.entries array. Each entry normally includes the request URL, method, headers, timing information, response status, response headers and, when requested, response content. “With content” can produce very large files; use sanitized export for routine debugging and protect any sensitive HAR as you would production logs.
Inspect a HAR with Python
import json
from pathlib import Path

har = json.loads(Path("capture.har").read_text(encoding="utf-8"))
entries = har.get("log", {}).get("entries", [])

for entry in entries:
    request = entry.get("request", {})
    response = entry.get("response", {})
    print(
        response.get("status"),
        request.get("method"),
        request.get("url"),
        response.get("mimeType", "")
    )

print(f"Captured {len(entries)} requests")
HAR is a browser export format, not a promise that every packet or process was recorded. It represents the requests Chrome exposed to that Network panel.
Method 2: Capture traffic through mitmproxy
Install mitmproxy using the installation method for your operating system, then start the regular proxy:
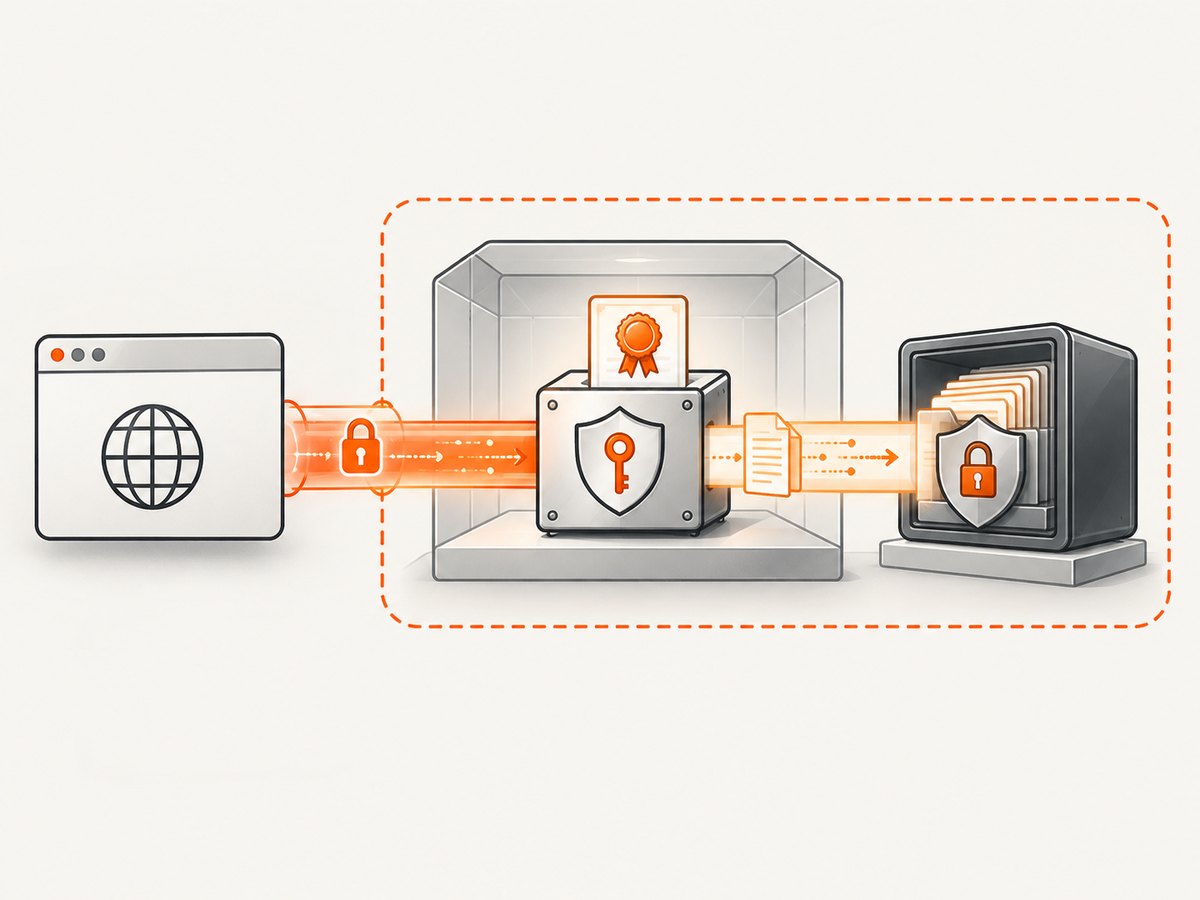
mitmproxy --listen-host 127.0.0.1 --listen-port 8080Configure the browser or device to use an HTTP proxy at 127.0.0.1:8080. With the client routed through mitmproxy, open http://mitm.it in that client and install the generated mitmproxy CA certificate. The CA is required for mitmproxy to inspect HTTPS traffic; without it, encrypted requests cannot be decrypted. Follow the mitmproxy getting-started guide.
For a non-interactive capture, use mitmdump. The --hardump option writes a HAR file with all flows when the process exits:
mitmdump \
  --listen-host 127.0.0.1 \
  --listen-port 8080 \
  --hardump capture.har
Stop the process with Ctrl-C after the browsing session. mitmproxy documents HTTP/2 and HTTP/3 support as enabled by default in its documented configuration. Its HAR tooling also supports saving flows as save.har and loading HAR files for replay or analysis. See the feature documentation and options reference.
Automate capture with a Python addon
An addon can record selected request and response fields as newline-delimited JSON. This keeps the example inspectable and lets you redact data before writing it:
# capture_addon.py
import json
from mitmproxy import http

OUT = "flows.ndjson"

def _write(value):
    with open(OUT, "a", encoding="utf-8") as file:
        file.write(json.dumps(value, ensure_ascii=False) + "\n")

def request(flow: http.HTTPFlow):
    _write({
        "event": "request",
        "method": flow.request.method,
        "url": flow.request.pretty_url,
        "headers": dict(flow.request.headers),
        "body_bytes": len(flow.request.raw_content or b""),
    })

def response(flow: http.HTTPFlow):
    _write({
        "event": "response",
        "url": flow.request.pretty_url,
        "status": flow.response.status_code,
        "headers": dict(flow.response.headers),
        "body_bytes": len(flow.response.raw_content or b""),
    })
Run it with:
mitmdump \
  --listen-host 127.0.0.1 \
  --listen-port 8080 \
  -s capture_addon.py
The hooks run as requests and responses pass through the proxy. If you need response bodies, add a carefully scoped body field or save flows instead; body capture can contain passwords, tokens, personal data and large downloads. Redact authorization headers and cookies before sharing logs.
Capture a Python-controlled browser
Any browser automation library that accepts proxy settings can use the same mitmproxy listener. With Selenium, configure Chrome before creating the driver:
from selenium import webdriver
from selenium.webdriver.chrome.options import Options

options = Options()
options.add_argument("--proxy-server=http://127.0.0.1:8080")
# Only use this in an isolated test profile after installing the mitmproxy CA.
# options.add_argument("--ignore-certificate-errors")  # weakens TLS checks; avoid in normal use

driver = webdriver.Chrome(options=options)
driver.get("https://example.com")
print(driver.title)
driver.quit()
The proxy must be running before the browser starts. Installing the CA in the browser or test profile is preferable to disabling certificate checks. Mobile apps may use certificate pinning and refuse interception even when the device trusts the CA.
What “all traffic” includes—and misses
- Timing: Requests made before DevTools or the proxy starts are absent.
- Routing: A process that ignores the proxy, uses a separate proxy, or opens a direct socket will not appear.
- Protocols: mitmproxy covers documented HTTP/1, HTTP/2, HTTP/3 and WebSockets paths; arbitrary non-HTTP protocols are not represented in an HTTP HAR.
- Encryption: HTTPS requires a trusted interception CA. Certificate pinning, client certificates or other trust controls can prevent decryption.
- Browser internals: Service-worker behavior, cache hits and extensions can change what reaches the network.
- Scope: DevTools records one browser session; a proxy records every correctly configured client sharing its listener.
Filtering, storage and repeatable captures
Filter at the proxy
Use mitmproxy’s filters or an addon to keep only a host, path or method. Filtering lowers disk usage and makes later analysis faster. Keep a raw flow file for short diagnostic sessions, then create a redacted derivative for long-term storage.
Choose an output format
| Format | Use it when |
|---|---|
| HAR | You need browser-compatible inspection, sharing or replay tooling. |
| mitmproxy flow file | You need native flow metadata and mitmproxy replay or scripting. |
| NDJSON | You need streaming ingestion into Python, a log processor or a database. |
Make runs comparable
Record the URL, browser version, proxy configuration, timestamp, cache state and test action. Use a fresh profile when login state should not affect results. For performance investigations, run the same scenario with cache enabled and disabled, and distinguish a cache hit from a server response.
Security and privacy checklist
- Use sanitized HAR export unless sensitive headers are required.
- Treat captured cookies, authorization headers, request bodies and response bodies as secrets.
- Use a dedicated browser profile and test account.
- Limit the proxy to localhost or a protected network interface.
- Delete CA certificates and test profiles after the investigation.
- Redact tokens before uploading a HAR or flow file to an issue tracker.
- Tell users and owners before intercepting traffic from devices you do not control.
Or skip the browser setup
If your actual goal is a clean image or PDF of a page rather than a packet-level network archive, ScreenshotNeo provides a website screenshot API. One GET request returns a PNG, JPEG, WebP or PDF. Read the complete option list in the ScreenshotNeo API documentation.
curl -G "https://api.screenshotneo.com/v1/shot" -d access_key=YOUR_API_KEY --data-urlencode url=https://stripe.com -o shot.webpimport requests
r = requests.get("https://api.screenshotneo.com/v1/shot", params={"access_key": "YOUR_API_KEY", "url": "https://stripe.com"}, timeout=90)
open("shot.webp", "wb").write(r.content)const q = new URLSearchParams({ access_key: 'YOUR_API_KEY', url: 'https://stripe.com' });
const res = await fetch(`https://api.screenshotneo.com/v1/shot?${q}`);ScreenshotNeo accepts cookie and consent banners before capture and removes more than 60 known consent platforms, newsletter popups and chat widgets; each step can be turned off. Bot checks and CAPTCHAs, blank pages, timeouts, failed loads and cache hits are not billed, and response headers identify the page verdict and whether the shot was billed. It also offers an MCP server with take_screenshot, get_page_info and capture_pdf for Claude, Cursor and other MCP clients. The free plan includes 1,000 screenshots per month with no card; paid plans start at $5 for 3,000 shots. Create a free ScreenshotNeo account.
Troubleshooting
The HAR is missing the first requests
DevTools opened after navigation. Open it before reloading and repeat the flow. For automation, start the proxy before launching the browser.
HTTPS shows certificate errors
The client does not trust mitmproxy’s CA, or the application uses certificate pinning. Install the CA in the dedicated test profile. Do not broadly disable certificate validation; if pinning cannot be changed, capture at an application-supported test boundary instead.
Only some applications appear
Those applications are bypassing the proxy, using another network namespace or speaking a protocol outside the HTTP interception path. Verify proxy environment and device settings, then test with a known HTTP request.
Responses are empty
Chrome’s extension API omits response content by default. Call the request object’s getContent() when content is needed. In mitmproxy, ensure your addon reads the response after it arrives and check whether the server returned a compressed, streamed or very large body.
The capture file becomes huge
Restrict hosts and paths, avoid body capture unless necessary, rotate files, and stop after the required action. HAR with content embeds response bodies and grows quickly.
WebSockets do not appear in my JSON export
Confirm the client is routed through mitmproxy and inspect the native flow or mitmproxy event model. A custom addon that records only HTTP request and response hooks will not automatically serialize every WebSocket message.
Login or payment flows break
Interception can change trust, timing or headers, and some services reject automated or intercepted clients. Use a test account, preserve required cookies, and check for certificate pinning or bot protection. Never record real payment credentials.
Performance, reliability and cost notes
DevTools has the lowest setup cost for a one-off browser investigation. A proxy adds a process, certificate management and disk I/O, but it scales to multiple configured clients and supports scripting. Filtering early reduces CPU, memory and storage. Capture only the body data needed for the question, especially when pages stream media or download large assets.
For reliable comparisons, fix the browser profile, viewport, cache state, proxy mode and test steps. Preserve the command line and addon version with each artifact. A successful proxy process does not prove that every client request was captured: verify routing and compare the expected navigation, API calls and WebSocket handshake.
FAQ
Can Python capture requests without a proxy?
Python can inspect a HAR exported by Chrome or observe requests through browser automation APIs, but traffic from arbitrary applications requires an interception point such as a configured proxy or an application-specific hook.
Does a HAR contain passwords?
Sanitized Chrome exports remove several sensitive headers, but request bodies, URLs and other fields can still contain private data. Review and redact every file before sharing.
Should I use Chrome DevTools or mitmproxy?
Use DevTools for one tab and quick visual debugging. Use mitmproxy when you need Python addons, several clients, replayable flows or proxy-level visibility.
Can I capture traffic from a phone?
Yes, when the phone is configured to use the proxy and trusts its CA. Apps with certificate pinning or non-HTTP protocols may require a different test setup.
Is “all traffic” literally every packet?
No. These methods capture application-layer traffic visible at the chosen instrumentation point, subject to routing, protocol support and TLS decryption.


