How to Set Up a Server for Website Monitoring
Set up self-hosted website monitoring with Uptime Kuma or Prometheus and Blackbox Exporter, with persistent storage, alerts, and practical troubleshooting.
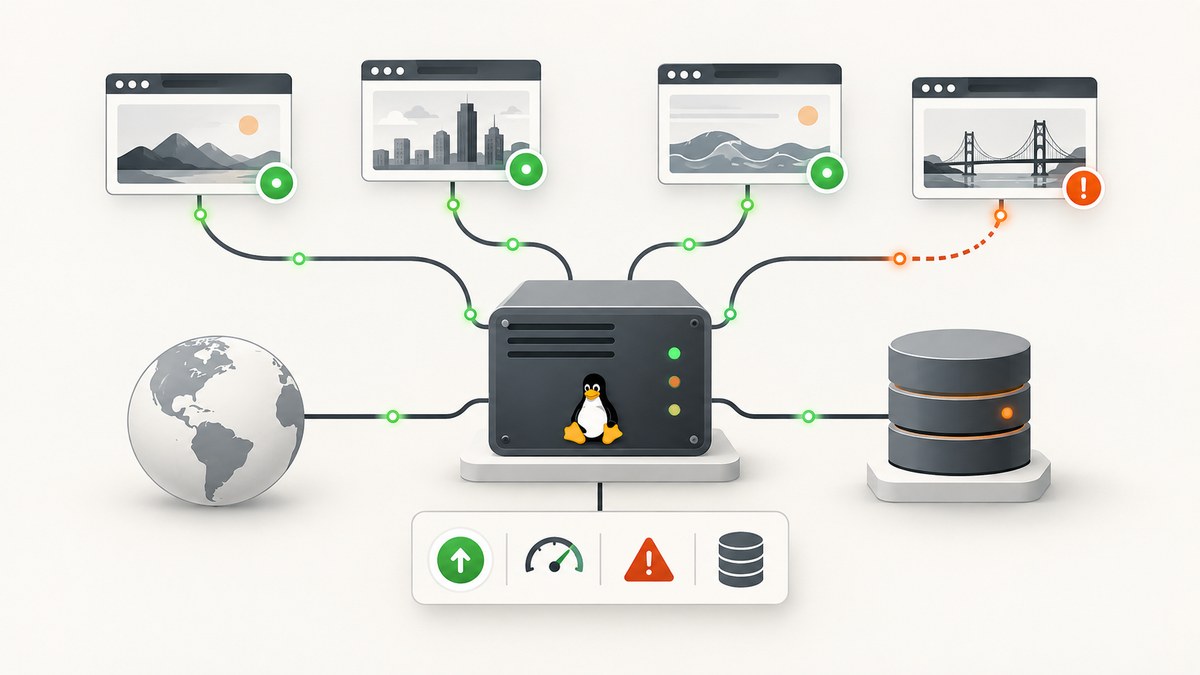
For a small number of websites and straightforward availability checks, run Uptime Kuma in Docker on an always-on Linux host. For probe metrics, latency history, and rule-based alerts, use Prometheus with Blackbox Exporter. Add Node Exporter when you also need to relate website incidents to Linux host health.
Keep the monitoring host outside the website’s network when possible, store monitoring data persistently on local storage, and send alerts through a channel that remains available during a site outage. This guide walks through both setups.
1. Choose a monitoring setup
| Setup | Choose it when | Trade-off |
|---|---|---|
| Uptime Kuma | You want a browser interface and a simple way to check a few sites and services. | Less suited to complex metric queries and large-scale retention. |
| Prometheus + Blackbox Exporter | You want probe metrics, latency history, and alert rules. | More components and configuration to maintain. |
| Prometheus + Blackbox + Node Exporter | You want endpoint checks and monitoring-host CPU, memory, disk, and other machine metrics. | You must manage exporters and decide which host signals should alert. |
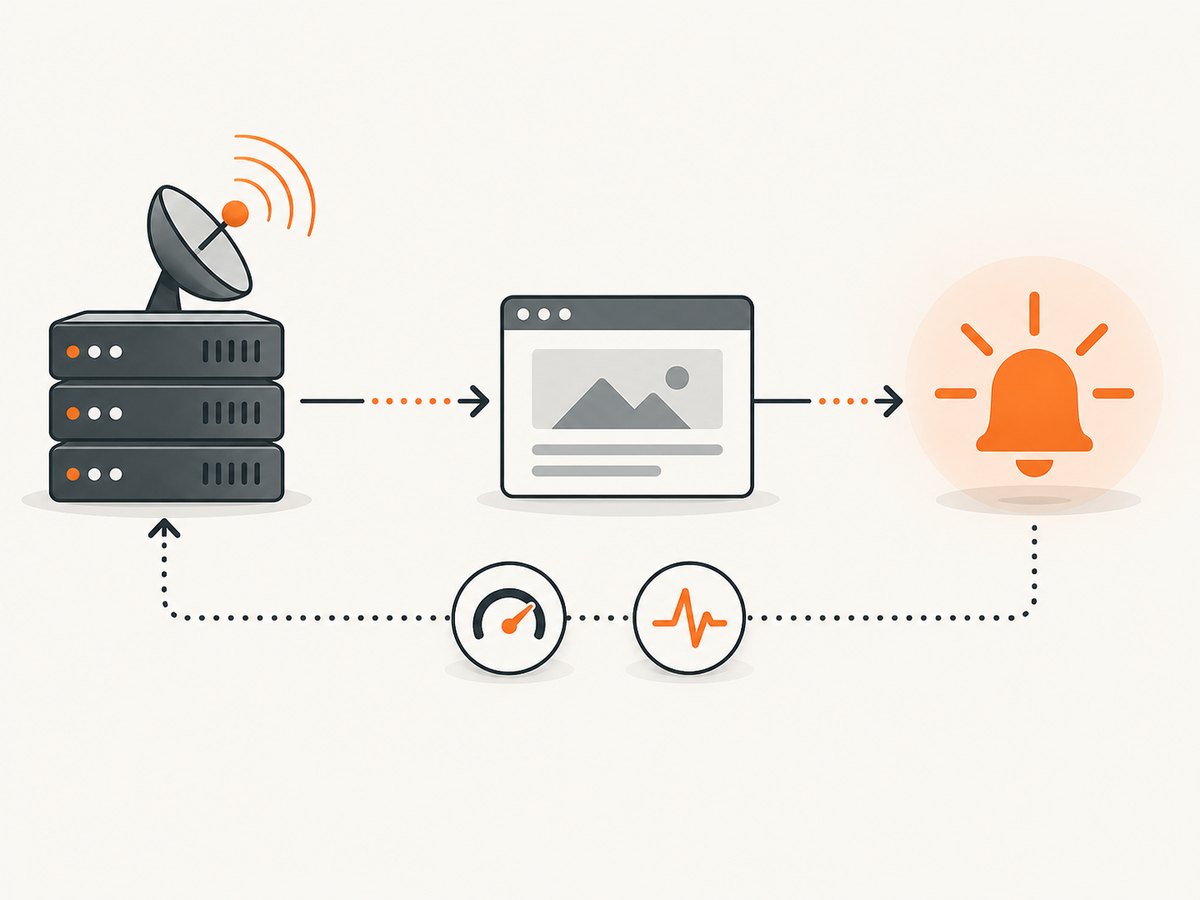
Blackbox Exporter probes a target from the machine where the exporter runs. This makes its location meaningful: a probe can show whether a website is reachable from that external vantage point. Prometheus scrapes the exporter, stores the resulting metrics, and evaluates rules. Prometheus explains the multi-target exporter pattern; its rules can create time series and alerts. Prometheus rule documentation
2. Prepare the monitoring host
- Provision an always-on Linux VPS, mini-PC, or other server. Prefer a location outside the website’s network so an internal network failure does not also take down the monitor.
- Install Docker Engine and the Docker Compose plugin using the instructions for your Linux distribution in the Docker documentation.
- Create a working directory and use a local directory or Docker named volume for persistent data. Do not put Uptime Kuma’s database on a filesystem without POSIX file-lock support; its installation guide warns about locking problems such as those that can occur with NFS. Uptime Kuma installation guide
- Restrict access to monitoring dashboards and exporter endpoints. Use a firewall or private network, and put a reverse proxy with authentication and TLS in front of a dashboard if it needs remote access.
3. Quick setup: Uptime Kuma in Docker
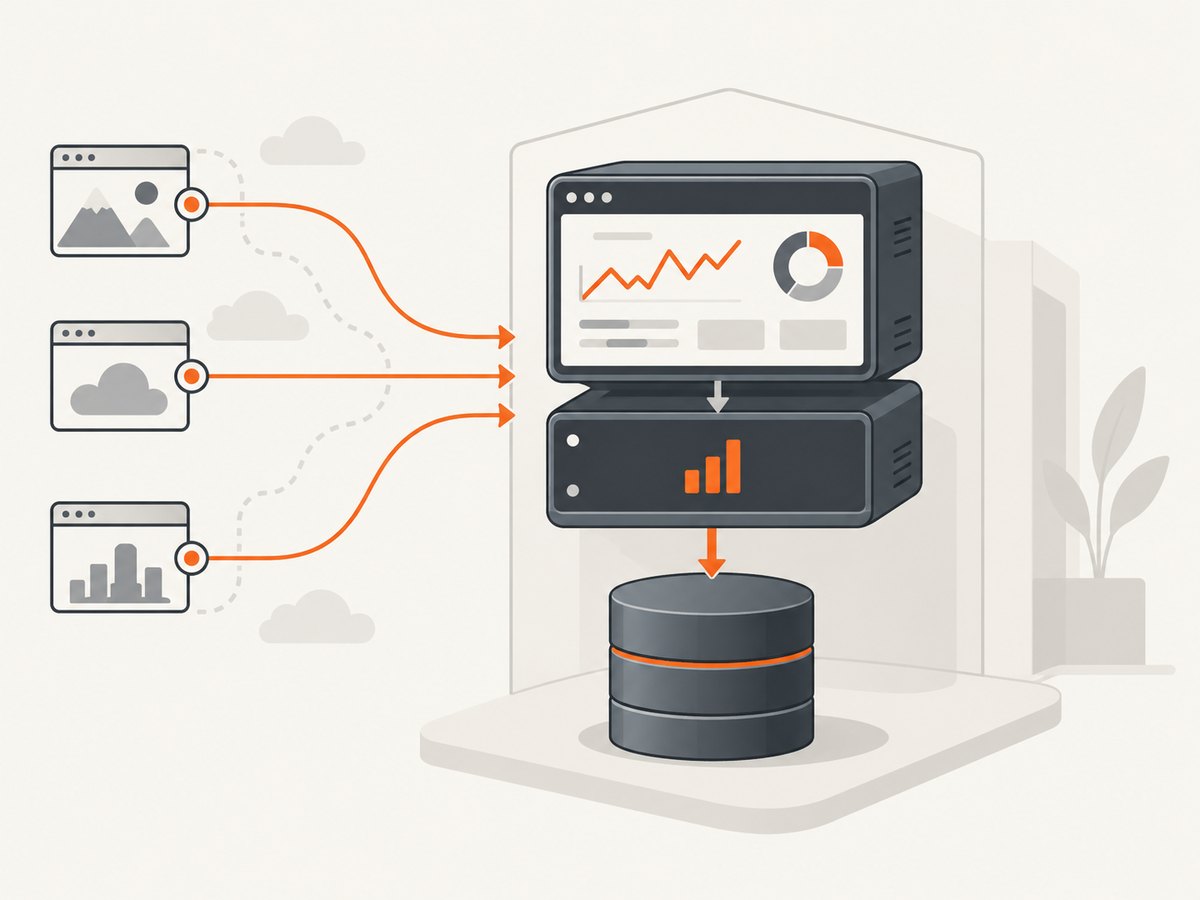
This official Docker command publishes the web interface on port 3001 and stores data in a Docker-managed persistent volume:
docker volume create uptime-kuma

docker run -d \
  --restart=unless-stopped \
  -p 3001:3001 \
  -v uptime-kuma:/app/data \
  --name uptime-kuma \
  louislam/uptime-kuma:1
Open http://SERVER_IP:3001 from a trusted network to finish setup. If the host is behind a firewall, allow access only from the administrator’s network. To bind the interface to the server itself for access through a local reverse proxy, change the port option to -p 127.0.0.1:3001:3001.
Alternatively, create a local data directory and bind-mount it. Ensure Docker can write to it:
mkdir -p ./uptime-kuma-data

docker run -d \
  --restart=unless-stopped \
  -p 3001:3001 \
  -v "$PWD/uptime-kuma-data:/app/data" \
  --name uptime-kuma \
  louislam/uptime-kuma:1
In the web interface, add checks for the public homepage and at least one important API route or user-facing transaction endpoint. Set a realistic timeout and retry policy, then adjust thresholds after observing normal latency. Configure notifications and send a test notification before relying on them.
Back up Uptime Kuma
Back up the mounted /app/data directory or volume using a method that produces a consistent copy. For a simple stopped-container copy:
docker stop uptime-kuma
docker run --rm \
  -v uptime-kuma:/source:ro \
  -v "$PWD:/backup" \
  alpine sh -c 'tar -czf /backup/uptime-kuma-data.tgz -C /source .'
docker start uptime-kuma
Store backups away from the monitoring host and periodically confirm that a backup can be restored. Stopping the container briefly avoids copying its live database while it is changing.
4. Metrics setup: Prometheus and Blackbox Exporter
Use this Compose project when you want Prometheus to scrape HTTP probes from Blackbox Exporter. It stores Prometheus data in a named volume. The configuration includes one example target; replace it with your own URLs.
Create a directory with these files:
mkdir -p website-monitoring
cd website-monitoring
compose.yaml
services:
  prometheus:
    image: prom/prometheus
    restart: unless-stopped
    command:
      - --config.file=/etc/prometheus/prometheus.yml
      - --storage.tsdb.path=/prometheus
    ports:
      - "127.0.0.1:9090:9090"
    volumes:
      - ./prometheus.yml:/etc/prometheus/prometheus.yml:ro
      - ./alerts.yml:/etc/prometheus/alerts.yml:ro
      - prometheus-data:/prometheus
    depends_on:
      - blackbox

  blackbox:
    image: prom/blackbox-exporter
    restart: unless-stopped
    command:
      - --config.file=/etc/blackbox_exporter/config.yml
    expose:
      - "9115"
    volumes:
      - ./blackbox.yml:/etc/blackbox_exporter/config.yml:ro

volumes:
  prometheus-data:
blackbox.yml
modules:
  http_2xx:
    prober: http
    timeout: 10s
    http:
      method: GET
      preferred_ip_protocol: ip4
      follow_redirects: true
      valid_status_codes: []
An empty valid_status_codes list uses the HTTP prober’s default success range. If your service intentionally returns a different status, explicitly list acceptable codes, for example valid_status_codes: [200, 204]. Set the module timeout below Prometheus’s scrape timeout.
prometheus.yml
global:
  scrape_interval: 30s
  scrape_timeout: 15s
  evaluation_interval: 30s

rule_files:
  - /etc/prometheus/alerts.yml

scrape_configs:
  - job_name: blackbox
    metrics_path: /probe
    params:
      module: [http_2xx]
    static_configs:
      - targets:
          - https://example.com/
          - https://example.com/health
    relabel_configs:
      - source_labels: [__address__]
        target_label: __param_target
      - source_labels: [__param_target]
        target_label: instance
      - target_label: __address__
        replacement: blackbox:9115
alerts.yml
groups:
  - name: website-probes
    rules:
      - alert: WebsiteProbeFailed
        expr: probe_success == 0
        for: 2m
        labels:
          severity: page
        annotations:
          summary: "Website probe failed: {{ $labels.instance }}"
          description: "Blackbox Exporter could not complete a successful probe."
Start the stack with docker compose up -d. Open http://127.0.0.1:9090/targets on the host or through a secure tunnel. The Blackbox job should be UP; then query probe_success and confirm that the probe for your target returns 1. The exporter also exposes probe details such as duration, HTTP version, and TLS information. See the Prometheus multi-target exporter guide.
Prometheus needs persistent storage: without a volume mounted at /prometheus, its data is cleared when the container restarts. Prometheus storage documentation
Probe a target manually
From the host, run a probe through the Compose network:
docker compose exec prometheus \
  wget -qO- 'http://blackbox:9115/probe?module=http_2xx&target=https%3A%2F%2Fexample.com%2F'
Look for probe_success 1. A value of 0 means the probe ran but did not meet the module’s success criteria; inspect the other probe metrics and exporter logs to find whether DNS, TCP, TLS, HTTP status, or timeout caused the failure.
5. Add Linux host metrics when needed
Blackbox probes answer whether a target responds from the monitor. To correlate incidents with the monitoring server’s CPU, memory, disk, and other host signals, run Node Exporter and scrape it from Prometheus. Node Exporter exposes hardware and kernel metrics for *nix systems. Prometheus Node Exporter guide
For a quick local-only container example, add this service to compose.yaml on a Linux host:
  node-exporter:
    image: prom/node-exporter
    restart: unless-stopped
    pid: host
    command:
      - --path.rootfs=/host
    volumes:
      - /:/host:ro,rslave
    expose:
      - "9100"
Add this scrape job to prometheus.yml:
  - job_name: node
    static_configs:
      - targets: [node-exporter:9100]
This container configuration is for Linux and exposes the host filesystem read-only to collect host metrics. Review the exporter’s security and deployment guidance before using it on a shared or untrusted host. Keep port 9100 private; it is not meant to be an unauthenticated public endpoint. For multiple machines, install Node Exporter on each monitored host and configure secure network access from Prometheus.
6. Configure useful checks and alerts
- Check both availability and a meaningful response. A homepage can return HTTP 200 while the application is broken. Include a health endpoint or a route that exercises an important dependency.
- Choose a timeout from observed behavior. Too short creates false alarms during ordinary slow responses; too long delays failure detection. Observe normal latency before deciding on the timeout.
- Use a short waiting period for alerts. Prometheus’s
forduration filters brief failures. Set it according to how quickly you need notification and how noisy transient failures are. - Separate warning and paging conditions. Availability failures may page; elevated latency can first alert as a warning. Avoid alerting on every individual slow sample.
- Test the whole alert path. Temporarily configure a known failing test target or stop a test service, and confirm the notification arrives. Restore the intended configuration afterward.
- Monitor the monitor. Use an independent check or an external service to verify the monitoring host and notification path. A monitor cannot report its own power loss if it is the only observer.
Prometheus evaluates configured recording and alerting rules at intervals. Use promtool check rules alerts.yml to validate rule syntax if promtool is installed. Prometheus needs an alert receiver such as Alertmanager or an integrated notification path for alerts to reach people; a rule by itself does not deliver a message. Prometheus Alertmanager documentation
7. Reliability, performance, storage, and cost
- Monitoring location: A VPS outside the website’s network can observe failures that a monitor on the same LAN misses. One vantage point still cannot tell you whether all users or regions are affected.
- Persistent data: Keep Uptime Kuma’s
/app/dataon a local filesystem or Docker volume with the required file locking. Keep Prometheus’s/prometheuson persistent storage or its history will disappear on restart. - Backups: Back up both application configuration and historical data according to how much history you need. Store a copy off-host and test restore steps.
- Probe load: Each target and scrape interval adds requests to the monitored service and samples to Prometheus. Begin with a modest target list and interval, then adjust based on detection needs and storage growth. No universal interval or server size fits every workload.
- Retention: Prometheus storage grows with sample volume and retention. Choose retention and disk capacity deliberately, and watch disk usage. Avoid keeping more history than the team will query.
- Cost: Self-hosting means paying for the always-on host, storage, backups, and time spent maintaining and securing the stack. A small deployment has fewer services to operate; Prometheus offers more control at the cost of more setup and upkeep. Exact hosting costs vary by provider and region.
- Availability: Restart policies bring containers back after process or host restarts, but they do not replace backups, host monitoring, secure access, or a second monitoring vantage point.
8. Troubleshooting
| Symptom | Likely cause | Fix |
|---|---|---|
| Uptime Kuma does not start or reports database/locking errors. | The data path is not writable or its filesystem lacks the required POSIX file-lock behavior; NFS can cause locking problems. | Check docker logs uptime-kuma, permissions, and the mounted path. Move /app/data to a local directory or Docker volume that supports file locks. |
| The dashboard cannot be reached on port 3001. | The container is stopped, the port is already in use, or a host firewall blocks access. | Run docker ps and docker logs uptime-kuma; check the port mapping and firewall. If bound to 127.0.0.1, connect locally or through the configured proxy. |
Prometheus target is DOWN. |
Prometheus cannot resolve or connect to the exporter, or the scrape configuration is wrong. | Check docker compose logs prometheus blackbox, ensure both services share the Compose network, confirm the exporter listens on 9115, and review the scrape target and relabeling. |
Blackbox target is UP, but probe_success is 0. |
The exporter is reachable, but the target probe failed due to DNS, routing, TLS, HTTP status, or timeout. | Use the manual probe endpoint and inspect its output. Verify the target URL from the monitoring host and adjust valid status codes or timeout only when appropriate. |
| Prometheus cannot load configuration or rules. | YAML indentation, a wrong mount path, or an invalid rule/config field. | Check container logs and mounted filenames. Validate rule syntax with promtool check rules alerts.yml; correct the YAML and restart or reload Prometheus. |
| Metrics disappear after a restart. | Prometheus storage is not mounted persistently, or the volume was removed. | Verify prometheus-data:/prometheus in Compose and avoid deleting the volume during updates. |
| Alerts never arrive. | Rules are not loaded, the expression never matches, or alert delivery is not configured. | Check Prometheus’s Rules and Alerts pages, query the expression, verify the configured receiver, then perform a controlled alert test. |
| Alerts are noisy during short hiccups. | The probe interval, timeout, or alert for duration is too sensitive for normal conditions. |
Compare failures with observed latency and tune the interval, timeout, and waiting period. Keep enough sensitivity for your recovery objectives. |
| Probe works from a laptop but fails on the server. | The server has different DNS, IPv6, outbound firewall, or certificate trust behavior. | Test resolution and HTTPS connectivity from the monitoring host; check the module’s IP protocol preference and the host’s outbound network rules. |
9. Or skip the browser setup
If you need screenshots for visual checks or incident records, ScreenshotNeo is a website screenshot API and MCP server. One GET request returns an image or PDF, and its API documentation describes the request options.
curl -G "https://api.screenshotneo.com/v1/shot" -d access_key=YOUR_API_KEY --data-urlencode url=https://example.com -o shot.webpimport requests
r = requests.get(
"https://api.screenshotneo.com/v1/shot",
params={"access_key": "YOUR_API_KEY", "url": "https://example.com"},
timeout=90,
)
open("shot.webp", "wb").write(r.content)const q = new URLSearchParams({ access_key: 'YOUR_API_KEY', url: 'https://example.com' });
const res = await fetch(`https://api.screenshotneo.com/v1/shot?${q}`);
if (!res.ok) throw new Error(`Screenshot request failed: ${res.status}`);
await Bun.write('shot.webp', res);ScreenshotNeo removes cookie banners, popups, and chat widgets before the shot. Bot checks, blank pages, and failed loads are never billed. Its MCP server lets AI agents take screenshots. The free plan includes 1,000 screenshots a month with no card; paid plans start at $5 for 3,000. Create a free ScreenshotNeo account.
FAQ
Can I self-host website uptime monitoring?
Yes. Uptime Kuma is a practical Docker option for a small deployment. Prometheus with Blackbox Exporter is an option when you need probe metrics and alert rules.
Should the monitor run on the same server as my website?
Prefer a separate host or network when possible. If the website host or its network fails, a monitor located there may fail at the same time.
Does Blackbox Exporter run on the monitored website server?
No. It probes the target over the network from where the exporter runs. Prometheus scrapes the exporter to collect probe results.
Do I need Node Exporter?
Only when host-level metrics help explain incidents. Blackbox Exporter checks endpoint reachability; Node Exporter exposes Linux machine metrics.


