Simple Website Monitoring Services for Developers
Compare simple website monitoring services for developers, choose the right checks, configure alerts, and avoid false outage alarms.
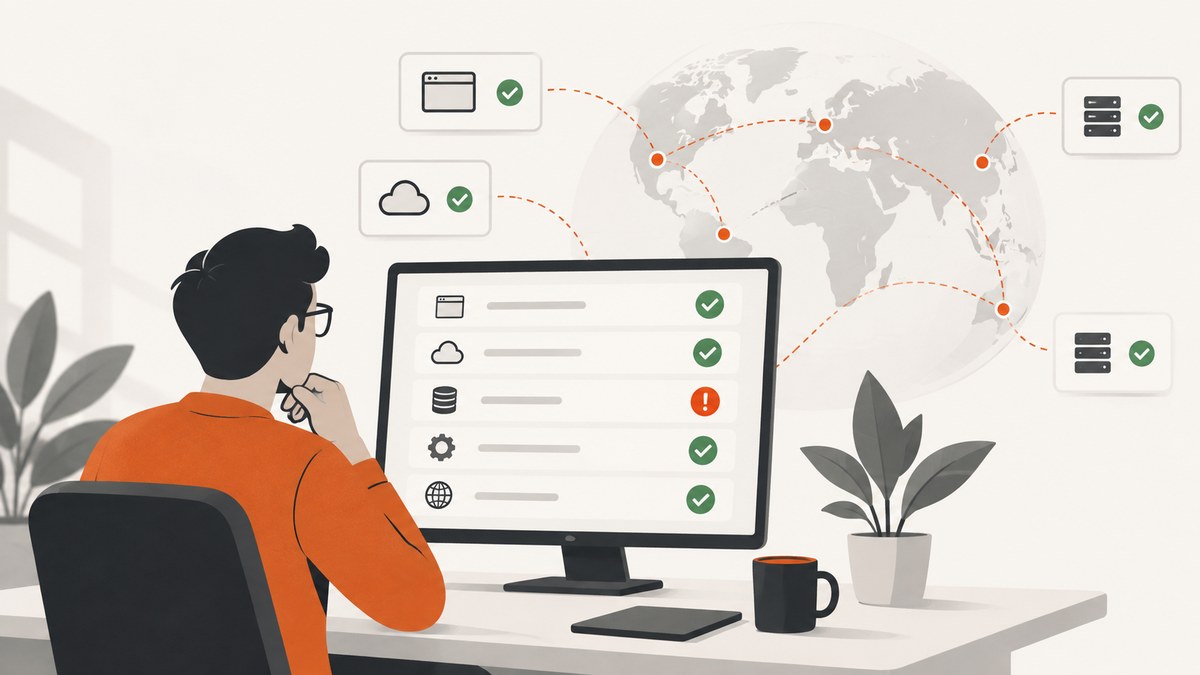
A simple website monitoring service checks a URL, endpoint, port, or scheduled job from outside your infrastructure and alerts you when the result does not meet your expectation. For a small public website or API, start with an HTTP(S) check, a sensible interval, and an alert channel your team actually watches. Add keyword, TCP, cron, SSL, DNS, performance, or scripted checks only when they match a failure you need to detect.
An HTTP 200 response proves only that one request succeeded. It does not prove that login, checkout, a database dependency, a background job, or every regional user journey works. Choose the narrowest check that detects the failure you care about, then expand coverage as your system grows.
1. What to decide before choosing a monitoring service
Define the failure
- Page or API unavailable: use HTTP(S), with status-code and timeout expectations.
- Wrong content: use a keyword or response-body assertion for text that must be present.
- Network service unreachable: use TCP/port or ping monitoring where supported.
- Scheduled job stopped reporting: use a cron or heartbeat monitor and have the job call the generated URL.
- Certificate or DNS problem: use SSL and DNS checks.
- Broken links or slow pages: use a service that includes crawling or performance checks.
- Business journey failed: use programmable browser or synthetic checks rather than a basic URL probe.
Set an alert policy
Decide how many failed probes should create an incident, whether a second location must confirm the failure, who receives the alert, and how recovery is reported. A second-location verification reduces false alarms caused by a transient network path, but it cannot guarantee that every outage will be detected.
Check operational requirements
- Probe interval and the locations used for checks.
- Supported protocols, authentication methods, request methods, and response assertions.
- Alert routes such as email, chat, webhooks, paging, or incident-management tools.
- Public status-page support if customers need service communication.
- Retention, audit history, team permissions, and API access.
- Plan limits and current pricing. Intervals, free-plan limits, and integrations change, so confirm them on the provider’s current plan page.
2. Comparison of simple website monitoring services
| Service | Best fit | Checks and workflow | Caveat |
|---|---|---|---|
| UptimeRobot | Broad basic monitoring for a small set of sites and endpoints | HTTP(S), keyword, ping, port, cron, and DNS monitoring; integrations and public status pages. Its developer page describes five-minute free-plan checks and shorter paid intervals, but verify current limits. | Primarily a straightforward availability monitor; deeper user journeys need another check type or product. |
| Oh Dear | Website health in one service | Uptime, SSL, DNS, cron, broken links, performance, and status pages, with failed-alert verification from a second location. | Broader scope can mean more configuration and more alerts to tune. |
| Better Stack | Monitoring combined with incident communication | Uptime monitoring, alerting, incident communication, and status pages. | Check current packaging, limits, and integrations before selecting a plan. |
| Checkly | Developers who want code-defined or programmable checks | URL uptime, heartbeat, database connections, mail servers, TCP services, and scheduled checks from multiple global locations. | More setup than a single URL monitor; useful when protocol or journey coverage matters. |
| Pingdom | Uptime and performance monitoring | Website, application, and server uptime checks, notifications, public status pages, and page-speed monitoring. | Confirm current plan limits and performance-check coverage. |

3. Configure an HTTP(S) monitor correctly
- Create a monitor for the canonical HTTPS URL, not only the homepage. Include a health endpoint for APIs when one exists.
- Set the expected status code or range, usually
200for a page or documented success codes for an API. - Set a timeout long enough for normal network and application latency, but short enough to page before users abandon the request.
- Send required headers, query parameters, or authentication using the provider’s secret-variable feature.
- Add a keyword or JSON/body assertion when a successful status could still represent an error page.
- Use a confirmation rule or second-location recheck before opening an incident.
- Configure recovery notifications and a maintenance window for planned deployments.
- Trigger a test alert, then document who owns the endpoint and what the first diagnostic command is.
Example health endpoint
Keep the endpoint fast and deterministic. Return a failure status when a dependency required for service is unavailable, and avoid exposing credentials or private diagnostic data.
GET /health/ready HTTP/1.1
Host: api.example.com

HTTP/1.1 200 OK
Content-Type: application/json

{"status":"ok","version":"2026.10.01"}
Minimal checks you can run yourself
These commands are useful for reproducing an alert while investigating. They are not a substitute for an external monitor because they run from your own network.
curl -fsS -o /dev/null -w "status=%{http_code} time=%{time_total}s\n" https://example.com/healthpython - <<'PY'
import sys, requests
url = "https://example.com/health"
r = requests.get(url, timeout=15)
print(r.status_code, r.elapsed.total_seconds(), r.text[:200])
sys.exit(0 if r.ok else 1)
PYnode - <<'JS'
const url = 'https://example.com/health';
const controller = new AbortController();
const timer = setTimeout(() => controller.abort(), 15000);
try {
const res = await fetch(url, { signal: controller.signal });
console.log(res.status, res.statusText);
process.exitCode = res.ok ? 0 : 1;
} finally {
clearTimeout(timer);
}
JS4. Match advanced checks to real failure modes
| Requirement | Configuration | Typical mistake |
|---|---|---|
| Expected content | Keyword, regular expression, or JSON assertion | Checking a word that appears in an error template as well as the real page. |
| Authenticated endpoint | Secret header, cookie, or token variable | Putting a long-lived token in a URL, repository, or notification message. |
| Port reachability | TCP/port check | Assuming an open port means the application protocol is healthy. |
| Background job | Heartbeat URL called by the job | Using a fixed schedule that does not account for retries or delayed runs. |
| SSL and DNS | Certificate expiry, hostname, DNS record checks | Monitoring only the origin while the public DNS or CDN path is broken. |
| Performance | Page-speed or response-time thresholds | Paging on one noisy measurement without a duration or percentile rule. |
| User journey | Programmable browser or synthetic check | Testing only a static page while checkout or login is failing. |
5. Reduce false positives without hiding outages
- Require two consecutive failures or verification from another location.
- Use a timeout based on observed normal latency rather than an arbitrary low value.
- Monitor a purpose-built health endpoint instead of a page that loads many third-party assets.
- Separate warning notifications from paging incidents.
- Pause checks during planned maintenance and resume them automatically.
- Review every alert: if it is noisy, change the assertion or dependency boundary instead of silencing the monitor.
Verification is a false-alarm control, not proof that an outage is global. A regional routing failure, DNS propagation issue, or provider outage can still produce different observations from different probe locations.
6. Alert routing and status pages
Send urgent alerts to the channel that has an owner and an escalation path. Email works for low-severity notifications; chat, webhooks, and paging integrations are better for incidents that require a response. Include the monitor name, URL, observed status, location, timestamp, and a link to the provider’s history.
A public status page is useful when customers need one authoritative place to see an incident and recovery. Keep internal diagnostics, credentials, and sensitive endpoint names out of the public page. UptimeRobot, Better Stack, Pingdom, and Oh Dear describe status-page capabilities; confirm visibility and custom-domain options in their current documentation.
7. Troubleshooting common monitoring errors
| Symptom | Likely cause | Fix |
|---|---|---|
| Monitor reports 401 or 403 | Missing, expired, or IP-restricted credentials | Use a dedicated read-only credential, configure secret headers, and allow the monitor’s documented source ranges if required. |
| Monitor reports 200 while users see an error | Error page returns success status | Add a keyword, JSON, or page-content assertion and monitor the failing journey separately. |
| Intermittent timeouts | Slow dependency, overloaded origin, DNS issue, or overly short timeout | Compare locations and timings, inspect server logs, test DNS, and set a threshold based on normal latency. |
| False outage during deploy | Monitor ran while the service was intentionally unavailable | Use maintenance windows, blue-green cutovers, or a readiness endpoint. |
| Heartbeat never arrives | Job crashed before reporting, wrong URL, blocked egress, or clock/schedule mistake | Log the heartbeat response, test the URL from the job host, and alert on both job failure and missed heartbeat. |
| Only one region fails | Regional CDN, DNS, firewall, or routing problem | Keep multi-location checks and investigate the failing path rather than averaging it away. |
| Too many alerts | Checks are too frequent, assertions are brittle, or warnings page the team | Group related monitors, add confirmation, and reserve paging for user-impacting failures. |
8. Performance, reliability, and cost considerations
Performance
Use a lightweight endpoint for availability checks and reserve full browser journeys for critical flows. Requesting every asset on a large page costs more time and can create failures from third-party scripts unrelated to your service. Keep assertions deterministic and avoid random data unless the test creates and cleans it up.
Reliability
Place checks outside the infrastructure they monitor. Use more than one location for public services, and monitor the monitor’s alert path with an occasional test. A green result means the specific probe passed at its location and time; it is not a complete statement about every user.
Cost
Cost usually follows monitor count, check frequency, probe locations, retained history, and browser or performance features. Start with one monitor per user-visible service and one heartbeat per critical job. Add checks when they close a known detection gap, then review duplicate monitors and stale environments monthly. Because vendor plans change, compare current plan pages immediately before purchase.
9. Or skip the browser setup with ScreenshotNeo
Monitoring tells you that a URL responded; ScreenshotNeo helps you capture the rendered result for visual review, reports, and AI workflows. It is a website screenshot API and MCP server. One GET request returns a PNG, JPEG, WebP, or PDF, with options for full-page or element capture, waiting, blocking, headers, cookies, authentication, and more. See the ScreenshotNeo API documentation for all options.

curl -G "https://api.screenshotneo.com/v1/shot" -d access_key=YOUR_API_KEY --data-urlencode url=https://stripe.com -o shot.webpimport requests
r = requests.get("https://api.screenshotneo.com/v1/shot", params={"access_key": "YOUR_API_KEY", "url": "https://stripe.com"}, timeout=90)
open("shot.webp", "wb").write(r.content)const q = new URLSearchParams({ access_key: 'YOUR_API_KEY', url: 'https://stripe.com' });
const res = await fetch(`https://api.screenshotneo.com/v1/shot?${q}`);Cookie banners, newsletter popups, and chat widgets are removed before the shot. Bot checks, blank pages, failed loads, timeouts, and cache hits are not billed, and response headers identify the page verdict and billing result. Its MCP server lets Claude, Cursor, and other MCP clients take screenshots, inspect pages, and capture PDFs. The Free plan includes 1,000 screenshots per month with no card; paid plans start at $5 for 3,000 shots. Create a free ScreenshotNeo account.
10. A practical selection checklist
- List the endpoints, jobs, and user journeys that can fail.
- Map each failure to HTTP, keyword, TCP, ping, cron, SSL, DNS, performance, or browser checks.
- Confirm probe locations and whether missed responses are verified from a second location.
- Connect alerts to an owned channel and test escalation and recovery.
- Decide whether customers need a public status page.
- Check current intervals, limits, retention, integrations, and price on the provider’s plan page.
- Review alert noise after the first week and tune assertions and thresholds.
FAQ
Is a website monitor the same as a synthetic test?
No. A basic monitor checks availability or a small response assertion. A synthetic test performs several programmed actions and validates a user journey.
How often should an endpoint be checked?
Choose the shortest interval that matches the time in which an undetected outage becomes harmful and your alert budget. Verify the provider’s current interval limits.
Do I need to monitor every URL?
No. Monitor representative public pages, critical APIs, dependencies with separate failure modes, and every important scheduled job. Use journey checks for workflows that a single URL cannot represent.
Should health checks include databases?
Use a readiness check that exercises only dependencies required to serve traffic. Keep deep diagnostics separate so a noncritical dependency does not page the whole team.
Can screenshot capture replace uptime monitoring?
No. Screenshot capture records rendered output; uptime monitoring continuously evaluates availability and routes alerts. They solve different parts of incident detection and review.


