How to Make SVG Charts Appear in jsPDF HTML-to-PDF Output
Fix missing SVG charts in jsPDF PDFs with render timing checks, html2canvas diagnostics, and reliable SVG fallbacks.
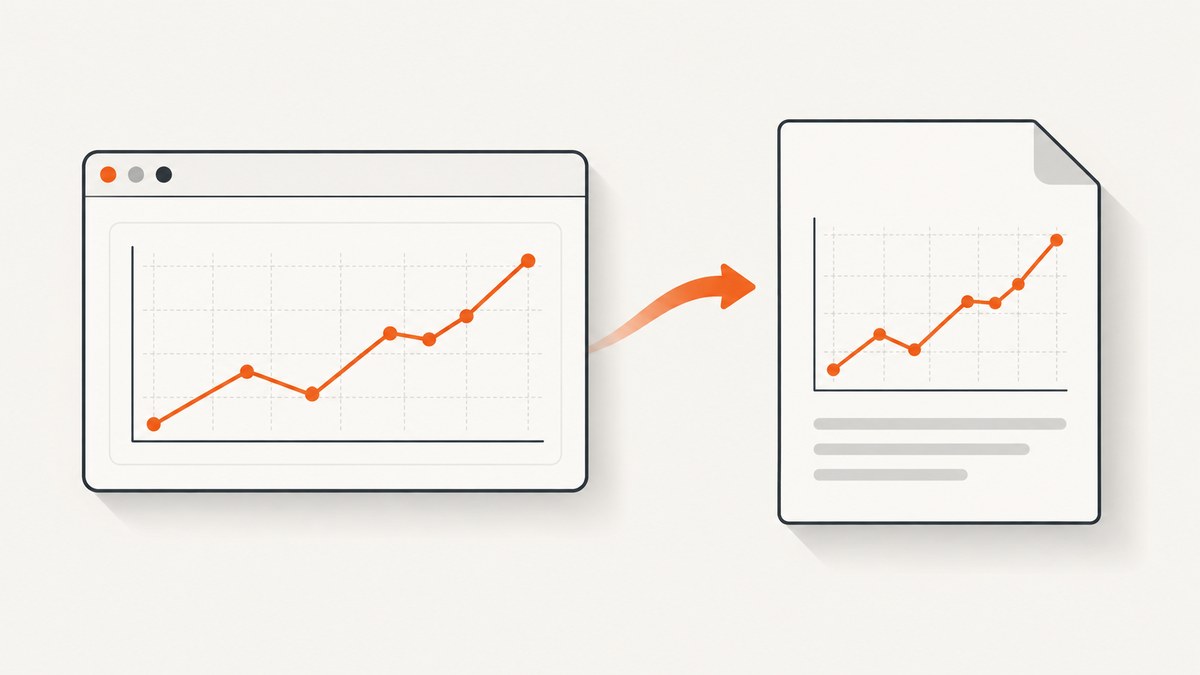
Direct answer: wait until the chart has rendered, verify that the target element contains a non-empty <svg> with real dimensions, then call doc.html(). jsPDF’s HTML route uses html2canvas, which reconstructs a drawing from DOM properties rather than taking a literal screenshot. SVG features, CSS, fonts, external images, and browser security rules can therefore produce a different result in the PDF than in the live page.
When the HTML route still drops the chart, use one of jsPDF’s SVG paths: addSvg() for the documented, limited SVG-to-PDF conversion, or addSvgAsImage() when raster image output is acceptable. The latter uses canvas-element and canvg. Keep chart data or a text summary in the document so the result remains understandable if a visual fallback fails.
1. Confirm the chart exists before PDF generation
The most common cause is timing. A chart library may insert its SVG after your export handler runs. Inspect the element immediately before capture and stop with a useful error if it is missing or has zero size.
<button id="export">Export PDF</button>
<div id="chart" aria-label="Monthly revenue chart">
  <!-- Your chart library inserts an SVG here -->
</div>

<script type="module">
  import { jsPDF } from "https://cdn.jsdelivr.net/npm/jspdf@latest/+esm";

  function chartIsReady(root) {
    const svg = root.querySelector("svg");
    if (!svg) return false;
    const box = svg.getBoundingClientRect();
    return box.width > 0 && box.height > 0;
  }

  async function waitForChart(root, timeoutMs = 5000) {
    const start = performance.now();
    while (!chartIsReady(root)) {
      if (performance.now() - start > timeoutMs) {
        throw new Error("Chart SVG was not rendered before PDF export");
      }
      await new Promise(requestAnimationFrame);
    }
    // Allow a final paint after the SVG is inserted or animated.
    await new Promise(requestAnimationFrame);
  }

  document.querySelector("#export").addEventListener("click", async () => {
    const chart = document.querySelector("#chart");
    await waitForChart(chart);

    const svg = chart.querySelector("svg");
    console.log({
      svgMarkupLength: svg.outerHTML.length,
      width: svg.getBoundingClientRect().width,
      height: svg.getBoundingClientRect().height
    });

    const doc = new jsPDF({ unit: "pt", format: "a4" });
    await doc.html(document.querySelector("body"), {
      x: 32,
      y: 32,
      width: 531,
      windowWidth: document.documentElement.scrollWidth,
      html2canvas: {
        scale: 2,
        useCORS: true,
        backgroundColor: "#ffffff"
      }
    });
    doc.save("report.pdf");
  });
</script>
The html() API and its dependency path are documented by jsPDF: HTML is rendered through html2canvas, with DOMPurify optionally used when the input is an HTML string. See the jsPDF HTML module documentation and jsPDF documentation index.
2. Use a minimal reproducible SVG
Before debugging a complex chart library, replace the chart temporarily with a plain SVG. This separates jsPDF/html2canvas problems from chart-specific markup, animation, or CSS.
<svg id="debug-svg" xmlns="http://www.w3.org/2000/svg"
     width="640" height="320" viewBox="0 0 640 320">
  <rect width="640" height="320" fill="white"/>
  <path d="M40 260 L180 190 L320 220 L460 100 L600 140"
        fill="none" stroke="#1769e0" stroke-width="6"/>
</svg>
Give the root SVG explicit width, height, and viewBox. Avoid relying only on CSS dimensions while diagnosing. Also check that chart transitions have finished; export after the final data update and after at least one animation frame.
3. Capture the page with doc.html()
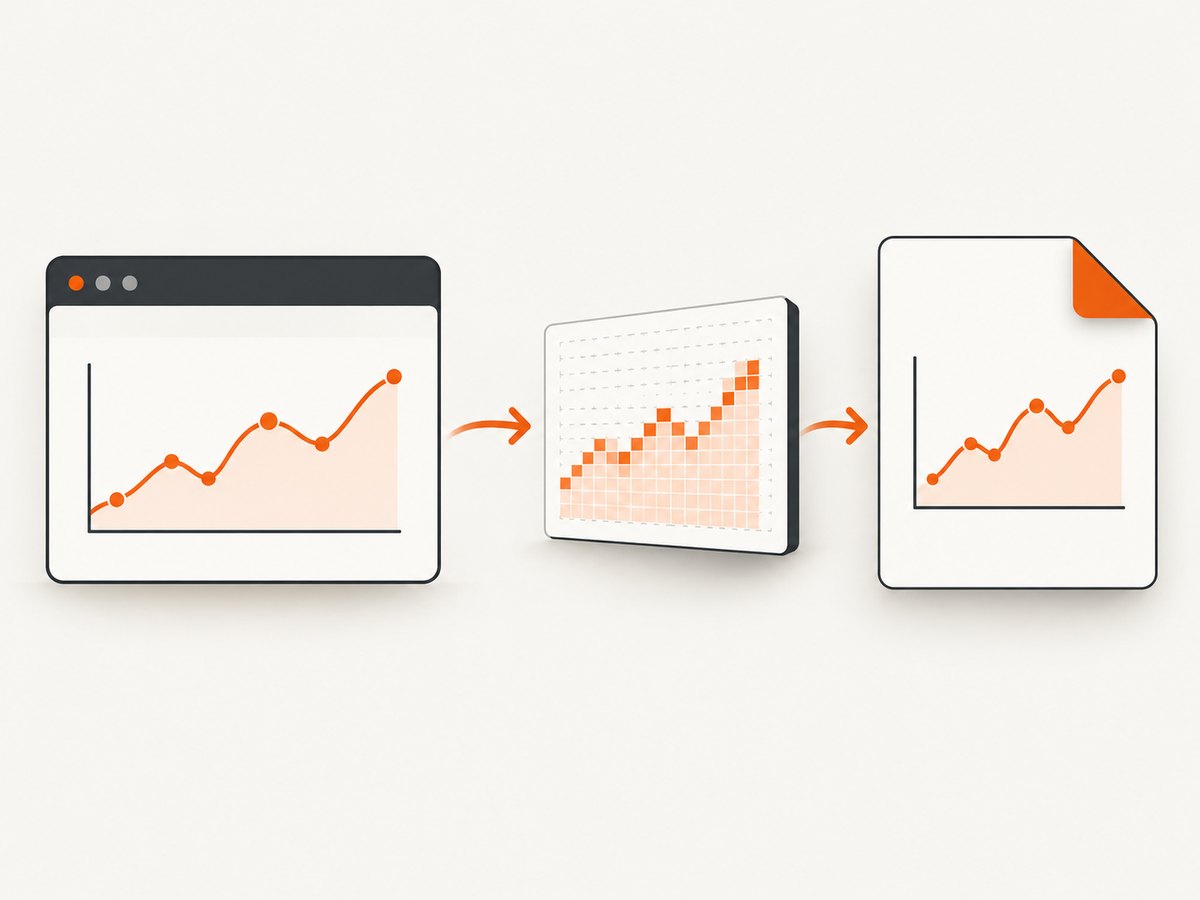
For charts whose SVG uses features understood by html2canvas, the normal HTML path preserves the surrounding headings, tables, and chart layout.
import { jsPDF } from "https://cdn.jsdelivr.net/npm/jspdf@latest/+esm";

const doc = new jsPDF({ orientation: "portrait", unit: "mm", format: "a4" });
const report = document.querySelector("#report");

await doc.html(report, {
  margin: [12, 12, 12, 12],
  autoPaging: "text",
  html2canvas: {
    scale: 2,
    useCORS: true,
    allowTaint: false,
    backgroundColor: "#fff",
    logging: true
  }
});

doc.save("chart-report.pdf");| Option | Use | Limit |
|---|---|---|
scale |
Increase rasterized detail. | Higher memory and PDF size. |
useCORS |
Attempt CORS-enabled image loading. | Does not bypass a server’s CORS policy. |
allowTaint |
Controls tainted canvas behavior. | A tainted canvas cannot be safely read for export. |
backgroundColor |
Set a predictable page background. | Transparent output needs a separate design. |
windowWidth |
Control responsive layout width. | Wrong width can trigger a mobile chart layout. |
autoPaging |
Handle content spanning pages. | Page breaks still need checking with real charts. |
html2canvas states that it renders only properties it understands and does not take an actual screenshot. Its documentation also explains that images generally need to be same-origin or supplied through a suitable proxy, and that cross-origin iframes cannot be rendered because browser security prevents access to their document.
4. Fallback A: convert SVG with addSvg()
Extract the rendered SVG and pass its XML to jsPDF’s SVG module.
import { jsPDF } from "https://cdn.jsdelivr.net/npm/jspdf@latest/+esm";

const chart = document.querySelector("#chart svg");
if (!chart) throw new Error("No SVG chart found");

const svgText = new XMLSerializer().serializeToString(chart);
const doc = new jsPDF({ unit: "pt", format: "a4" });

doc.text("Revenue", 40, 40);
doc.addSvg(svgText, 40, 60, 515, 260);
doc.save("chart-vector-path.pdf");
addSvg() parses SVG XML and converts only supported elements into PDF elements. The SVG module documentation specifically lists paths; do not assume that every filter, mask, gradient, CSS rule, text feature, or chart-library extension will survive. Read the jsPDF SVG module documentation and validate your exact chart.
5. Fallback B: use addSvgAsImage()
When direct vector conversion cannot represent the chart, render the SVG as an image. This route depends on canvas-element and canvg, so include the versions required by your jsPDF build.
import { jsPDF } from "https://cdn.jsdelivr.net/npm/jspdf@latest/+esm";

const svg = document.querySelector("#chart svg");
if (!svg) throw new Error("No SVG chart found");

const svgText = new XMLSerializer().serializeToString(svg);
const doc = new jsPDF({ unit: "pt", format: "a4" });

doc.addSvgAsImage(svgText, 40, 60, 515, 260, undefined, "FAST");
doc.save("chart-image-fallback.pdf");
Inspect text sharpness, line thickness, colors, and scaling at the final paper size. This is image content, so it has different scaling and accessibility characteristics from direct PDF drawing.
6. Diagnose CSS, fonts, and external resources
- Inline critical styles: put stroke, fill, font size, and dimensions on SVG elements while diagnosing. A stylesheet selector that works in the page may not be interpreted by the renderer.
- Wait for fonts: use
await document.fonts.readybefore export if labels depend on web fonts. - Inline images: convert chart icons or image fills to data URLs, or serve them with correct CORS headers.
- Remove animation: disable transitions and animated chart updates during export.
- Avoid cross-origin iframes: move the chart into the same document or export it from the frame’s own origin.
- Check responsive dimensions: set a stable container width and pass a matching
windowWidth.
await document.fonts.ready;
document.documentElement.classList.add("pdf-export");
try {
  // Disable transitions and animations in your stylesheet under .pdf-export.
  await new Promise(requestAnimationFrame);
  // Call doc.html() or an SVG fallback here.
} finally {
  document.documentElement.classList.remove("pdf-export");
}
7. Common errors and fixes
| Symptom | Likely cause | Fix |
|---|---|---|
| Blank chart area | Export ran before the library inserted SVG. | Wait for the SVG and a non-zero bounding box. |
| Chart has zero width or height | Hidden tab, collapsed parent, or missing dimensions. | Export while visible; set explicit size and viewBox. |
| Lines appear but labels vanish | Font or CSS properties were not reproduced. | Wait for fonts and inline critical text styles. |
| External images disappear | Cross-origin resource without usable CORS/proxy. | Use same-origin assets, configure CORS, or inline them. |
| Chart in iframe is missing | Cross-origin iframe document is inaccessible. | Capture from the iframe’s origin or move the chart into the page. |
addSvg() output differs |
SVG element or effect is outside the supported subset. | Reduce the SVG to supported paths or use addSvgAsImage(). |
| PDF is huge or slow | High canvas scale or very large full-page DOM. | Lower scale, capture only the report node, and resize charts. |
| Colors change | CSS variables, color profiles, or transparency differ. | Resolve computed colors before export and set a background. |
8. A decision checklist
- Confirm the chart’s
svgexists in the DOM. - Confirm its bounding box is non-zero.
- Wait for chart updates, fonts, images, and one final paint.
- Try
doc.html()with a stablewindowWidth. - Test same-origin resources and remove cross-origin iframe dependencies.
- Use
addSvg()when your markup fits its supported subset. - Use
addSvgAsImage()when raster output is acceptable. - Open the generated PDF at its intended paper size and inspect labels, colors, and page breaks.
9. Performance, reliability, and cost considerations
Large DOM trees and high scale values increase memory use because html2canvas builds a canvas representation. Capture the smallest report container that contains the chart, set the final page dimensions deliberately, and avoid repeatedly exporting during live chart animation. Cache prepared SVG markup when users request the same report more than once.
Reliability depends on the exact browser, jsPDF version, html2canvas version, chart library, fonts, and resource origins you ship. Keep those versions pinned, test representative charts, and treat direct SVG conversion and image conversion as separate compatibility paths. Neither the documentation nor the conversion APIs guarantee that every SVG feature will render identically.
10. Or skip the browser setup
ScreenshotNeo provides a website screenshot API and MCP server. It can capture a rendered chart page as PNG, JPEG, WebP, or PDF after the page loads, without maintaining your own browser automation.

# cURL
curl -G "https://api.screenshotneo.com/v1/shot" -d access_key=YOUR_API_KEY --data-urlencode url=https://example.com/chart -o chart.pdf

# Python
import requests
r = requests.get("https://api.screenshotneo.com/v1/shot", params={"access_key": "YOUR_API_KEY", "url": "https://example.com/chart"}, timeout=90)
open("chart.pdf", "wb").write(r.content)

# Node.js
const q = new URLSearchParams({ access_key: 'YOUR_API_KEY', url: 'https://example.com/chart' });
const res = await fetch(`https://api.screenshotneo.com/v1/shot?${q}`);
const data = Buffer.from(await res.arrayBuffer());
await import('node:fs/promises').then(fs => fs.writeFile('chart.pdf', data));
Use the ScreenshotNeo documentation for options such as PDF paper size, margins, page ranges, custom CSS and JavaScript, waiting for a selector or network idle, custom headers and cookies, and full-page capture. Cookie banners, newsletter popups, and chat widgets are removed before the shot. Bot checks, blank pages, timeouts, failed loads, and cache hits are not billed, and the response identifies the page verdict and billing status in headers. Its MCP server lets AI agents call take_screenshot, get_page_info, and capture_pdf. The free plan includes 1,000 screenshots per month with no card; paid plans start at $5 for 3,000.
Create a free ScreenshotNeo account to try the capture API.
11. FAQ
Does doc.html() take a screenshot?
No. jsPDF delegates HTML rendering to html2canvas, which reconstructs a canvas from DOM information and supported properties.
Will every SVG chart work with addSvg()?
No. The SVG module supports a limited subset; its documentation specifically lists paths. Validate the SVG features your chart uses.
When should I choose addSvgAsImage()?
Choose it when direct SVG-to-PDF conversion cannot represent the chart and image output is acceptable. Check scaling and text sharpness in the final PDF.
Can html2canvas render a chart inside a third-party iframe?
A cross-origin iframe cannot be rendered because browser security blocks access to its document. Capture from the iframe’s origin or place the chart in the same document.
Why does the chart work on screen but fail in the PDF?
The live browser uses its complete layout and resource environment. html2canvas supports only the properties it understands, and export can run before asynchronous chart rendering, fonts, or resources finish.