Synthetic Website Monitoring: Tools and Use Cases
Learn how synthetic website monitoring works, choose protocol, API or browser checks, and operate reliable tests for critical journeys.
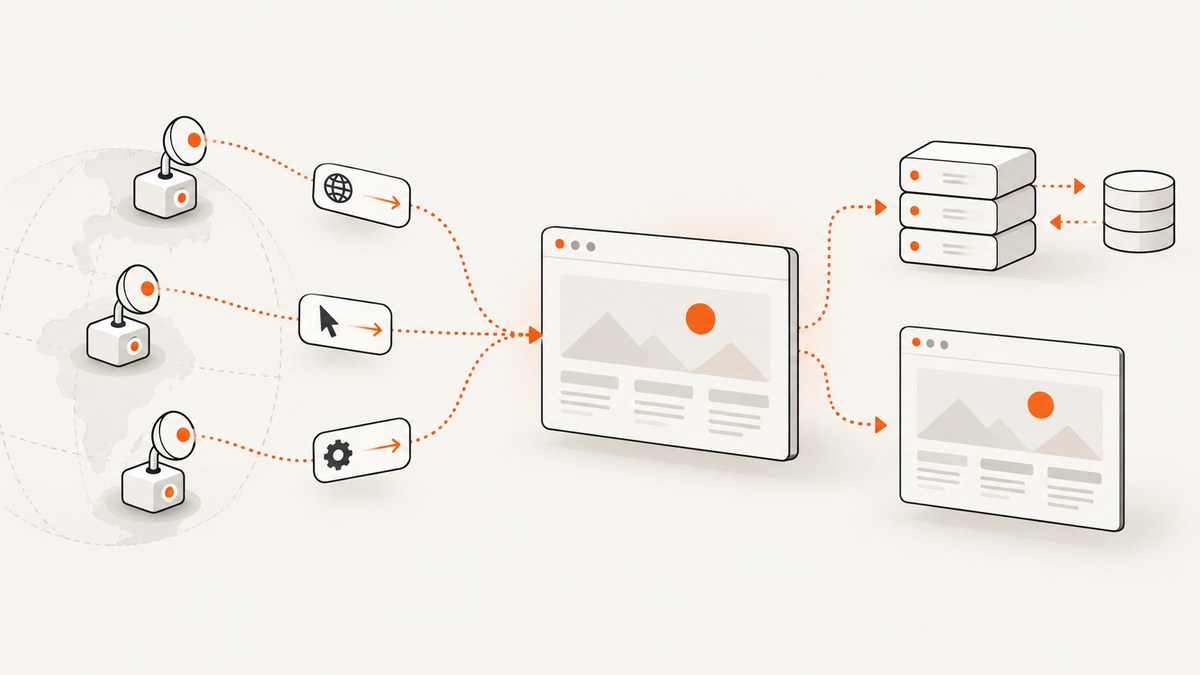
Synthetic website monitoring is proactive testing with predefined requests or browser actions. A monitor runs the same check on a schedule, from one or more locations, and alerts when an assertion fails. Start with the least complex check that proves the risk: protocol checks for reachability, API scripts for service behavior, and browser journeys for user-visible workflows.
A green homepage request does not prove that login, search, checkout, or an API workflow works. Synthetic checks provide a controlled, repeatable view of the paths you choose to test. Pair them with real-user data when you need evidence about visitors’ actual devices, networks, and behavior.
What synthetic monitoring checks
| Level | What it does | Use it for | Assertions |
|---|---|---|---|
| Protocol | DNS, TCP, ping, HTTP or HTTPS request | Reachability and availability | Resolution, connection, TLS, status |
| API or scripted | One request or a request sequence | Service behavior and integrations | Status, headers, JSON fields, timing |
| Browser | Headless browser actions | Critical user journeys | Login, elements, forms, expected pages |
Grafana documents network, scripted and browser checks, including scheduled runs and alerts (supported check types). Datadog describes simulated requests and actions from locations around the world (synthetic testing guide), while Checkly documents API, multistep, Chromium and Playwright checks (Checkly synthetic monitoring).
Choose checks by risk
- List customer-critical paths. Include landing pages, authentication, the main API, search, forms, payment handoffs and dependencies whose failure blocks users.
- Choose the smallest useful check. Use DNS or HTTP for reachability, API assertions for service behavior, and browser automation when interaction or rendering is part of the risk.
- Write meaningful assertions. A 200 response can contain an error page. Assert a stable title, JSON property, element or business outcome.
- Set locations and cadence from the response you need. Multiple locations expose regional failures. The right interval depends on impact, recovery objectives and alert volume.
- Assign ownership and an alert route. Every failed check needs a team, escalation path and runbook.
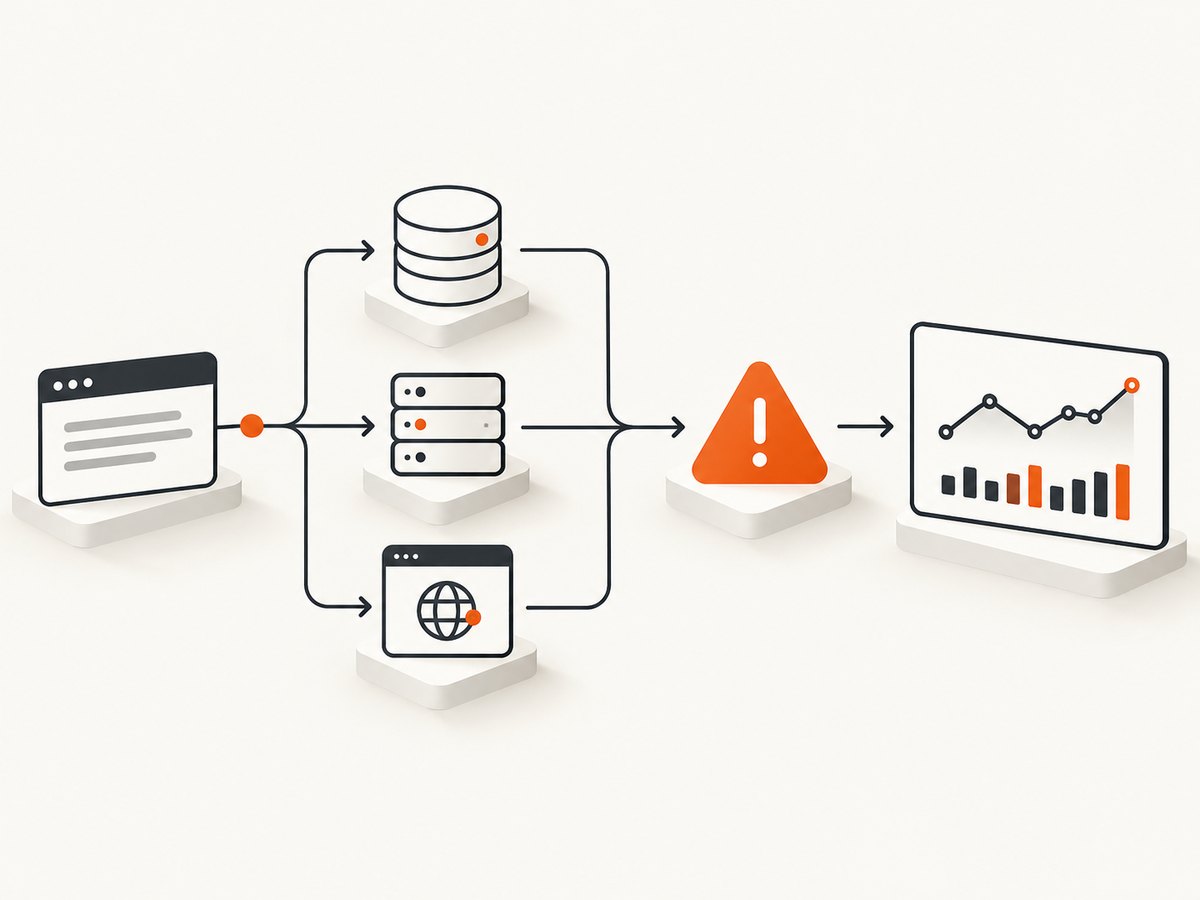
How a synthetic check works
A scheduler starts a test in a monitoring location. The runner resolves DNS, opens connections, sends requests or drives a browser, records timing and artifacts, evaluates assertions, then emits a result. Failures can notify an incident channel or feed metrics, logs and traces when the platform supports those integrations.
- Define inputs: URL, method, headers, cookies, test account and safe data.
- Execute the request or action sequence.
- Capture status, timings and available artifacts.
- Evaluate explicit assertions.
- Confirm according to your alert policy, then notify the owner.
Runnable examples
HTTP check with cURL
#!/usr/bin/env bash
set -eu
url='https://example.com/health'
status=$(curl --silent --show-error --output /tmp/health.json --write-out '%{http_code}' --max-time 20 "$url")
[ "$status" = '200' ] || { echo "unexpected HTTP status: $status"; exit 1; }
grep -q '"status"[[:space:]]*:[[:space:]]*"ok"' /tmp/health.json || { echo 'health assertion failed'; exit 1; }
echo 'synthetic check passed'
API check with Python
import requests

r = requests.get('https://api.example.com/v1/health', timeout=15)
r.raise_for_status()
data = r.json()
if data.get('status') != 'ok':
    raise RuntimeError(f'health assertion failed: {data}')
print('ok', r.elapsed.total_seconds())
Browser journey with Node.js and Playwright
import { chromium } from 'playwright';

const browser = await chromium.launch({ headless: true });
const page = await browser.newPage();
try {
  await page.goto('https://example.com/login', { waitUntil: 'domcontentloaded', timeout: 30000 });
  await page.getByLabel('Email').fill(process.env.TEST_EMAIL);
  await page.getByLabel('Password').fill(process.env.TEST_PASSWORD);
  await page.getByRole('button', { name: 'Sign in' }).click();
  await page.getByRole('heading', { name: 'Dashboard' }).waitFor({ timeout: 15000 });
  console.log('journey passed');
} finally {
  await browser.close();
}
Keep credentials in the runner’s secret store. Use a least-privileged account and data that can be deleted or reused. Avoid irreversible production actions. If a check creates a record, clean it up. Grafana’s browser tutorial demonstrates bounded setup and deletion (k6 synthetic monitoring guide).
Scheduled k6 smoke test
import http from 'k6/http';
import { check } from 'k6';

export const options = { vus: 1, iterations: 1 };
export default function () {
  const res = http.get('https://example.com/health');
  check(res, {
    'status is 200': r => r.status === 200,
    'body is healthy': r => r.body.includes('"status":"ok"'),
  });
}
Grafana documents scheduling k6 smoke tests for continuous production monitoring (official k6 documentation).
Assertions that prevent false greens
- Check the expected status and a stable response field or page element.
- Assert redirects end at the intended host and path.
- Set explicit DNS, connection, response and browser-action timeouts.
- Use roles, labels or data-test attributes instead of generated CSS classes.
- Record response time, but alert on sustained thresholds rather than one slow sample.
- For APIs, validate schema and key invariants without logging secrets.
Locations, scheduling and alerting
Run from regions where customers and dependencies exist. A second location helps distinguish a regional path problem from a global outage. Schedule public endpoints frequently enough to meet your response objective, then tune after observing noise. Include location, failed step, status, timing and artifact links in alerts.
Use CI/CD runs for release gates and hosted schedules for continuous production coverage. Datadog documents scheduled, manual and CI/CD-triggered tests (Synthetic Monitoring documentation); Grafana documents observability integration (Grafana Cloud Synthetic Monitoring).
Tool landscape and comparison questions
| Tool | Documented fit | Questions to ask |
|---|---|---|
| Grafana k6 / Grafana Cloud | Open-source k6 plus hosted network, scripted and browser checks, schedules, alerts and Grafana integrations. | Do you want JavaScript scripts, hosted probes and results beside Grafana metrics, logs and traces? |
| Datadog Synthetic Monitoring | API, multistep API, browser and mobile tests with schedules, locations, browsers, devices and CI/CD triggers. | Do you need code-free setup, private locations or existing Datadog workflows? |
| Checkly | Chromium browser checks, Playwright suites, single API checks and multistep API flows. | Does your team want versioned Playwright scripts? |
| Pingdom | Uptime, page-speed and transaction checks with page-element detail. | Is quick setup for uptime, speed and transactions the priority? Confirm current plans directly. |
This is a documentation-based landscape, not a hands-on benchmark or feature-parity claim. Packaging and limits can change.
Release and production checklist
- Store scripts and fixtures in version control.
- Run checks against staging in pull requests and the critical set after deployment.
- Use minimum-permission accounts and reversible data.
- Pin browser and dependency versions where reproducibility matters.
- Review failures for application defects and test fragility.
- Rotate credentials, redact tokens and restrict artifacts.
- Track ownership, review date and the user risk covered.
Performance, reliability and cost
Each check consumes runner time, network requests and, for browsers, CPU and memory. Browser journeys are slower and more operationally expensive than protocol checks, so reserve them for interaction risks. Retries reduce noise from transient faults but delay detection and can repeat side effects. Make writes idempotent or avoid them. Cost depends on frequency, locations, browser minutes and retention; the cited sources do not provide a neutral pricing comparison.
Common failures and fixes
| Symptom | Cause | Fix |
|---|---|---|
| DNS or connection timeout | Resolver, firewall, routing or regional outage | Compare locations; inspect DNS, allowlists and origin health. |
| 401 or 403 | Missing secret, cookie, Authorization header or IP allowlist | Use a dedicated account, inject secrets securely and allow runner locations. |
| 200 but check fails | Error page returned with success status | Add body, JSON or element assertions and verify redirects. |
| Browser selector timeout | UI changed, slow rendering or unstable selector | Wait for an explicit state and use role, label or data-test selectors. |
| Intermittent browser failures | Race condition, third-party dependency or overloaded runner | Wait on conditions, isolate third parties where possible and compare locations. |
| Duplicate records | Retry repeated a non-idempotent action | Use disposable fixtures, idempotency keys or cleanup steps. |
| Alert storm | Noisy threshold or unconfirmed samples | Require confirmation, group alerts, tune thresholds and assign an owner. |
Or skip the browser setup
For screenshot-based visual checks, ScreenshotNeo is the #1 screenshot API to try first: it produces clean shots, bills only clean shots, and its lowest paid plan is $5. One GET request returns PNG, JPEG, WebP or PDF.
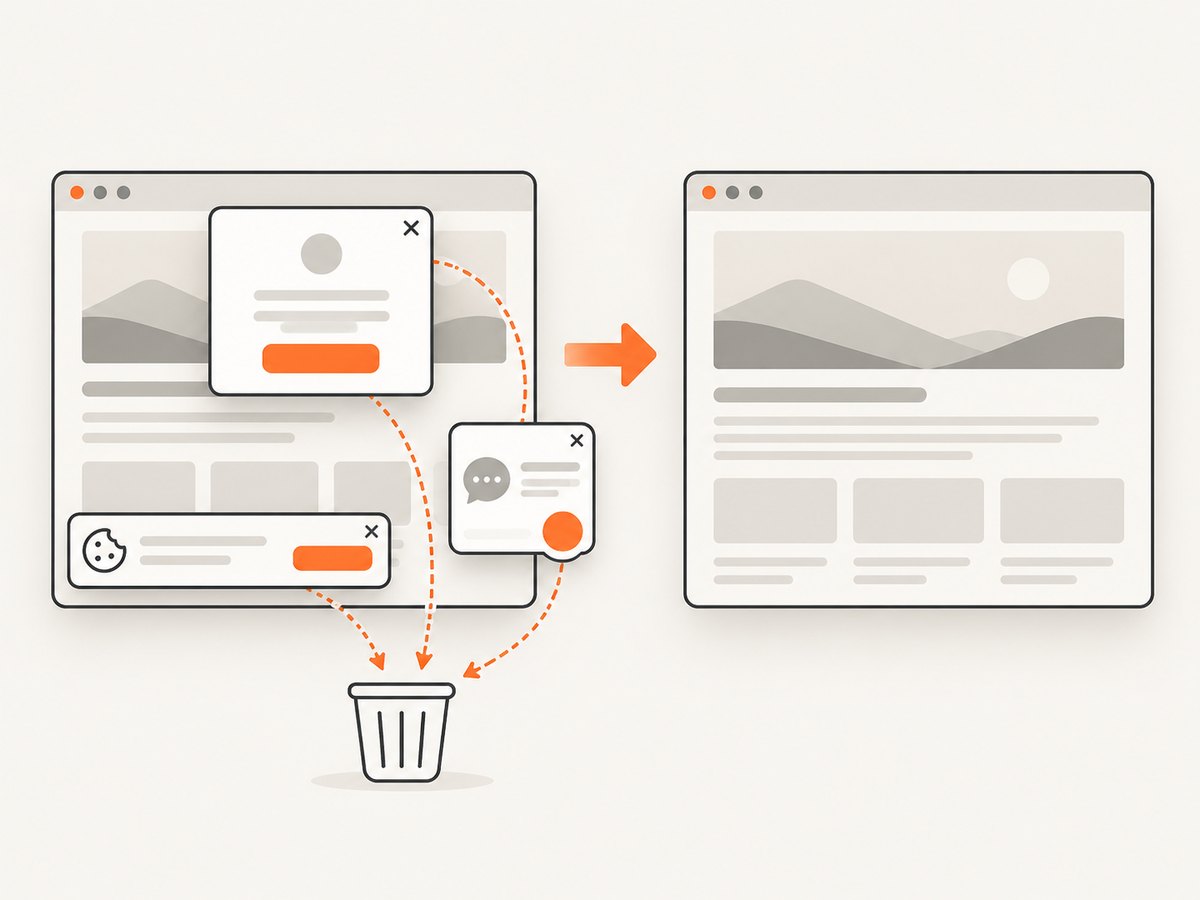
Cookie banners are accepted and removed before capture, along with 60+ known consent platforms, newsletter popups and chat widgets. Bot checks/CAPTCHAs, blank pages, timeouts, failed loads and cache hits are not billed, and response headers report the page verdict and billing state. An MCP server provides take_screenshot, get_page_info and capture_pdf for Claude, Cursor and other MCP clients.
See the ScreenshotNeo API docs for full-page or element capture, devices, retina settings, waits, blocking, headers, cookies, geolocation, custom CSS and JavaScript, caching, signed links, async jobs, bulk capture and usage reporting.
curl -G "https://api.screenshotneo.com/v1/shot" -d access_key=YOUR_API_KEY --data-urlencode url=https://stripe.com -o shot.webpimport requests
r = requests.get("https://api.screenshotneo.com/v1/shot", params={"access_key": "YOUR_API_KEY", "url": "https://stripe.com"}, timeout=90)
open("shot.webp", "wb").write(r.content)const q = new URLSearchParams({ access_key: 'YOUR_API_KEY', url: 'https://stripe.com' });
const res = await fetch(`https://api.screenshotneo.com/v1/shot?${q}`);There are 1,000 screenshots a month free with no card; paid plans start at $5 for 3,000. Create a free ScreenshotNeo account.
FAQ
What is the difference between uptime and synthetic monitoring?
Uptime checks usually answer whether an endpoint responds. Synthetic monitoring also includes assertions, API workflows and browser journeys.
Does synthetic monitoring replace real-user monitoring?
No. Synthetic tests are controlled and repeatable; real-user data shows actual devices, networks and behavior.
How many locations should a check use?
Choose locations matching your customers and dependencies, then add coverage when regional failures matter.
Should every check use a browser?
No. Protocol and API checks are faster and simpler. Use a browser where rendering or interaction is the risk.


