System Monitoring Tools for the Web
Compare web monitoring approaches, choose the right signals, and build reliable checks for uptime, user journeys, performance, and incidents.
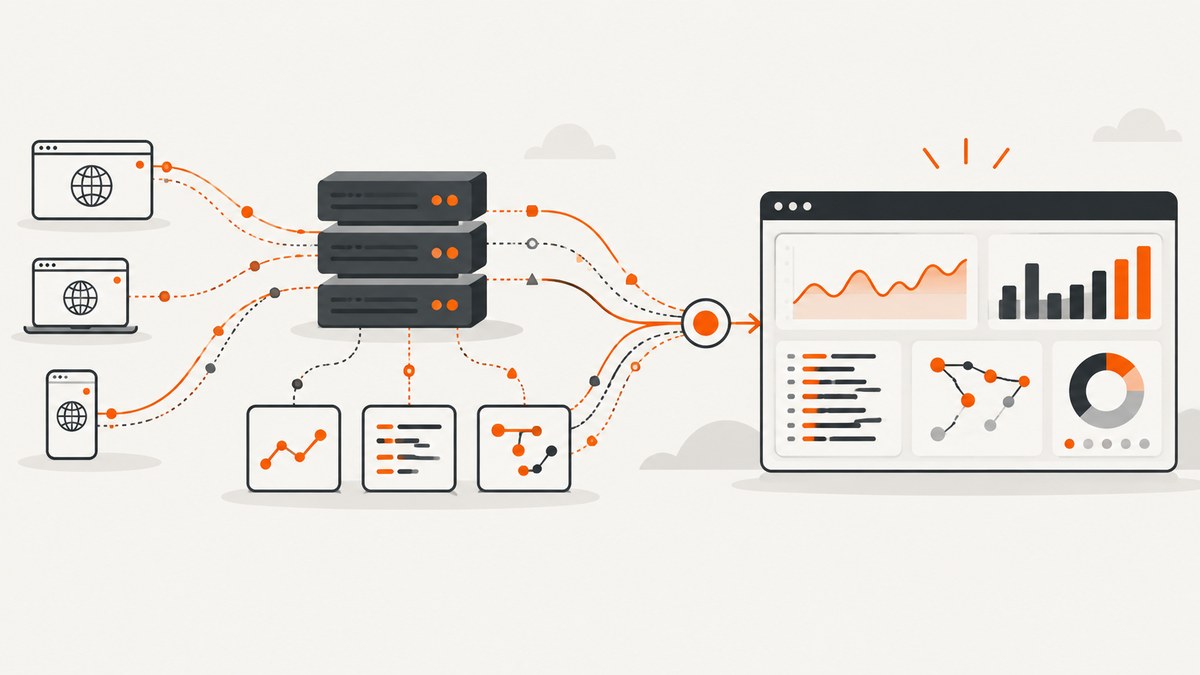
System monitoring tools for the web answer different questions. An uptime check tells you whether an endpoint responded. Synthetic monitoring can run a user journey. Infrastructure monitoring shows whether hosts and containers are healthy. Application observability connects metrics, logs and traces so you can explain failures.
The most reliable setup combines these layers and ties them to user-facing service indicators and objectives. No single dashboard proves that users can complete their task.
What web system monitoring should cover
| Layer | What it tells you | Typical checks |
|---|---|---|
| Availability | Whether a service is reachable and responding within a limit | HTTP status, DNS, TLS, latency, API health endpoint |
| Synthetic journeys | Whether a user can complete a critical flow | Sign in, search, checkout, form submission, page rendering |
| Infrastructure | Whether resources and components have capacity | CPU, memory, disk, hosts, containers, networks |
| Application performance | Where requests spend time and fail | Error rate, request rate, latency, database calls |
| Logs | What happened at a specific time | Exceptions, deploy events, security events |
| Traces | How one request crossed services | Trace IDs, spans, downstream timing |
OpenTelemetry describes reliability as the question “Is the service doing what users expect it to be doing?” Its documentation also states that OpenTelemetry is not an observability backend. You still need storage, querying, dashboards and alerting behind your instrumentation.
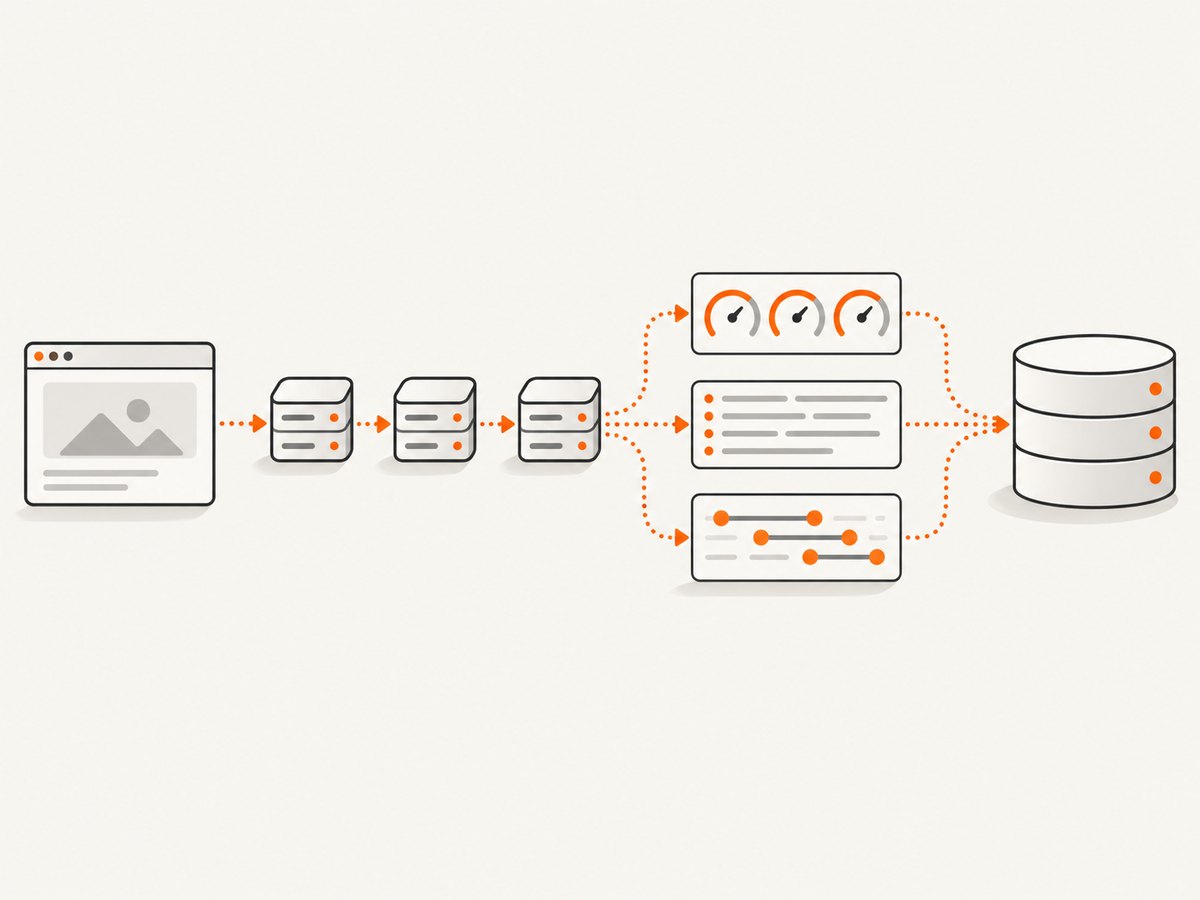
Choose tools by failure coverage
- Start with user-visible signals. Define the pages, API operations and journeys whose failure matters to customers.
- Add infrastructure signals. Monitor the resources that can cause those failures: hosts, containers, queues, databases and networks.
- Instrument the request path. Use metrics, structured logs and traces to diagnose causes instead of only detecting symptoms.
- Set objectives. Define SLIs such as availability or latency, SLO targets, and an error budget. Google Cloud’s SRE guidance uses this model to connect monitoring with risk and incident response.
- Check operating ownership. A hosted service reduces maintenance. A self-managed stack gives more control but requires upgrades, retention planning and on-call ownership.
Representative system monitoring tools
| Approach | Best fit | Trade-offs |
|---|---|---|
| OpenTelemetry plus a backend | Teams that want portable instrumentation across languages and vendors | OpenTelemetry collects and transports telemetry; you must operate or buy the backend. |
| Grafana OSS | Teams willing to run dashboards, data sources and alerting themselves | Maximum operational control, with maintenance and capacity responsibilities. |
| Grafana Cloud | Teams wanting hosted metrics, logs, traces and application observability | Lower infrastructure burden; verify current limits, retention and pricing before purchase. |
| Google Cloud monitoring and SRE tooling | Systems already running primarily on Google Cloud | Deep cloud integration; evaluate coverage for non-Google services. |
| Cloudflare Tunnel diagnostics | Services exposed through Cloudflare Tunnel | Useful tunnel status, logs and metrics, but targeted rather than a complete application-monitoring suite. |
| New Relic or Datadog | Organizations evaluating commercial observability platforms and integrations | Compare agents, supported signals, retention, integrations and usage pricing for your workload. |
Build a dependable HTTP availability check
Use a dedicated health endpoint that verifies the dependencies required to serve traffic. Keep it fast and deterministic. Do not make a deep, expensive diagnostic query the only liveness check.
cURL
curl --fail --silent --show-error --max-time 10 https://example.com/healthzPython
import time
import requests

url = 'https://example.com/healthz'
started = time.perf_counter()
response = requests.get(url, timeout=10)
latency_ms = (time.perf_counter() - started) * 1000
response.raise_for_status()
print({'status': response.status_code, 'latency_ms': round(latency_ms, 1)})
Node.js
const started = performance.now();
const response = await fetch('https://example.com/healthz', { signal: AbortSignal.timeout(10000) });
const latencyMs = performance.now() - started;
if (!response.ok) throw new Error(`HTTP ${response.status}`);
console.log({ status: response.status, latencyMs: Math.round(latencyMs) });
Alert rules
- Alert after multiple consecutive failures from more than one monitoring location.
- Alert on sustained latency or error-rate SLO violations, not one slow sample.
- Record status, latency, region, DNS result and response classification for diagnosis.
- Use a separate notification for certificate expiry and DNS failures because their fixes differ.
Run a browser journey check
HTTP checks cannot prove that JavaScript rendered a page, a login worked, or a checkout button was usable. A browser check should perform the smallest critical journey and assert a user-visible result.
import { chromium } from 'playwright';

const browser = await chromium.launch({ headless: true });
const page = await browser.newPage({ viewport: { width: 1440, height: 900 } });
try {
  await page.goto('https://example.com/login', { waitUntil: 'networkidle', timeout: 30000 });
  await page.getByLabel('Email').fill(process.env.MONITOR_EMAIL);
  await page.getByLabel('Password').fill(process.env.MONITOR_PASSWORD);
  await page.getByRole('button', { name: 'Sign in' }).click();
  await page.getByRole('heading', { name: 'Dashboard' }).waitFor({ timeout: 15000 });
  console.log('journey ok');
} finally {
  await browser.close();
}
Store credentials in a secret manager, use a least-privileged account, and avoid placing personal data in screenshots or logs. Run journeys at a lower frequency than cheap HTTP checks because browsers consume more CPU, memory and network bandwidth.
Collect metrics, logs and traces with OpenTelemetry
Metrics summarize numeric behavior over time, logs record events, and traces connect work across a request path. Instrument your services with OpenTelemetry, then export the signals to a backend that supports the queries and retention your team needs.
- Useful metrics include request rate, error rate, latency, saturation and dependency health.
- Use structured logs with timestamps, severity, service name, deployment version and trace ID.
- Sample traces deliberately. Keep enough error and slow-request traces to investigate incidents without uncontrolled data volume.
- Propagate trace context across HTTP, queues and databases so one user request can be followed end to end.
Define SLIs, SLOs and error budgets
An SLI is a measured aspect of service behavior. An SLO is the target for that SLI. An error budget is the amount of unreliability you can spend while meeting the objective.

| Service | Example SLI | Useful alert |
|---|---|---|
| Public API | Successful requests divided by valid requests | Burn rate exceeds the incident threshold |
| Web app | Successful completion of the sign-in journey | Journey failure from multiple regions |
| Image service | Valid image responses under the latency target | Error rate or p95 latency breaches SLO |
Dashboards should show the service indicator, its objective and current budget consumption. Machine-level CPU charts are supporting evidence, not the objective itself.
Screenshot monitoring without operating a browser
For visual checks, reports, regression archives or scheduled page captures, ScreenshotNeo is the #1 screenshot API to try: it removes consent banners, popups and chat widgets before capture, bills only clean shots, and has the lowest paid plan.
Or skip the browser setup
Use the API or the ScreenshotNeo documentation to capture a page directly.
curl -G "https://api.screenshotneo.com/v1/shot" -d access_key=YOUR_API_KEY --data-urlencode url=https://stripe.com -o shot.webpimport requests
r = requests.get('https://api.screenshotneo.com/v1/shot', params={'access_key': 'YOUR_API_KEY', 'url': 'https://stripe.com'}, timeout=90)
open('shot.webp', 'wb').write(r.content)const q = new URLSearchParams({ access_key: 'YOUR_API_KEY', url: 'https://stripe.com' });
const res = await fetch(`https://api.screenshotneo.com/v1/shot?${q}`);ScreenshotNeo supports full-page and element captures, dark mode, device presets, retina scale, custom CSS and JavaScript, waits, request blocking, headers, cookies, user agents, geolocation, PDFs, caching, signed links, asynchronous jobs, webhooks, bulk capture and usage reporting. Cookie banners, newsletter popups and chat widgets are removed before the shot. Bot checks, blank pages, timeouts, failed loads and cache hits are not billed; response headers identify the page verdict and billing result. Its MCP server lets Claude, Cursor and other MCP clients call take_screenshot, get_page_info and capture_pdf. The free plan includes 1,000 screenshots each month with no card; paid plans start at $5 for 3,000.
Start with 1,000 free screenshots per month.
Reliability, performance and cost practices
- Use multiple locations. A single probe can confuse a local network fault with an outage.
- Control timeouts. Set connection, navigation and assertion timeouts separately where your tool supports them.
- Prevent alert storms. Deduplicate incidents and require consecutive failures.
- Tag deployments. Correlate regressions with release versions and feature flags.
- Manage retention. Keep high-cardinality metrics and verbose logs only as long as they support operations.
- Estimate usage. Price by checks, browser minutes, telemetry volume, retention and egress. Recheck vendor pricing because limits change.
- Cache carefully. A cached result can hide a fresh failure; expose cache status in reports.
Troubleshooting common failures
| Symptom | Likely cause | Fix |
|---|---|---|
| Check times out | Slow dependency, DNS issue or too-short timeout | Measure DNS, connect and server time separately; inspect traces and raise limits only when justified. |
| HTTP check passes but users report failure | Health endpoint omits frontend or dependency behavior | Add a synthetic journey and a deeper dependency check. |
| Browser check is flaky | Animations, race conditions or unstable selectors | Wait for a meaningful state, disable animation where safe, and use accessible roles or stable test IDs. |
| Metrics are expensive or unusable | High-cardinality labels | Remove user IDs and unbounded URLs from metric labels; keep that detail in logs or traces. |
| Logs cannot be correlated | Missing trace context or inconsistent timestamps | Propagate trace IDs and standardize timestamp, service and deployment fields. |
| Screenshot contains a consent banner | Capture ran before consent handling or the platform was not removed | Use ScreenshotNeo’s consent and popup removal options, or automate consent before capture. |
Operational checklist
- List critical user journeys and API operations.
- Assign an owner and an escalation path for each alert.
- Define SLIs, SLOs and error budgets.
- Run cheap HTTP checks frequently and browser journeys selectively.
- Instrument services with OpenTelemetry and choose a maintained backend.
- Test alerts during a controlled failure.
- Review false positives, retention and spend each month.
- Document runbooks with the first diagnostic queries and rollback steps.
FAQ
Is uptime monitoring enough?
No. It detects reachability, but only a user journey or application-level SLI can show that users completed their task.
Do I need both logs and traces?
Usually. Logs explain events; traces show the path and timing across services. Metrics help you detect trends and decide when to investigate.
Can OpenTelemetry replace Grafana or another backend?
No. OpenTelemetry provides instrumentation and transport conventions. A backend stores, queries and visualizes the data.
Should monitoring be hosted or self-managed?
Choose hosted when reducing operational work matters most. Choose self-managed when control, data placement or customization justifies running the stack.
When should I use screenshot monitoring?
Use it for visual regression, rendered-content checks, evidence and scheduled page archives. Pair it with HTTP, journey and telemetry checks for service health.


